 Deutsch
 English
 Español
 Français
 Italiano
 Nederlands
 Polski
 Português
 Русский
 Türkçe
 Svenska
 Chinese
 Magyar
Recensione breve del Portatile Acer Predator 17 X (7820HK, FHD, GTX 1080)
| SD Card Reader | |
| average JPG Copy Test (av. of 3 runs) | |
| Asus G701VIK-BA049T | |
| MSI GT73VR 7RF-296 | |
| MSI GT72VR 7RE-433 | |
| Acer Predator 17 X GX-792-76DL | |
| Acer Predator 17 G9-793-77LG | |
| Aorus X7 v6 | |
| Asus G752VS-XB78K | |
| maximum AS SSD Seq Read Test (1GB) | |
| Asus G701VIK-BA049T | |
| MSI GT73VR 7RF-296 | |
| MSI GT72VR 7RE-433 | |
| Acer Predator 17 X GX-792-76DL | |
| Acer Predator 17 G9-793-77LG | |
| Aorus X7 v6 | |
| Asus G752VS-XB78K | |
| Networking | |
| iperf3 transmit AX12 | |
| Acer Predator 17 X GX-792-76DL | |
| MSI GT73VR 7RF-296 | |
| MSI GT72VR 7RE-433 | |
| Aorus X7 v6 | |
| Asus G701VIK-BA049T | |
| iperf3 receive AX12 | |
| MSI GT73VR 7RF-296 | |
| Acer Predator 17 X GX-792-76DL | |
| Asus G701VIK-BA049T | |
| MSI GT72VR 7RE-433 | |
| Aorus X7 v6 | |

| |||||||||||||||||||||||||
Distribuzione della luminosità: 91 %
Al centro con la batteria: 380 cd/m²
Contrasto: 1027:1 (Nero: 0.37 cd/m²)
ΔE Color 4.12 | 0.5-29.43 Ø5
ΔE Greyscale 3.95 | 0.57-98 Ø5.3
84% sRGB (Argyll 1.6.3 3D)
55% AdobeRGB 1998 (Argyll 1.6.3 3D)
61.2% AdobeRGB 1998 (Argyll 2.2.0 3D)
83.7% sRGB (Argyll 2.2.0 3D)
66% Display P3 (Argyll 2.2.0 3D)
Gamma: 2.47
| Acer Predator 17 X GX-792-76DL LP173WF4-SPF5 (LGD056D), 1920x1080, 17.30 | MSI GT73VR 7RF-296 N173HHE-G32 (CMN1747), 1920x1080, 17.30 | Asus G701VIK-BA049T B173HAN01.1 (AUO119D), 1920x1080, 17.30 | Asus G752VS-XB78K LG Philips LP173WF4-SPF3 (LGD04E8), 1920x1080, 17.30 | MSI GT72VR 7RE-433 Chi Mei N173HHE-G32 (CMN1747), 1920x1080, 17.30 | Aorus X7 v6 B173QTN01.0 (AUO1096), 2560x1440, 17.30 | Acer Predator 17 G9-793-77LG AU Optronics B173ZAN01.0 (AUO109B), 3840x2160, 17.30 | |
|---|---|---|---|---|---|---|---|
| Display | 31% | 5% | 2% | 4% | -2% | 38% | |
| Display P3 Coverage | 66 | 90.6 37% | 68.8 4% | 66.9 1% | 68.3 3% | 60.9 -8% | 86.9 32% |
| sRGB Coverage | 83.7 | 99.9 19% | 87.7 5% | 85.2 2% | 86.7 4% | 84.2 1% | 100 19% |
| AdobeRGB 1998 Coverage | 61.2 | 84.7 38% | 64.1 5% | 62.3 2% | 63.4 4% | 61.2 0% | 99.4 62% |
| Response Times | 59% | 23% | 19% | 56% | 48% | 16% | |
| Response Time Grey 50% / Grey 80% * | 45 ? | 26 ? 42% | 38 ? 16% | 38 ? 16% | 29 ? 36% | 31 ? 31% | 37 ? 18% |
| Response Time Black / White * | 28 ? | 7 ? 75% | 20 ? 29% | 22 ? 21% | 7 ? 75% | 10 ? 64% | 24 ? 14% |
| PWM Frequency | |||||||
| Screen | -33% | 2% | 3% | -33% | -31% | 13% | |
| Brightness middle | 380 | 307 -19% | 306 -19% | 328 -14% | 299 -21% | 343 -10% | 336 -12% |
| Brightness | 362 | 284 -22% | 299 -17% | 317 -12% | 277 -23% | 312 -14% | 320 -12% |
| Brightness Distribution | 91 | 85 -7% | 91 0% | 88 -3% | 87 -4% | 80 -12% | 88 -3% |
| Black Level * | 0.37 | 0.25 32% | 0.27 27% | 0.3 19% | 0.27 27% | 0.5 -35% | 0.25 32% |
| Contrast | 1027 | 1228 20% | 1133 10% | 1093 6% | 1107 8% | 686 -33% | 1344 31% |
| Colorchecker dE 2000 * | 4.12 | 9.65 -134% | 3.98 3% | 3.74 9% | 9.65 -134% | 7.33 -78% | 3.61 12% |
| Colorchecker dE 2000 max. * | 8.19 | 16.36 -100% | 7.29 11% | 8.97 -10% | 15.43 -88% | 10.79 -32% | 6.02 26% |
| Greyscale dE 2000 * | 3.95 | 10.07 -155% | 4.15 -5% | 2.67 32% | 9.68 -145% | 7.6 -92% | 4.78 -21% |
| Gamma | 2.47 89% | 2.12 104% | 2.45 90% | 2.41 91% | 1.89 116% | 2.19 100% | 2.32 95% |
| CCT | 6539 99% | 12145 54% | 7386 88% | 6861 95% | 11652 56% | 9024 72% | 6185 105% |
| Color Space (Percent of AdobeRGB 1998) | 55 | 75 36% | 58 5% | 56 2% | 75 36% | 55 0% | 88 60% |
| Color Space (Percent of sRGB) | 84 | 100 19% | 89 6% | 85 1% | 100 19% | 84 0% | 100 19% |
| Media totale (Programma / Settaggio) | 19% /
-8% | 10% /
5% | 8% /
5% | 9% /
-14% | 5% /
-15% | 22% /
18% |
* ... Meglio usare valori piccoli
Tempi di risposta del Display
| ↔ Tempi di risposta dal Nero al Bianco | ||
|---|---|---|
| 28 ms ... aumenta ↗ e diminuisce ↘ combinato | ↗ 6 ms Incremento | 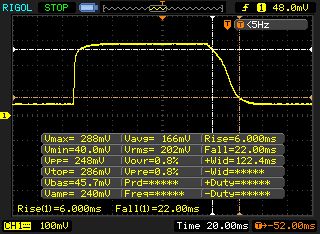 |
| ↘ 22 ms Calo | ||
| Lo schermo mostra tempi di risposta relativamente lenti nei nostri tests e potrebbe essere troppo lento per i gamers. In confronto, tutti i dispositivi di test variano da 0.1 (minimo) a 240 (massimo) ms. » 67 % di tutti i dispositivi è migliore. Questo significa che i tempi di risposta rilevati sono peggiori rispetto alla media di tutti i dispositivi testati (21.5 ms). | ||
| ↔ Tempo di risposta dal 50% Grigio all'80% Grigio | ||
| 45 ms ... aumenta ↗ e diminuisce ↘ combinato | ↗ 18 ms Incremento | 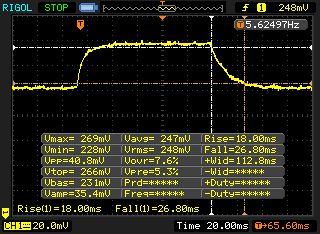 |
| ↘ 27 ms Calo | ||
| Lo schermo mostra tempi di risposta lenti nei nostri tests e sarà insoddisfacente per i gamers. In confronto, tutti i dispositivi di test variano da 0.2 (minimo) a 636 (massimo) ms. » 73 % di tutti i dispositivi è migliore. Questo significa che i tempi di risposta rilevati sono peggiori rispetto alla media di tutti i dispositivi testati (33.7 ms). | ||
Sfarfallio dello schermo / PWM (Pulse-Width Modulation)
| flickering dello schermo / PWM non rilevato | 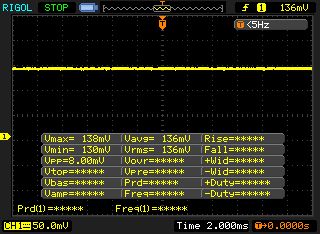 | ||
In confronto: 53 % di tutti i dispositivi testati non utilizza PWM per ridurre la luminosita' del display. Se è rilevato PWM, una media di 17903 (minimo: 5 - massimo: 3846000) Hz è stata rilevata. | |||
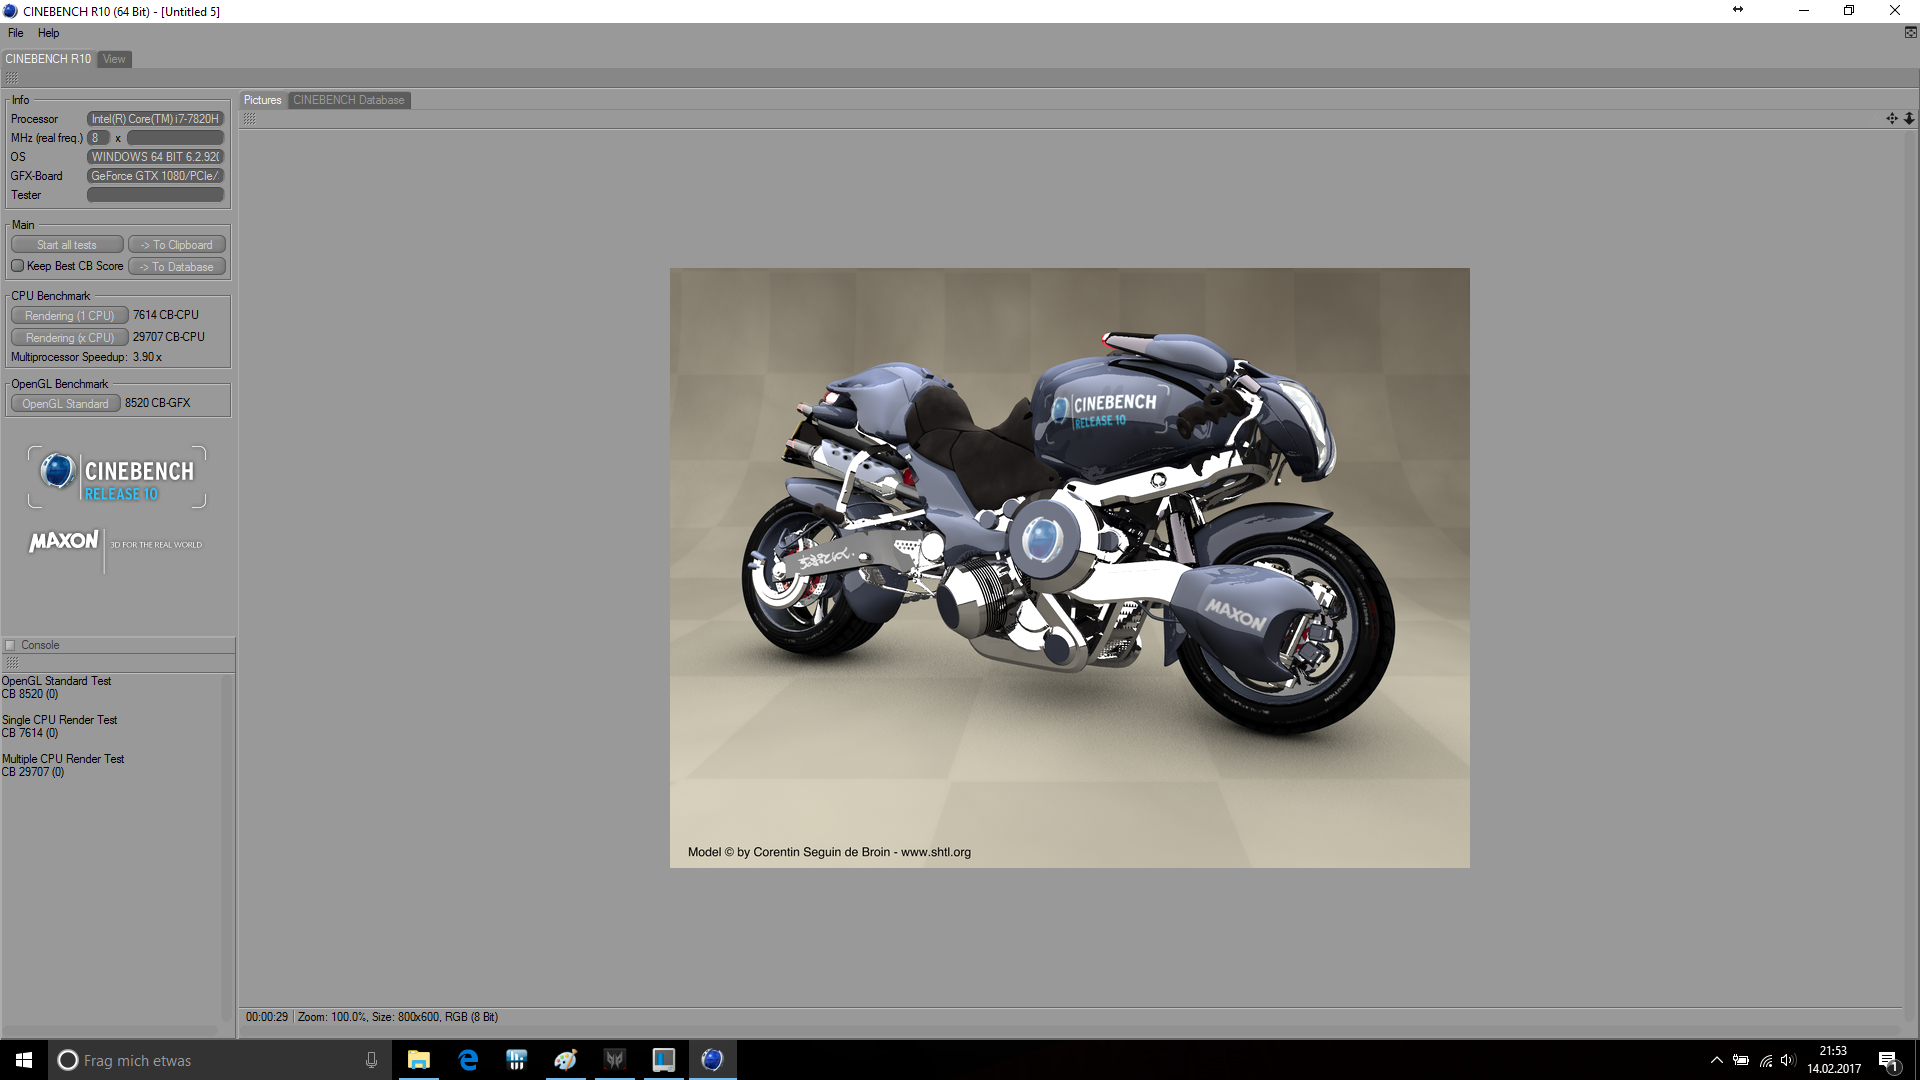
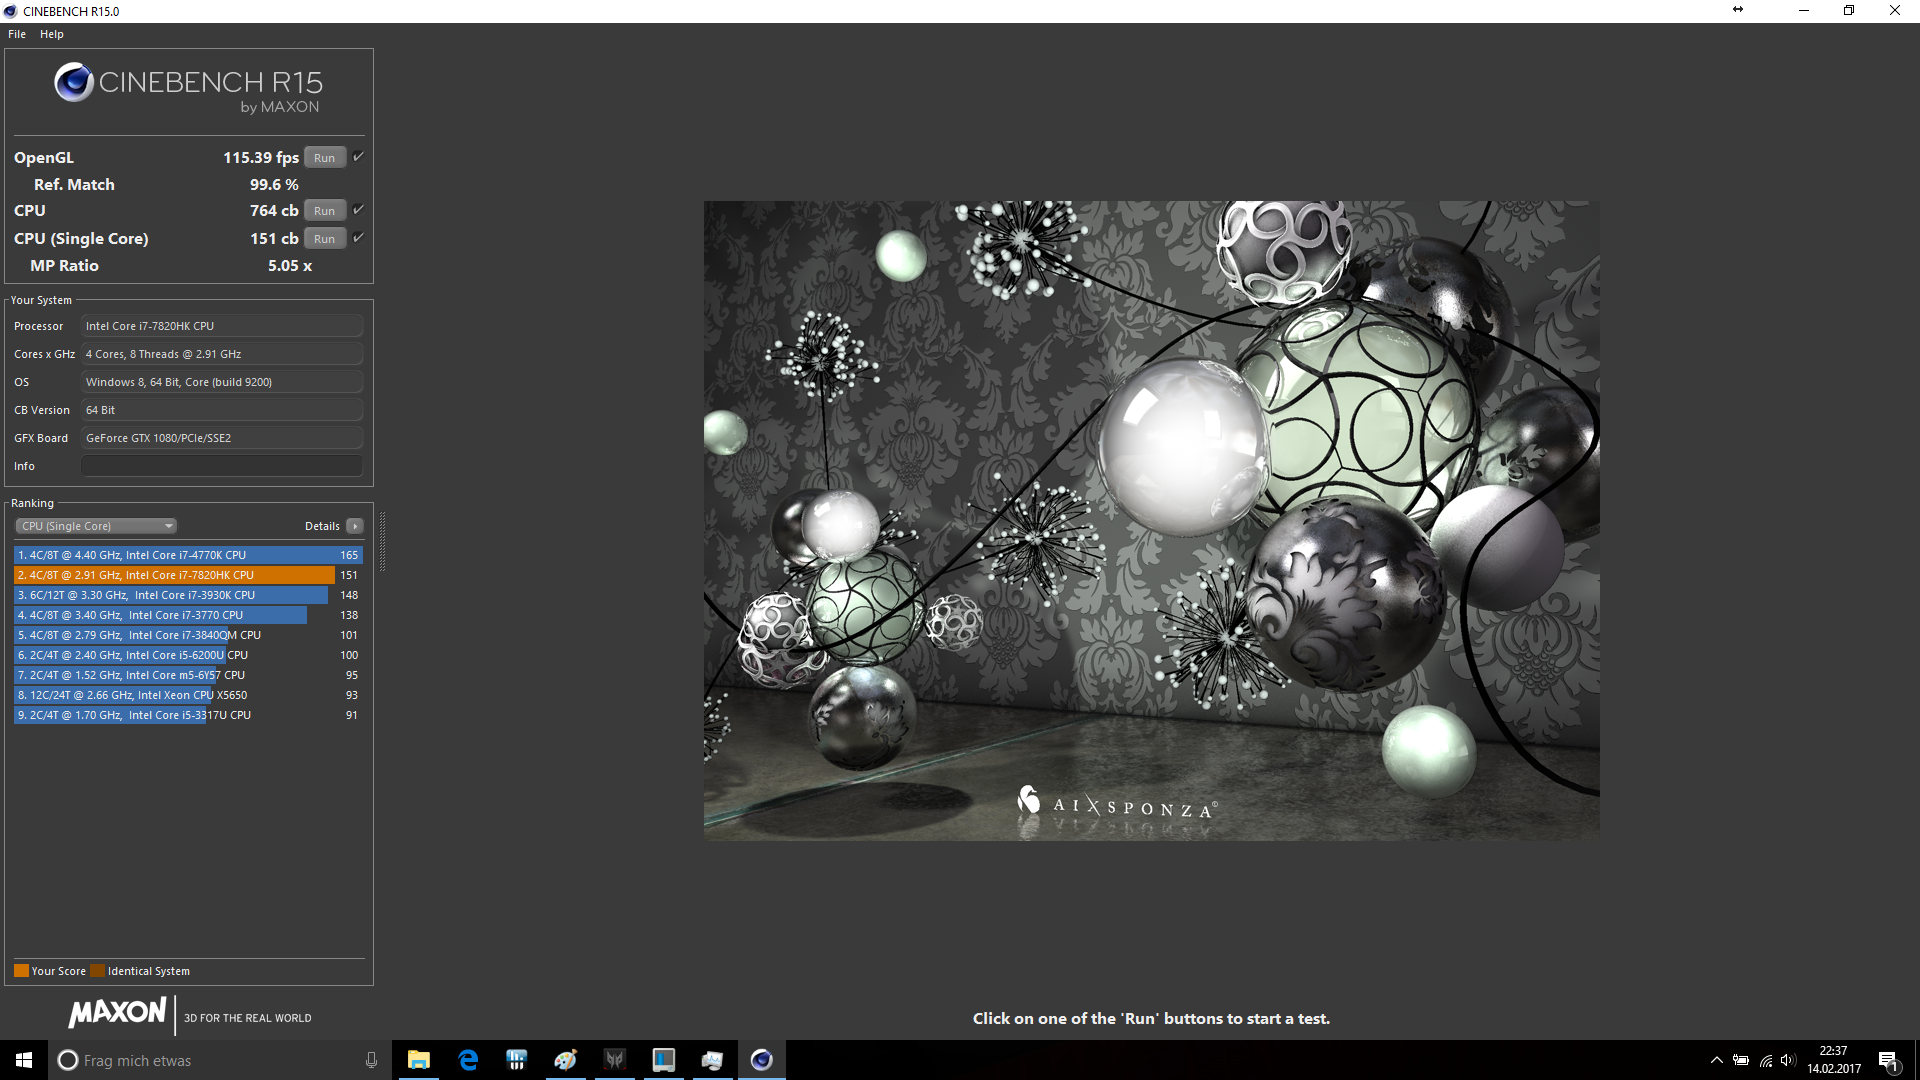
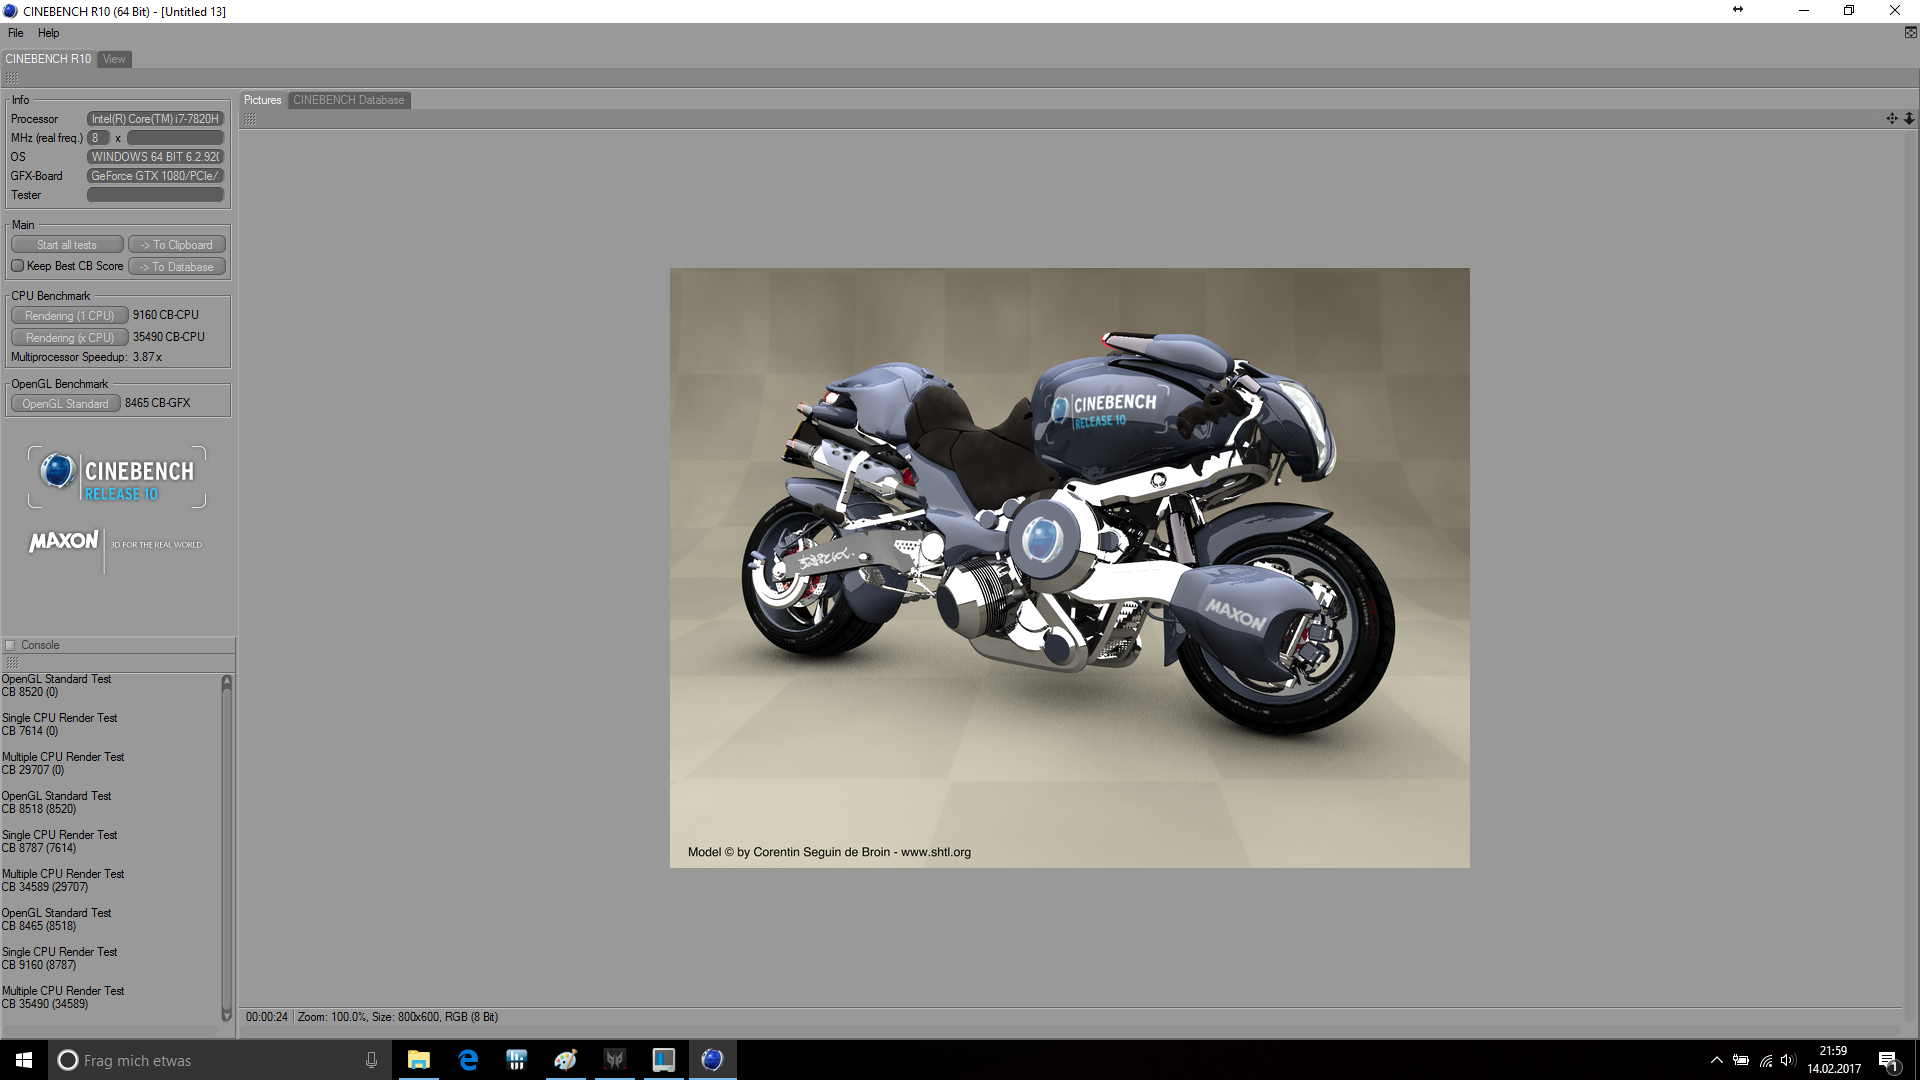
| Cinebench R10 | |
| Rendering Single 32Bit | |
| Acer Predator 17 X GX-792-76DL | |
| Asus G752VS-XB78K | |
| MSI GT72VR 7RE-433 | |
| Rendering Multiple CPUs 32Bit | |
| Acer Predator 17 X GX-792-76DL | |
| Asus G752VS-XB78K | |
| MSI GT72VR 7RE-433 | |
| JetStream 1.1 - Total Score | |
| Acer Predator 17 X GX-792-76DL | |
| MSI GT72VR 7RE-433 | |
| Asus G752VS-XB78K | |
| Octane V2 - Total Score | |
| Acer Predator 17 X GX-792-76DL | |
| MSI GT72VR 7RE-433 | |
| Asus G752VS-XB78K | |
| PCMark 8 | |
| Home Score Accelerated v2 | |
| Acer Predator 17 X GX-792-76DL | |
| Asus G701VIK-BA049T | |
| Asus G752VS-XB78K | |
| MSI GT72VR 7RE-433 | |
| Acer Predator 17 G9-793-77LG | |
| Work Score Accelerated v2 | |
| Acer Predator 17 X GX-792-76DL | |
| Asus G701VIK-BA049T | |
| Asus G752VS-XB78K | |
| MSI GT72VR 7RE-433 | |
| PCMark 7 - Score | |
| Asus G701VIK-BA049T | |
| Acer Predator 17 X GX-792-76DL | |
| MSI GT73VR 7RF-296 | |
| Asus G752VS-XB78K | |
| MSI GT72VR 7RE-433 | |
| Aorus X7 v6 | |
| PCMark Vantage Result | 31085 punti | |
| PCMark 7 Score | 7667 punti | |
| PCMark 8 Home Score Accelerated v2 | 5975 punti | |
| PCMark 8 Creative Score Accelerated v2 | 9309 punti | |
| PCMark 8 Work Score Accelerated v2 | 6123 punti | |
Aiuto | ||
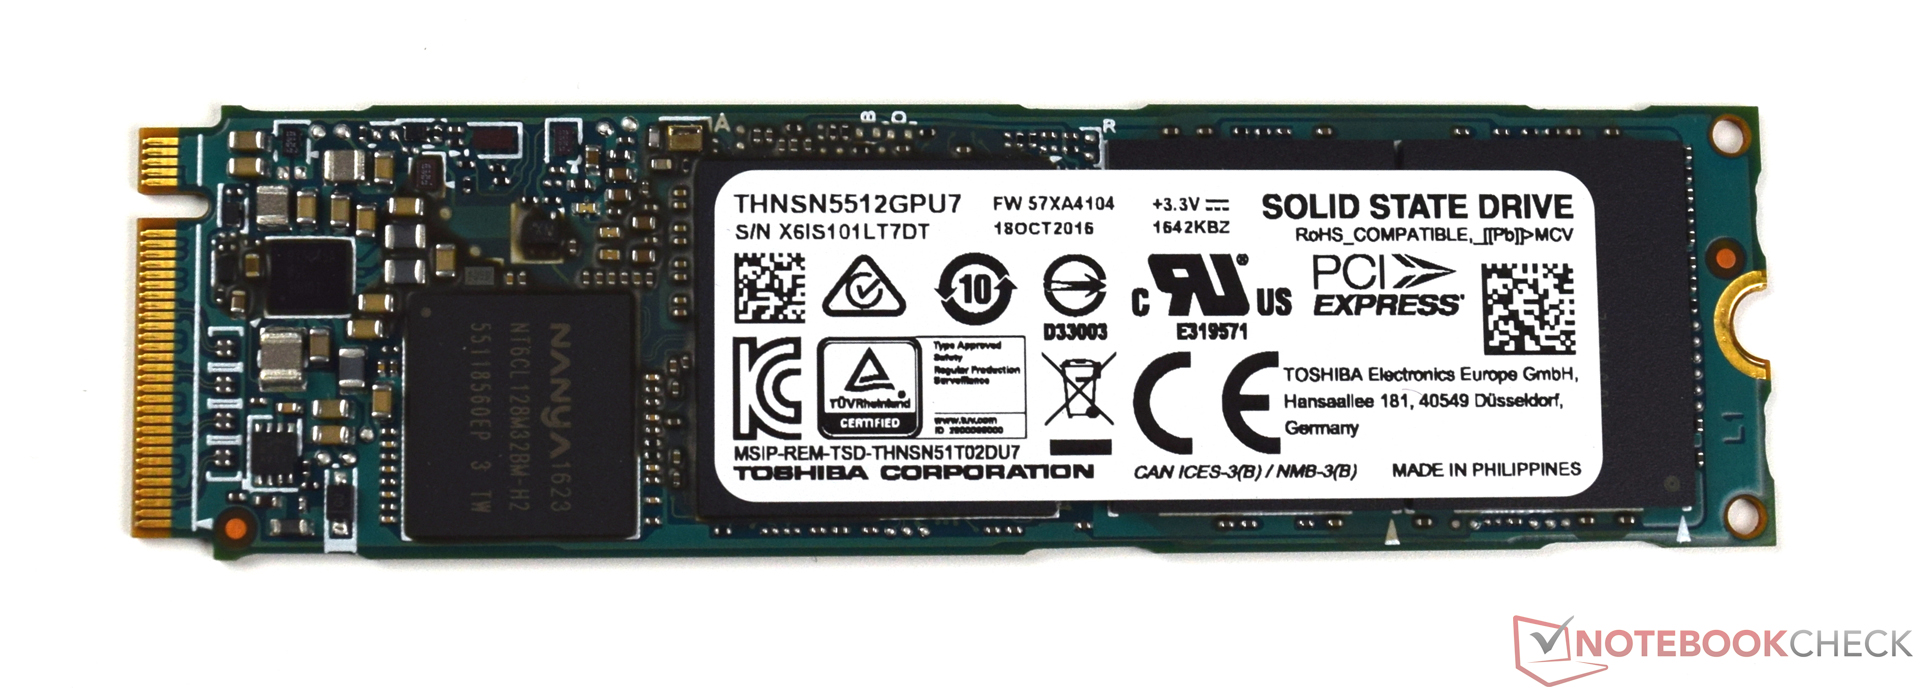

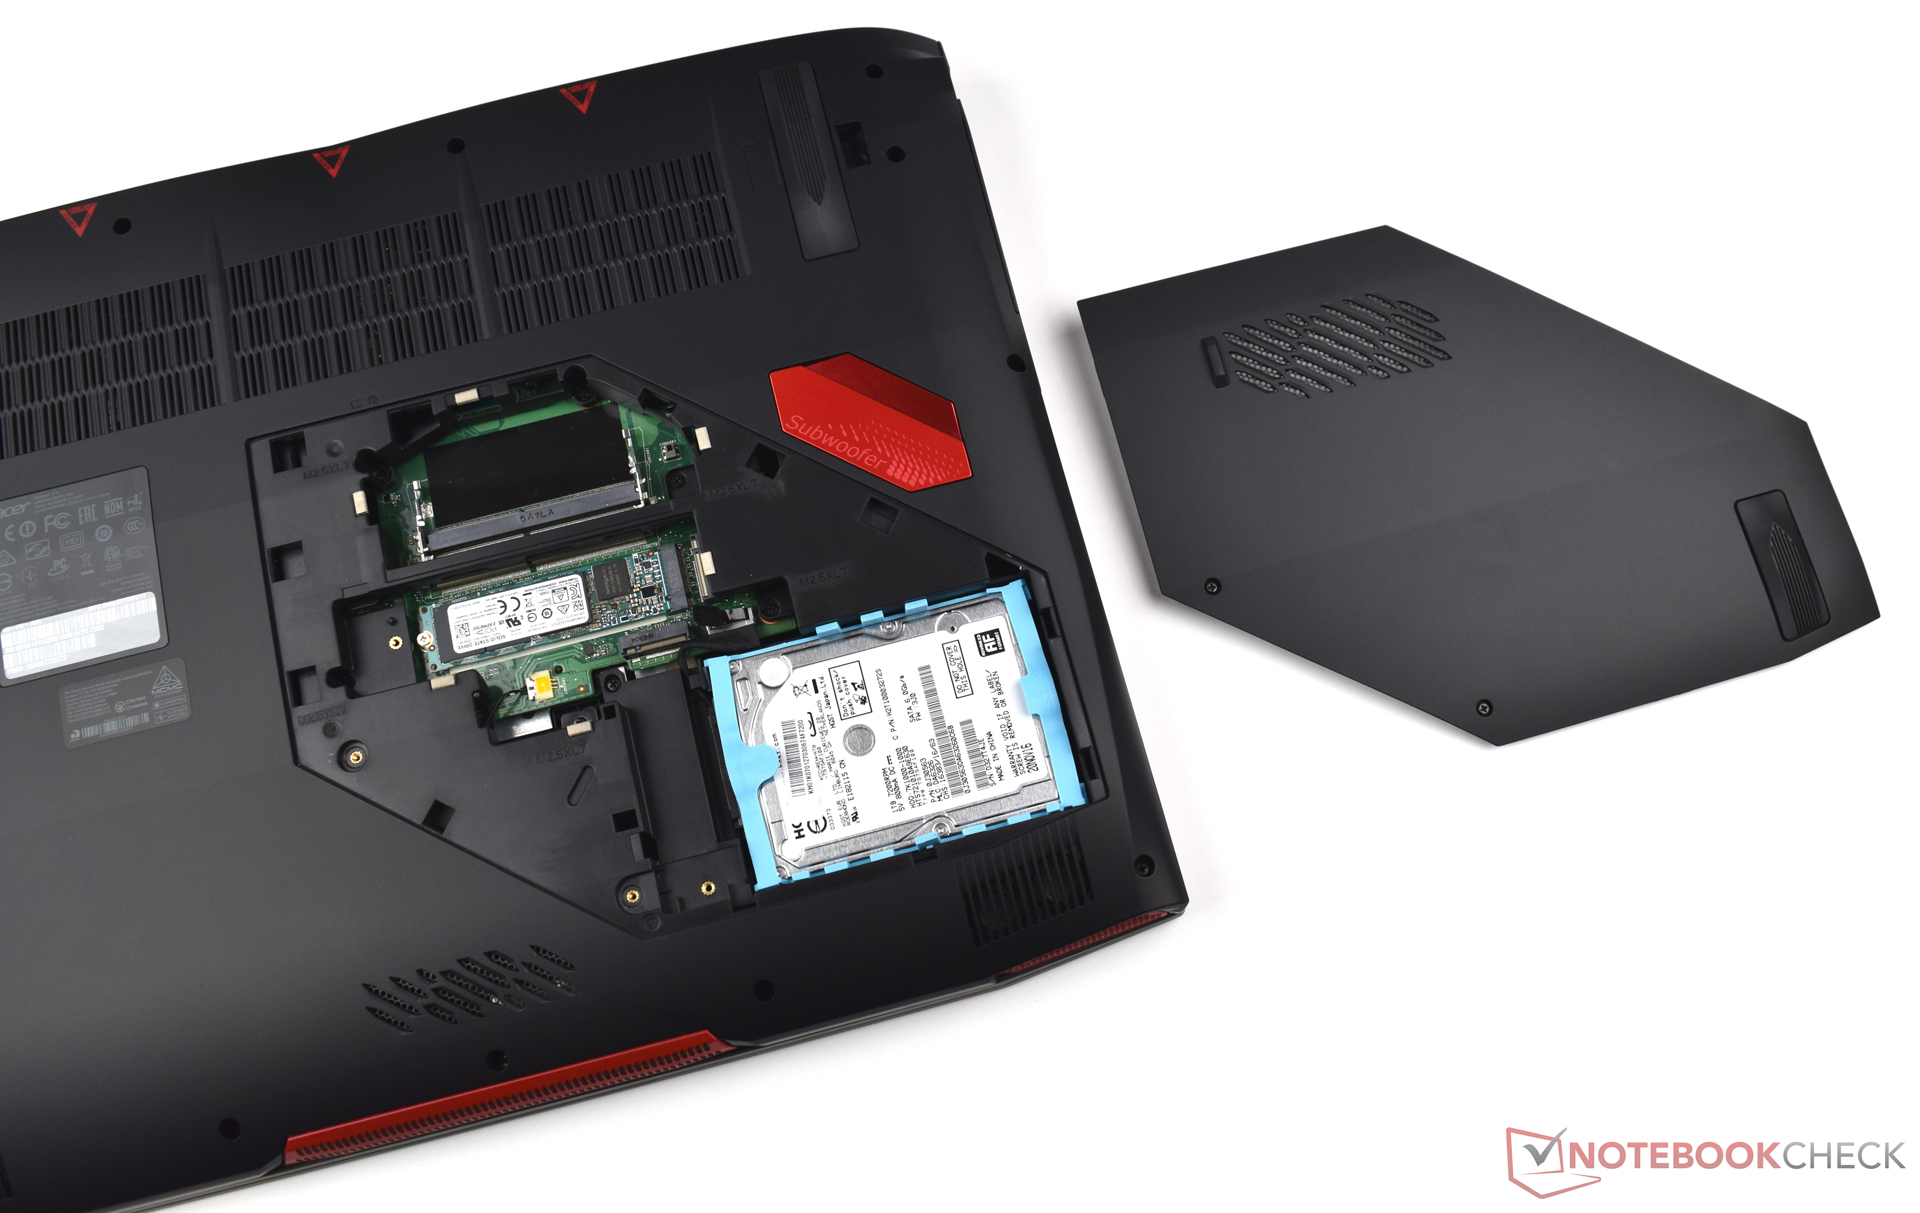
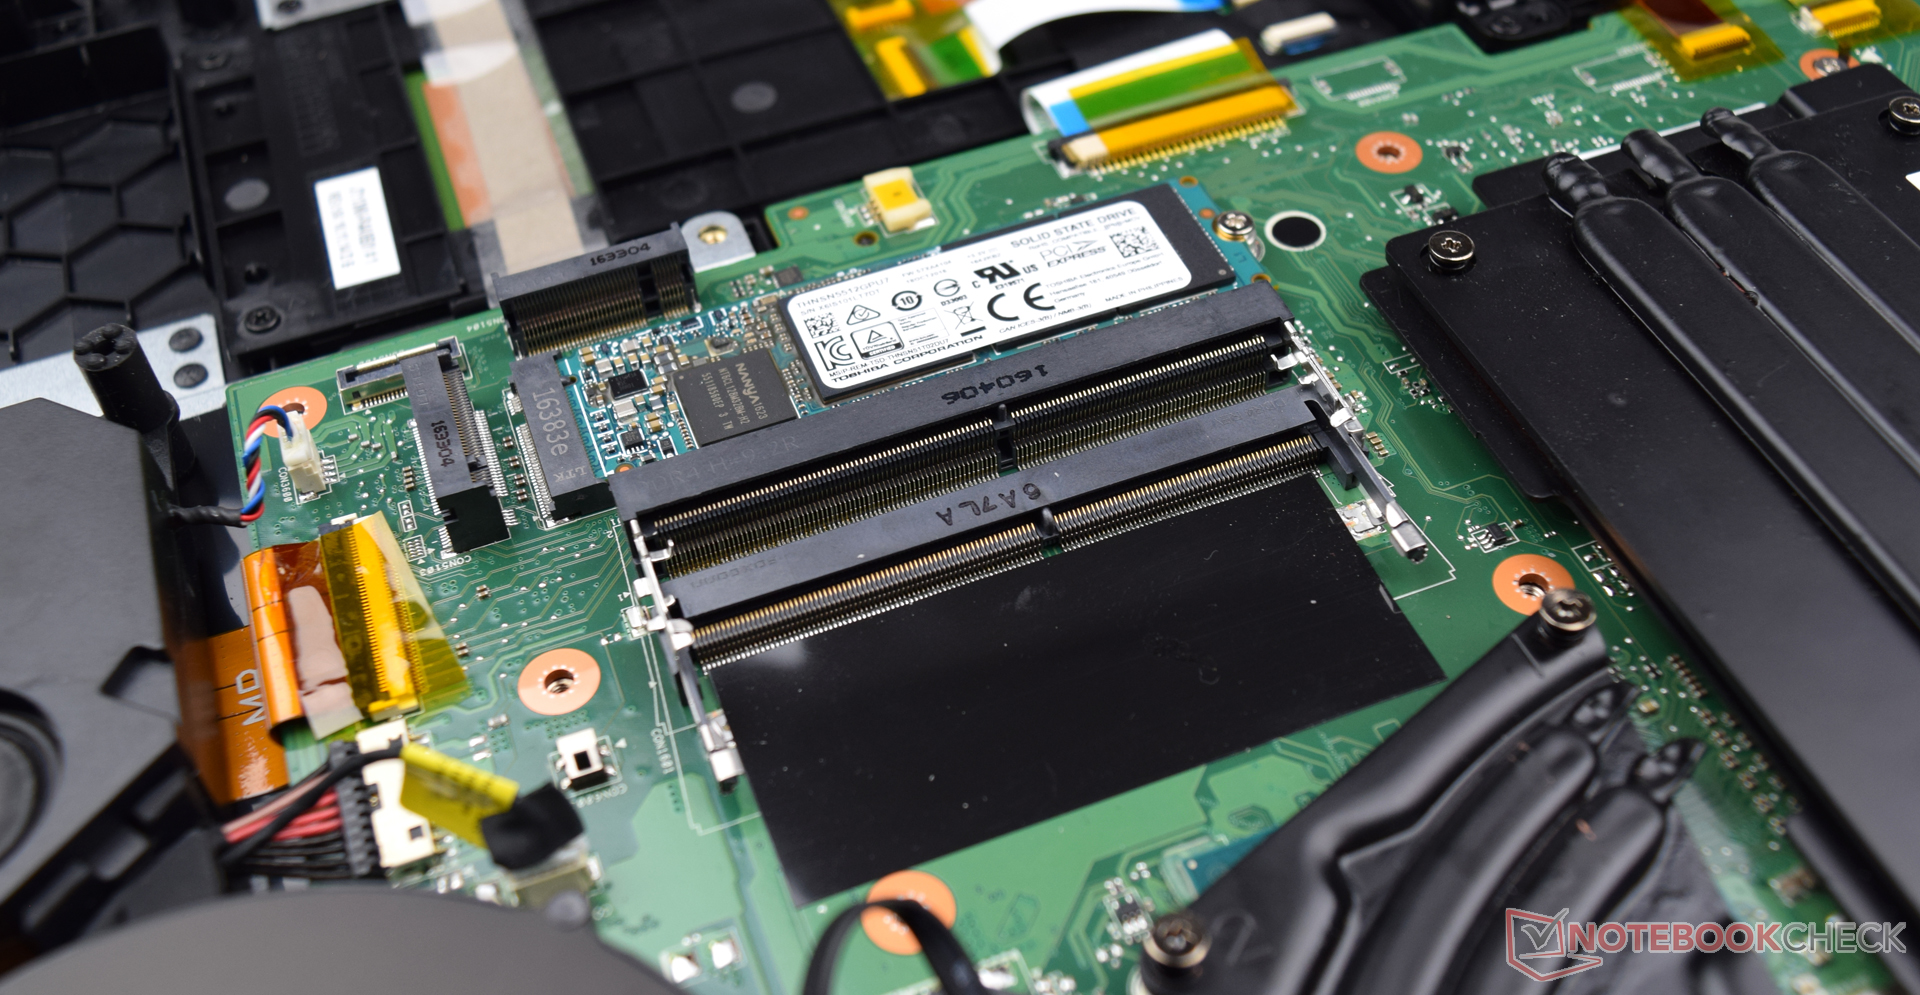
| Acer Predator 17 X GX-792-76DL Toshiba NVMe THNSN5512GPU7 | MSI GT73VR 7RF-296 2x Samsung SM951 MZVPV256HDGL (RAID 0) | Asus G701VIK-BA049T 2x Samsung SM961 MZVPW256HEGL NVMe (RAID 0) | Asus G752VS-XB78K Toshiba NVMe THNSN5512GPU7 | MSI GT72VR 7RE-433 Kingston RBU-SNS8152S3256GG5 | Aorus X7 v6 Toshiba NVMe THNSN5512GPU7 | Acer Predator 17 G9-793-77LG Toshiba NVMe THNSN5256GPU7 | |
|---|---|---|---|---|---|---|---|
| CrystalDiskMark 3.0 | 49% | 55% | 9% | -52% | -1% | ||
| Read Seq | 1494 | 3219 115% | 3487 133% | 1718 15% | 521 -65% | 1499 0% | |
| Write Seq | 1371 | 2572 88% | 2690 96% | 1305 -5% | 311.8 -77% | 1411 3% | |
| Read 512 | 898 | 1776 98% | 1499 67% | 1250 39% | 403.1 -55% | 966 8% | |
| Write 512 | 1273 | 2445 92% | 2493 96% | 1438 13% | 332.3 -74% | 1103 -13% | |
| Read 4k | 43.82 | 51.1 17% | 53.7 23% | 44.42 1% | 33.35 -24% | 44.33 1% | |
| Write 4k | 161.6 | 141.3 -13% | 133.2 -18% | 154.4 -4% | 111.1 -31% | 155.5 -4% | |
| Read 4k QD32 | 669 | 658 -2% | 795 19% | 744 11% | 331.1 -51% | 696 4% | |
| Write 4k QD32 | 552 | 554 0% | 699 27% | 578 5% | 318.3 -42% | 531 -4% |

| 3DMark - 1920x1080 Fire Strike Graphics | |
| Asus G701VIK-BA049T | |
| Acer Predator 17 X GX-792-76DL | |
| MSI GT73VR 7RF-296 | |
| MSI GT72VR 7RE-433 | |
| Aorus X7 v6 | |
| Asus G752VS-XB78K | |
| Acer Predator 17 G9-793-77LG | |
| 3DMark 11 - 1280x720 Performance GPU | |
| Asus G701VIK-BA049T | |
| MSI GT73VR 7RF-296 | |
| Acer Predator 17 X GX-792-76DL | |
| Aorus X7 v6 | |
| MSI GT72VR 7RE-433 | |
| Asus G752VS-XB78K | |
| Acer Predator 17 G9-793-77LG | |
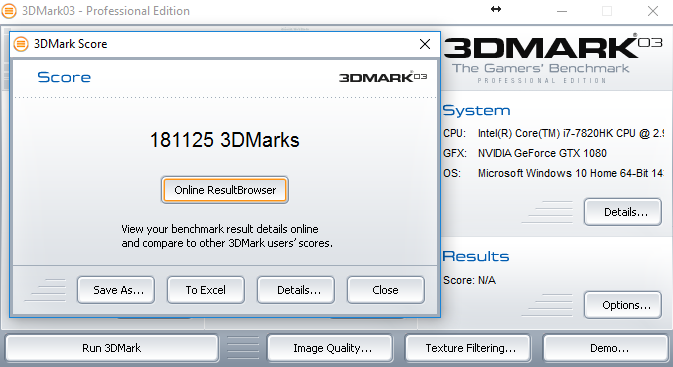
| 3DMark 03 Standard | 181125 punti | |
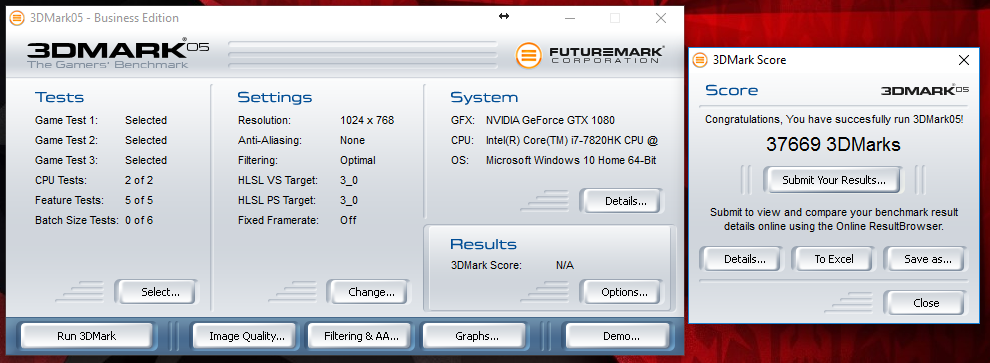
| 3DMark 05 Standard | 37669 punti | |
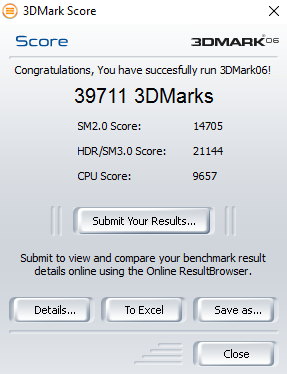
| 3DMark 06 Standard Score | 39711 punti | |
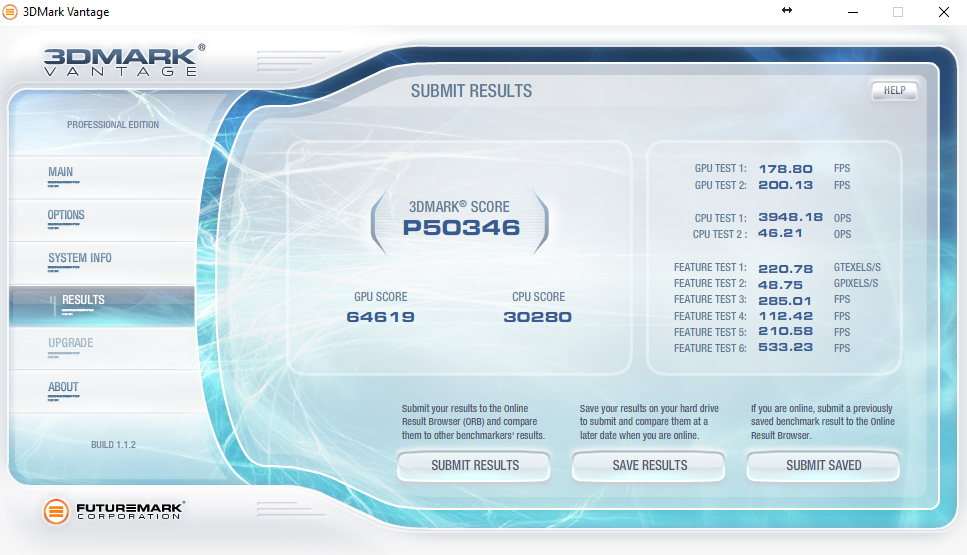
| 3DMark Vantage P Result | 50346 punti | |
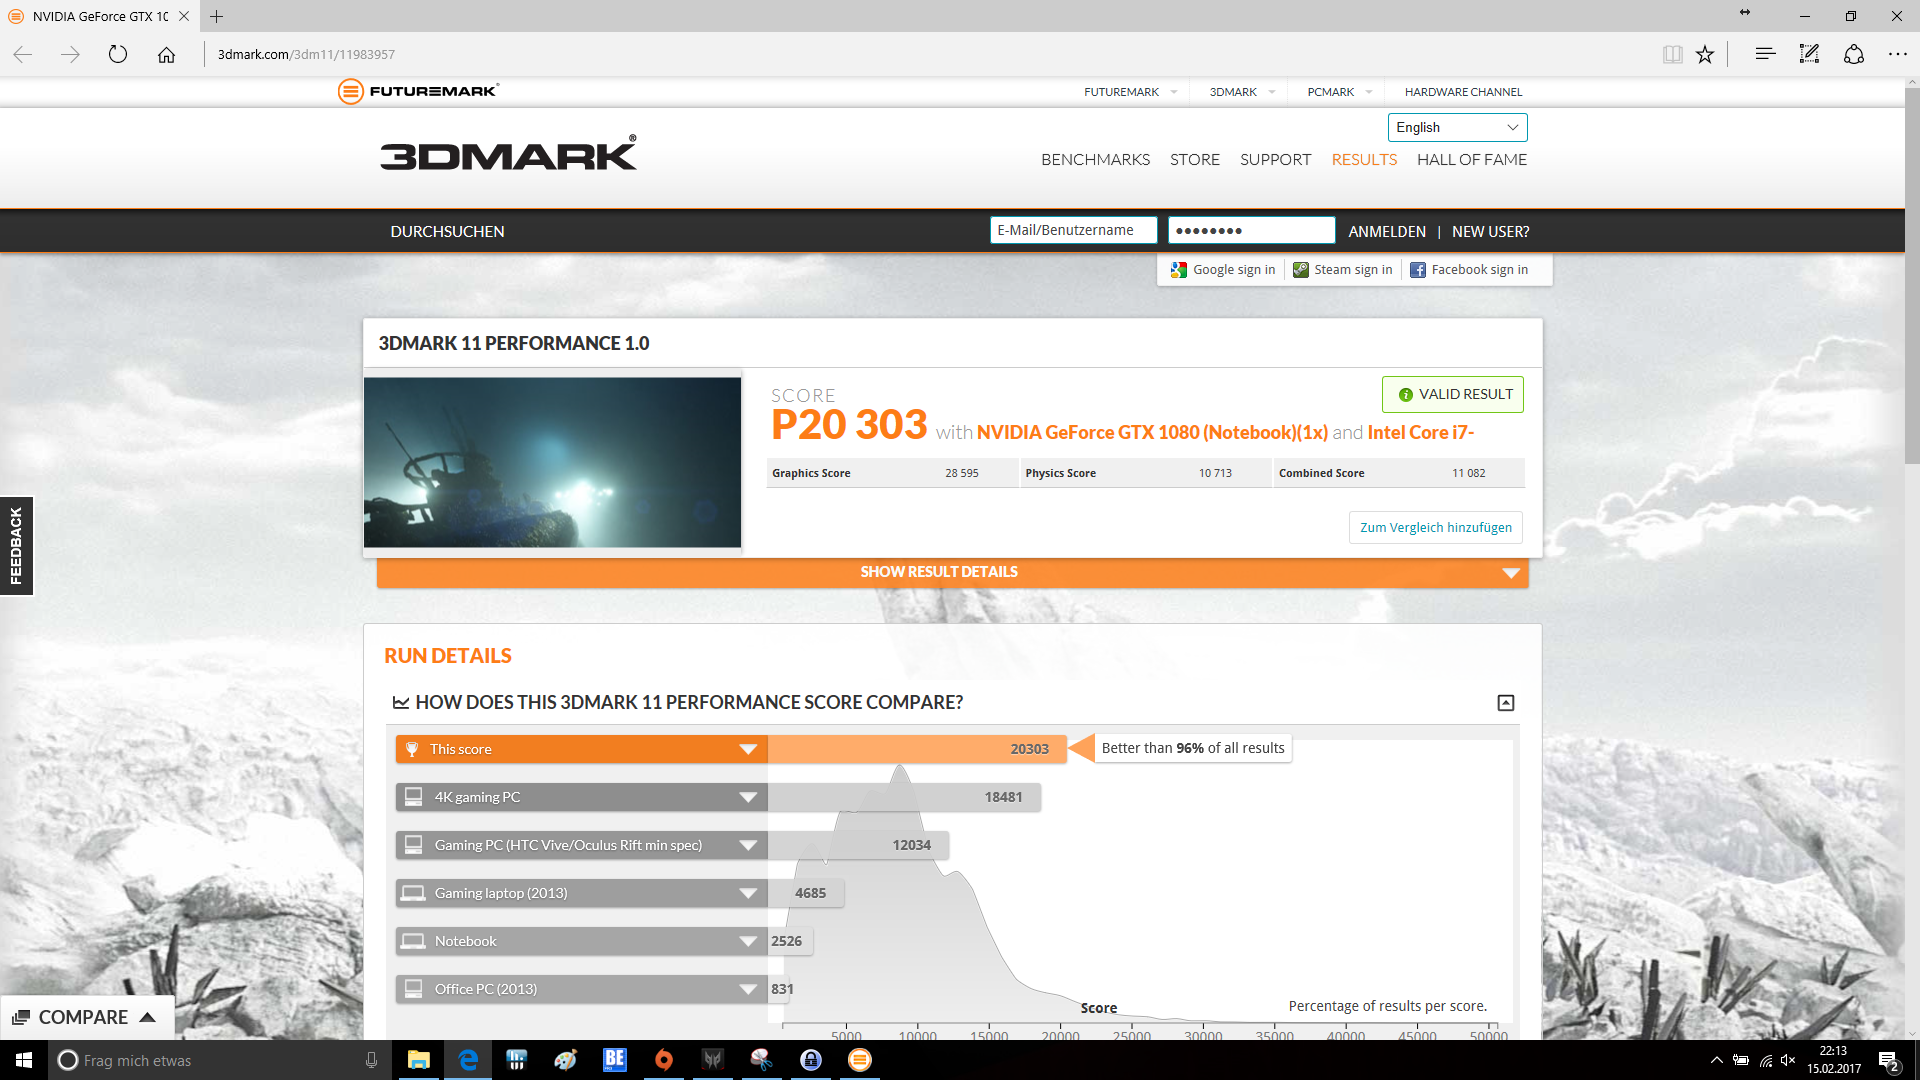
| 3DMark 11 Performance | 20303 punti | |
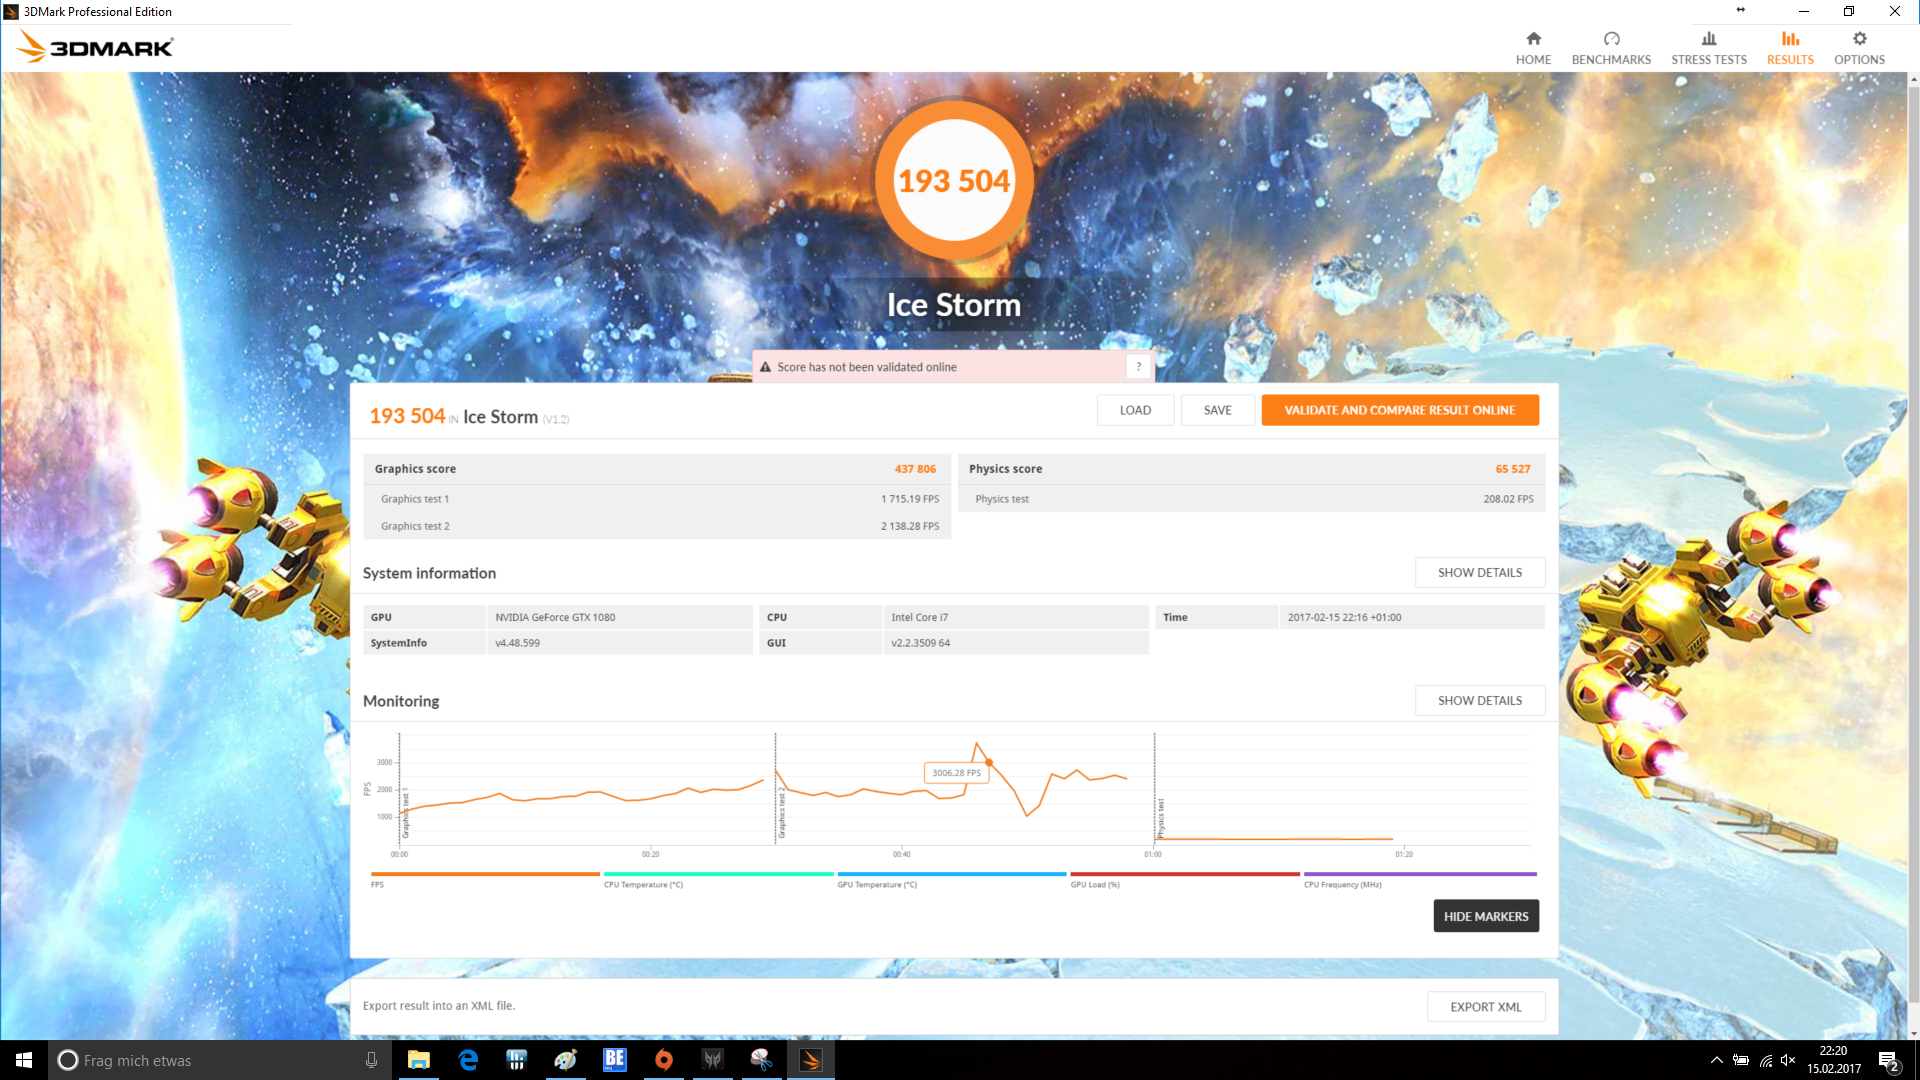
| 3DMark Ice Storm Standard Score | 192504 punti | |
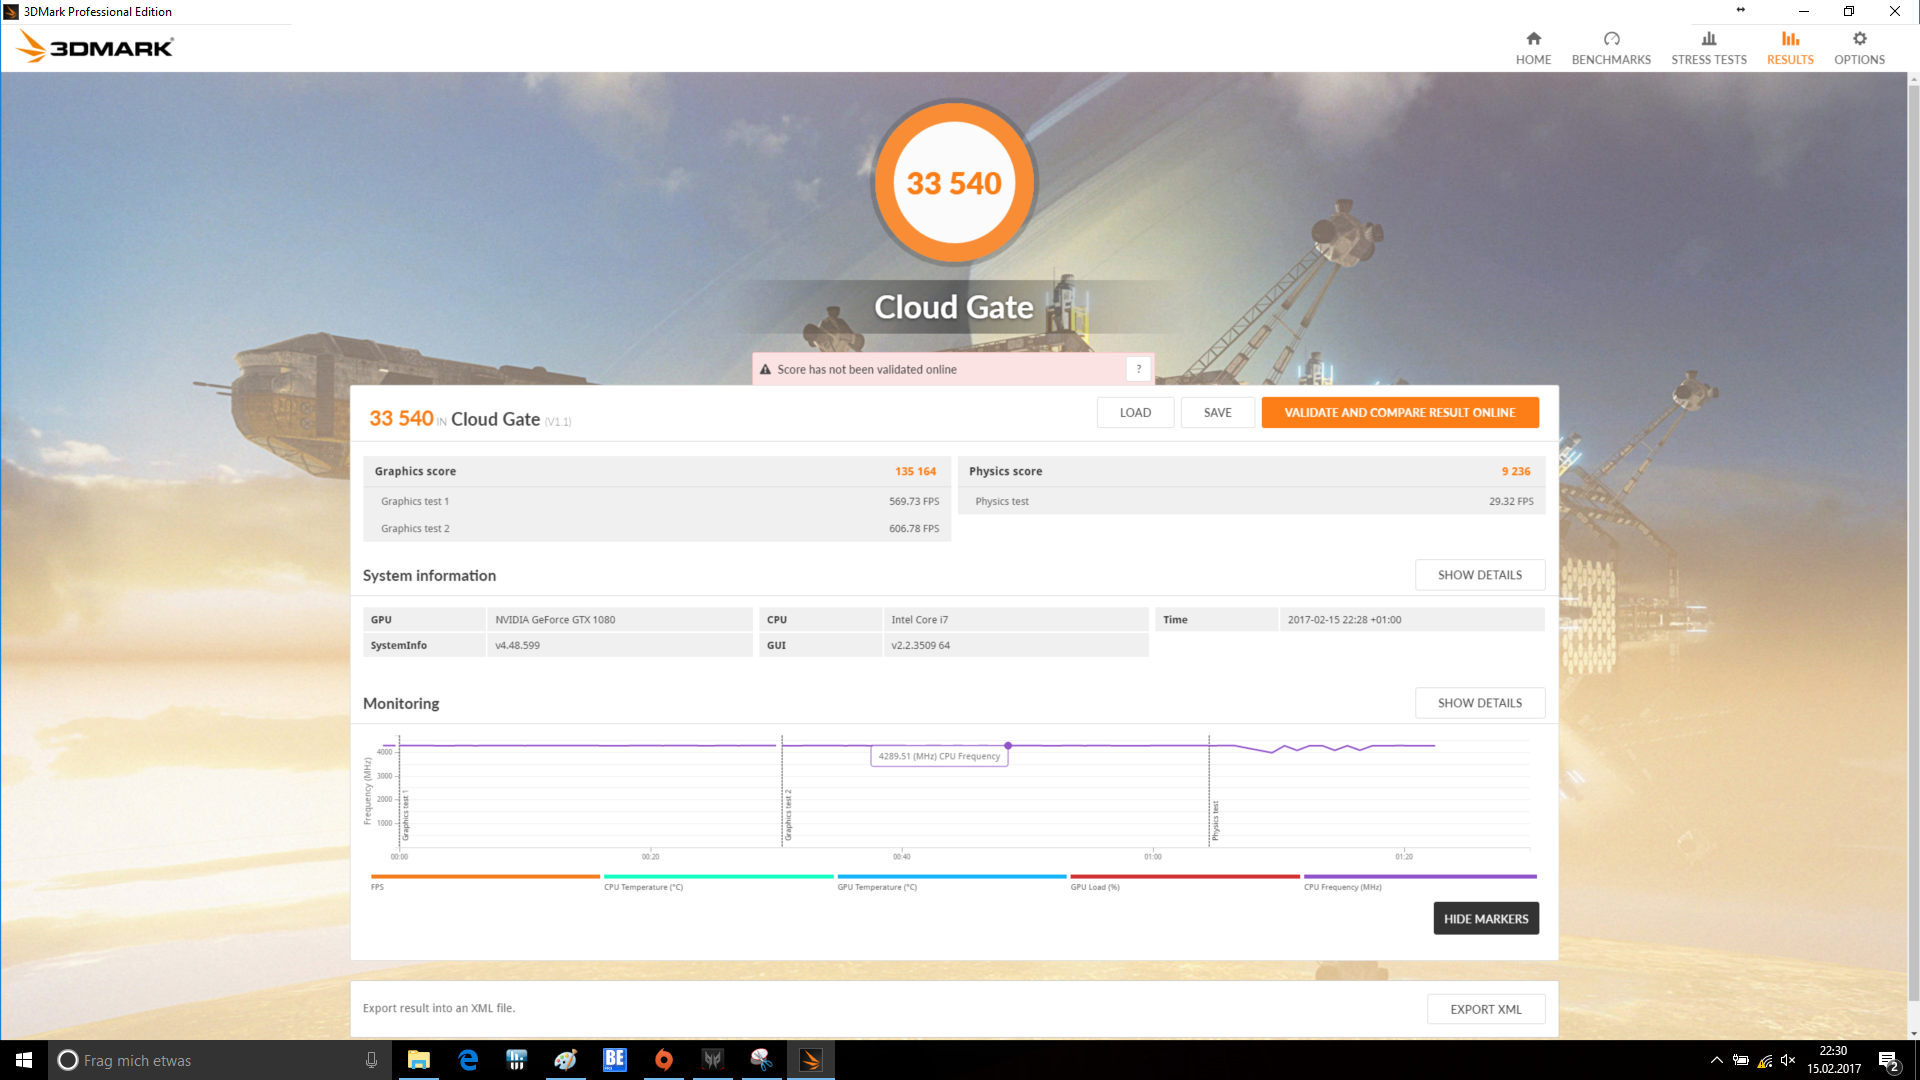
| 3DMark Cloud Gate Standard Score | 33540 punti | |
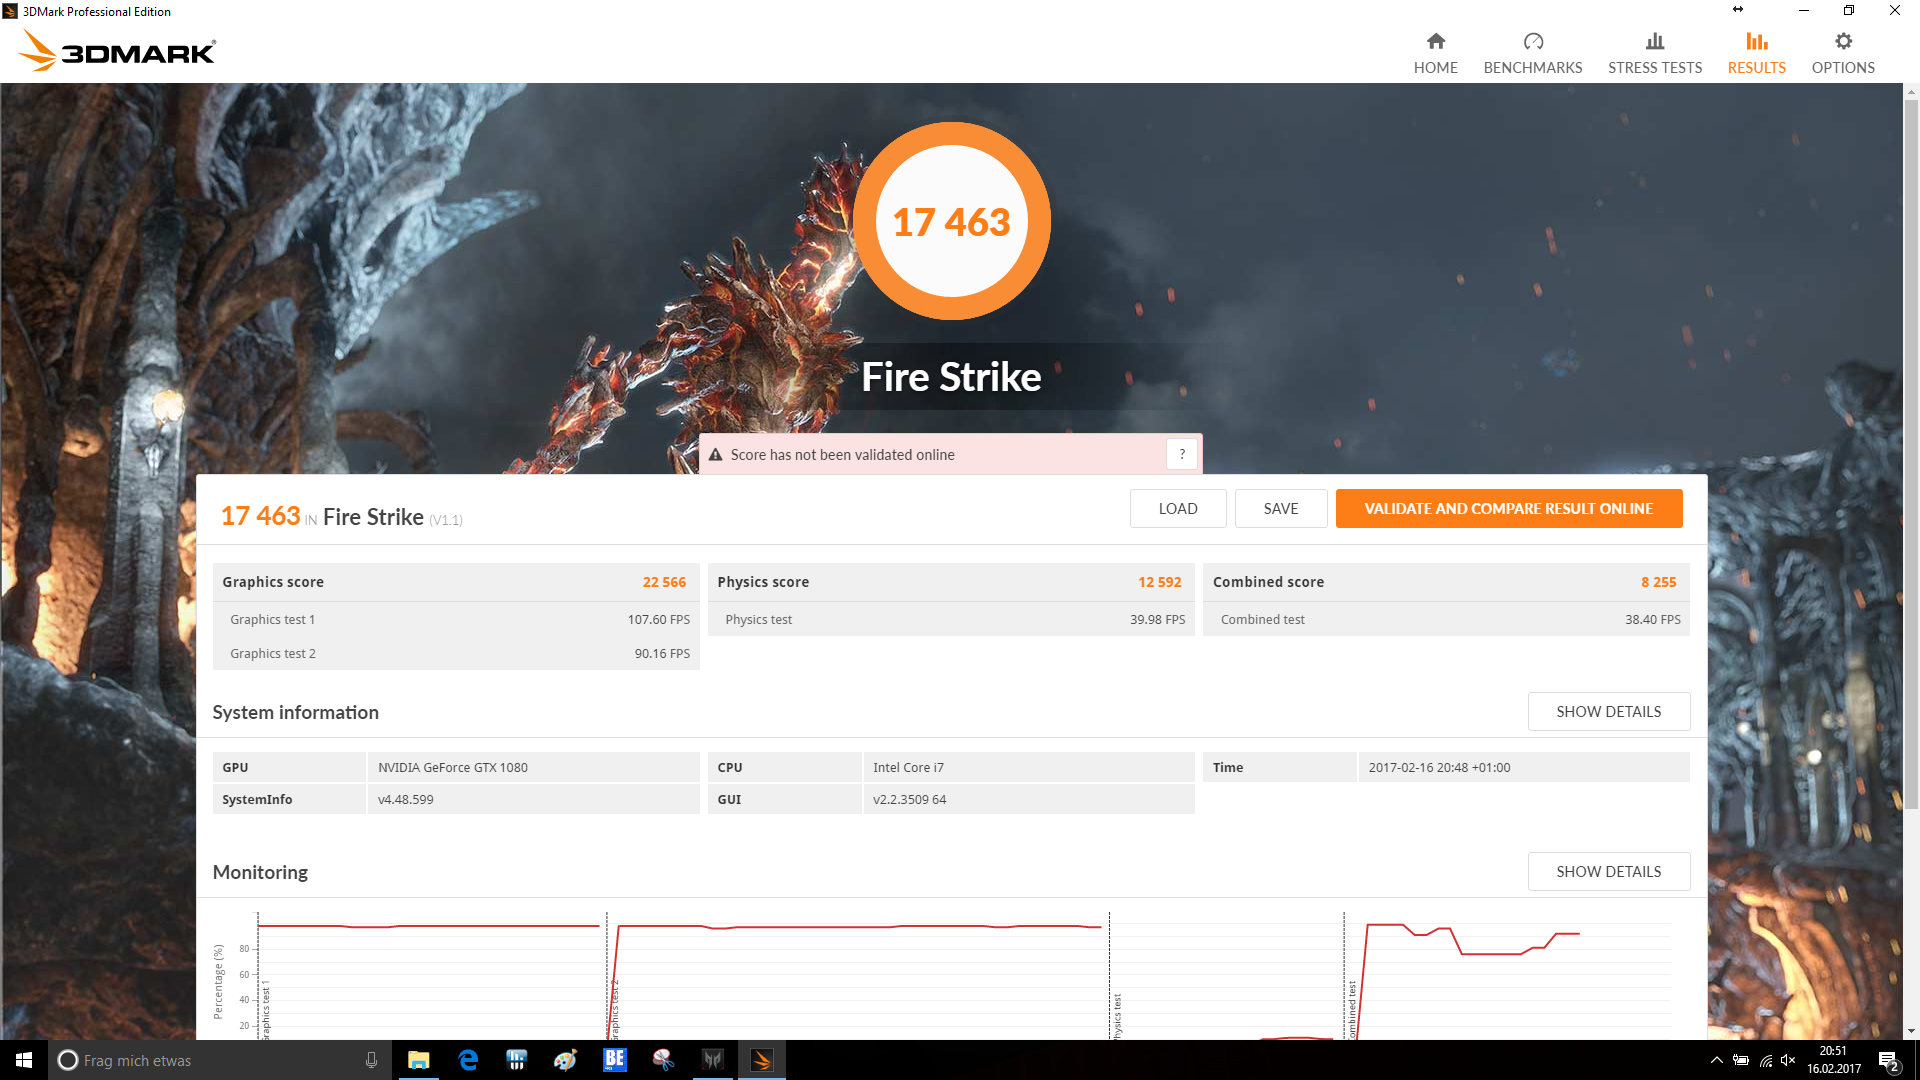
| 3DMark Fire Strike Score | 17463 punti | |
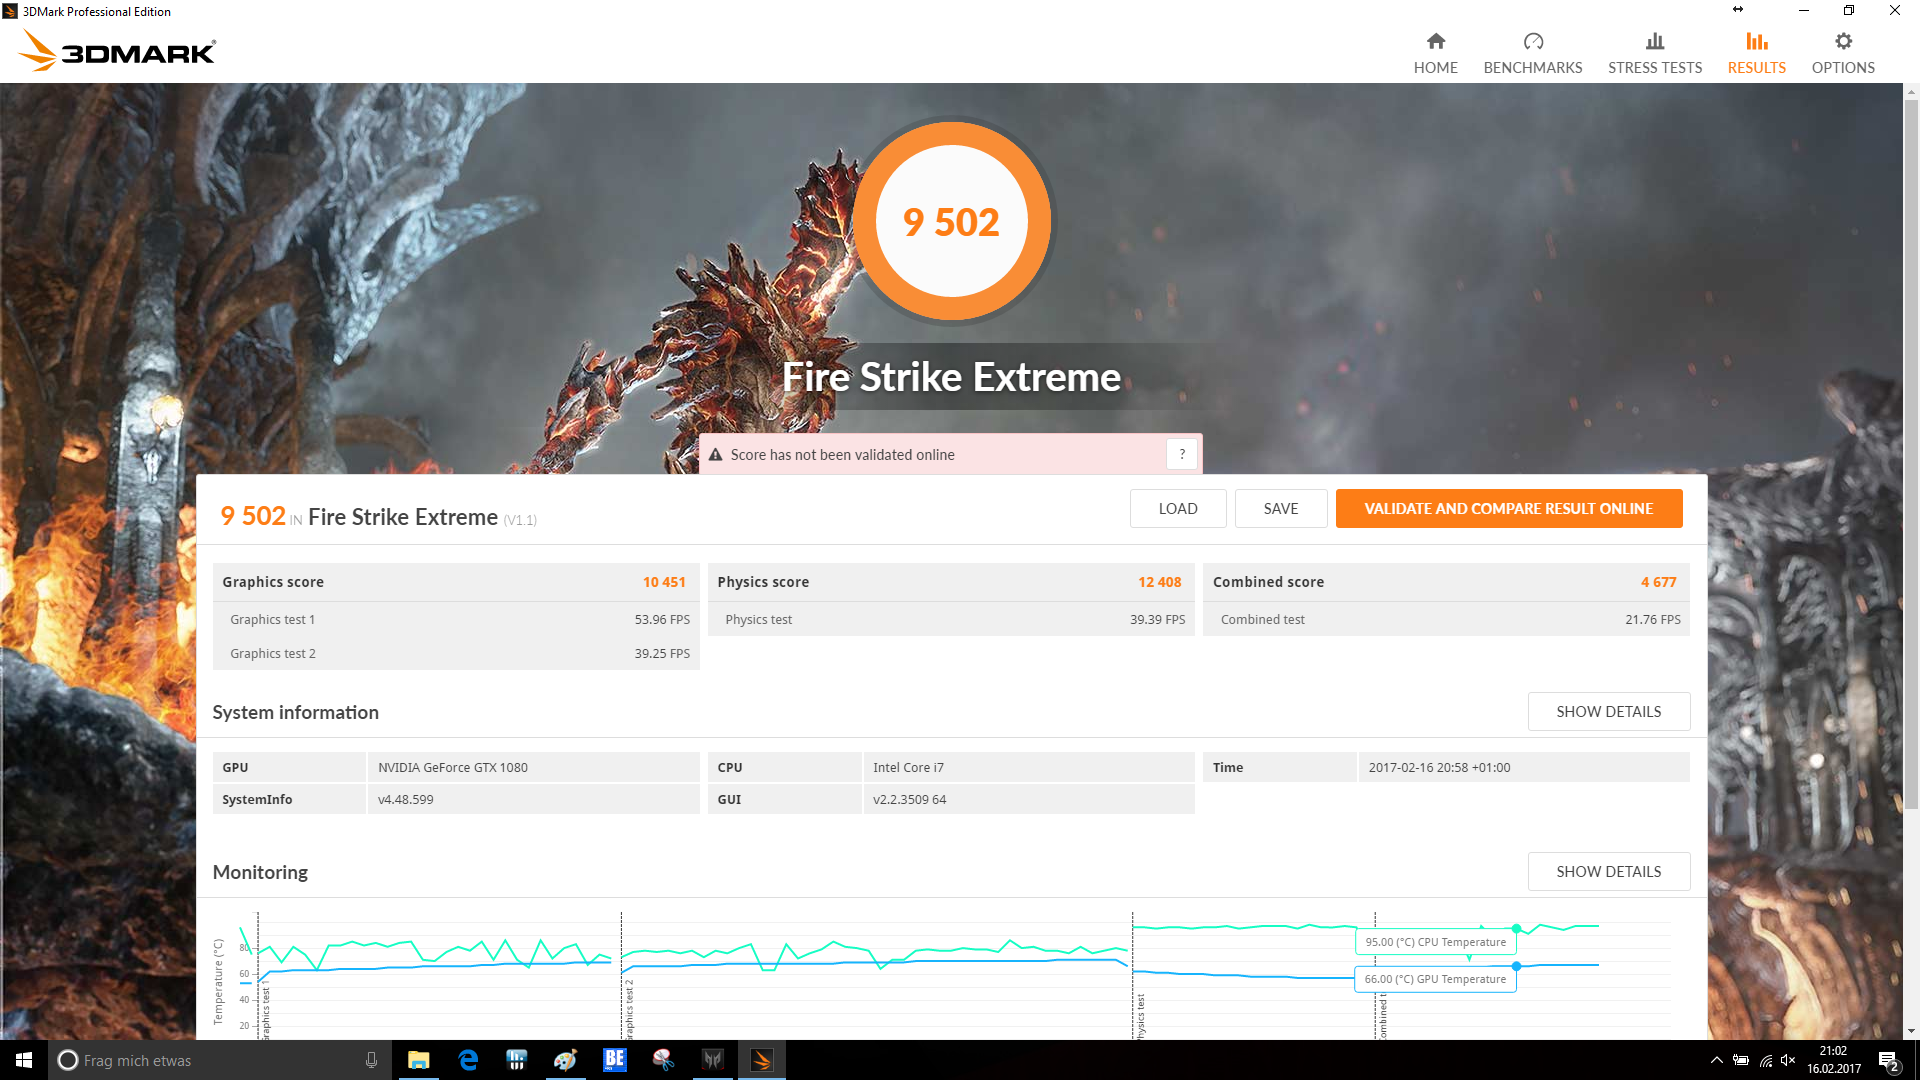
| 3DMark Fire Strike Extreme Score | 9502 punti | |
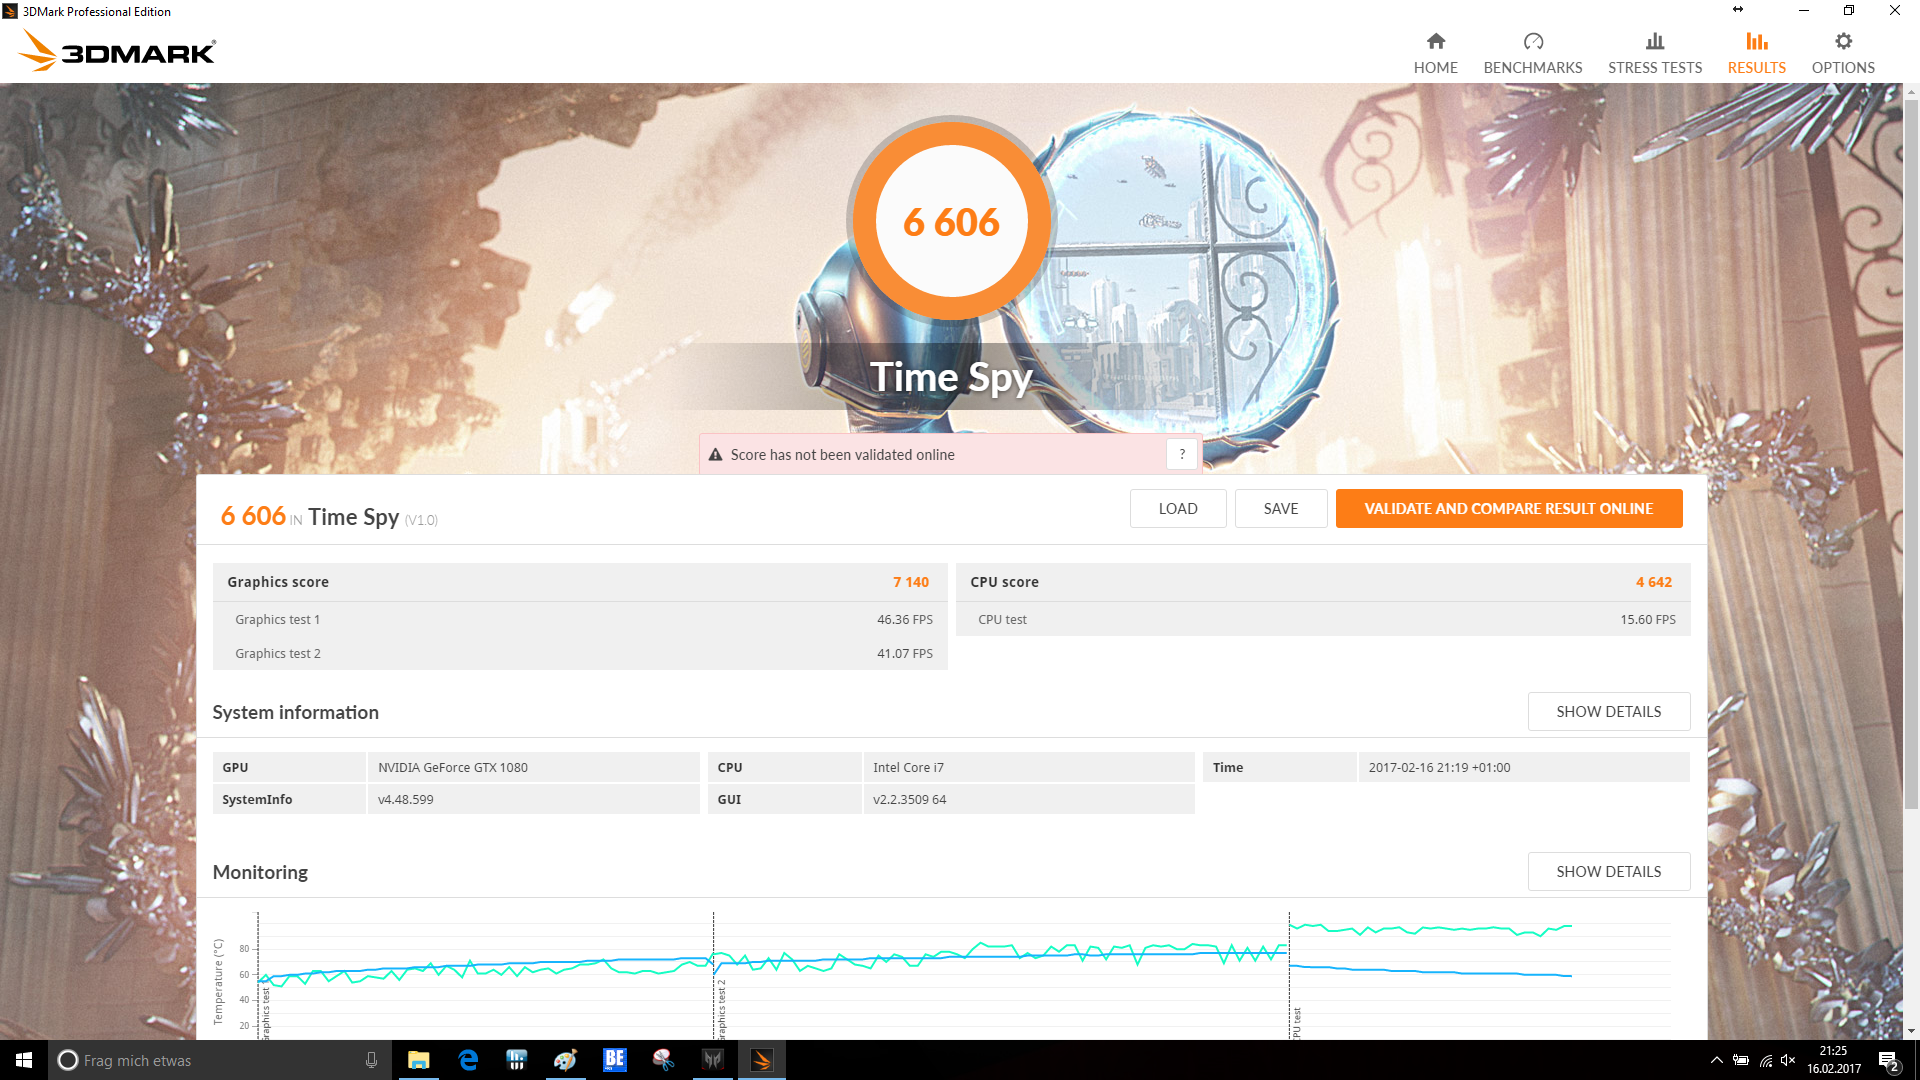
| 3DMark Time Spy Score | 6606 punti | |
Aiuto | ||
| basso | medio | alto | ultra | 4K | |
| BioShock Infinite (2013) | 324.3 | 284.5 | 273.7 | 176.8 | |
| GTA V (2015) | 170.8 | 162.5 | 130.3 | 106.8 | 75.7 |
| The Witcher 3 (2015) | 270.8 | 197.5 | 125.8 | 68.5 | 46.8 |
| Rise of the Tomb Raider (2016) | 260.9 | 218.3 | 153.8 | 126.1 | 61.2 |
| Far Cry Primal (2016) | 157 | 138 | 125 | 107 | 49 |
| The Division (2016) | 258.8 | 201.6 | 122.4 | 97.2 | 48.4 |
| Doom (2016) | 179.9 | 170.2 | 149.1 | 147.8 | 70.3 |
| Deus Ex Mankind Divided (2016) | 145.9 | 136.9 | 98.9 | 54.9 | 34.4 |
| Resident Evil 7 (2017) | 462.9 | 353.4 | 269.3 | 234.1 | 78.5 |
| For Honor (2017) | 265.6 | 190.1 | 177.5 | 134.9 | 59.4 |
Rumorosità
| Idle |
| 33 / 35 / 37 dB(A) |
| HDD |
| 33 dB(A) |
| Sotto carico |
| 40 / 50 dB(A) |
 | ||
30 dB silenzioso 40 dB(A) udibile 50 dB(A) rumoroso |
||
min: | ||
| Acer Predator 17 X GX-792-76DL i7-7820HK, GeForce GTX 1080 Mobile | MSI GT73VR 7RF-296 i7-7820HK, GeForce GTX 1080 Mobile | Asus G701VIK-BA049T i7-7820HK, GeForce GTX 1080 Mobile | Asus G752VS-XB78K 6820HK, GeForce GTX 1070 Mobile | MSI GT72VR 7RE-433 i7-7700HQ, GeForce GTX 1070 Mobile | Aorus X7 v6 6820HK, GeForce GTX 1070 Mobile | Acer Predator 17 G9-793-77LG 6700HQ, GeForce GTX 1070 Mobile | |
|---|---|---|---|---|---|---|---|
| Noise | -2% | -1% | 5% | 2% | -4% | -3% | |
| off /ambiente * | 30 | 30 -0% | 30 -0% | 30 -0% | 31 -3% | 30 -0% | 31 -3% |
| Idle Minimum * | 33 | 34 -3% | 30 9% | 31 6% | 34 -3% | 33 -0% | 33 -0% |
| Idle Average * | 35 | 35 -0% | 31 11% | 32 9% | 35 -0% | 35 -0% | 34 3% |
| Idle Maximum * | 37 | 37 -0% | 36 3% | 33 11% | 37 -0% | 40 -8% | 40 -8% |
| Load Average * | 40 | 39 2% | 47 -18% | 40 -0% | 37 7% | 43 -8% | 44 -10% |
| Load Maximum * | 50 | 56 -12% | 56 -12% | 47 6% | 44 12% | 54 -8% | 50 -0% |
* ... Meglio usare valori piccoli

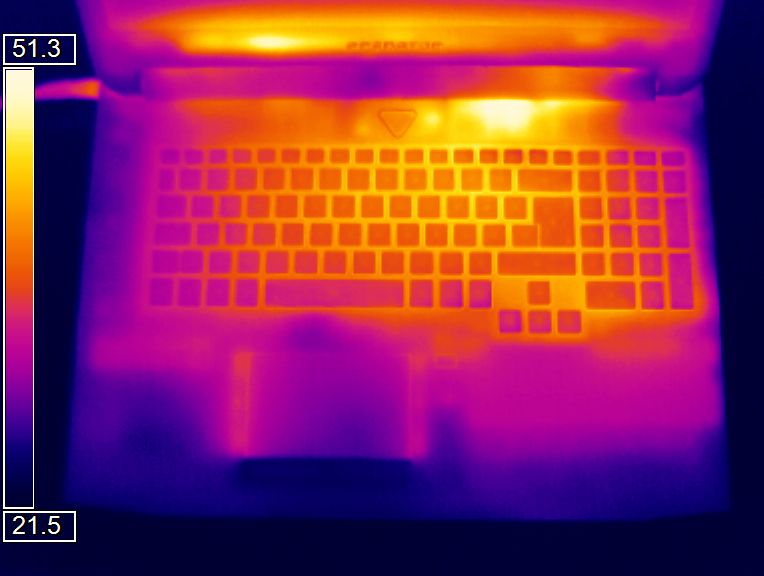
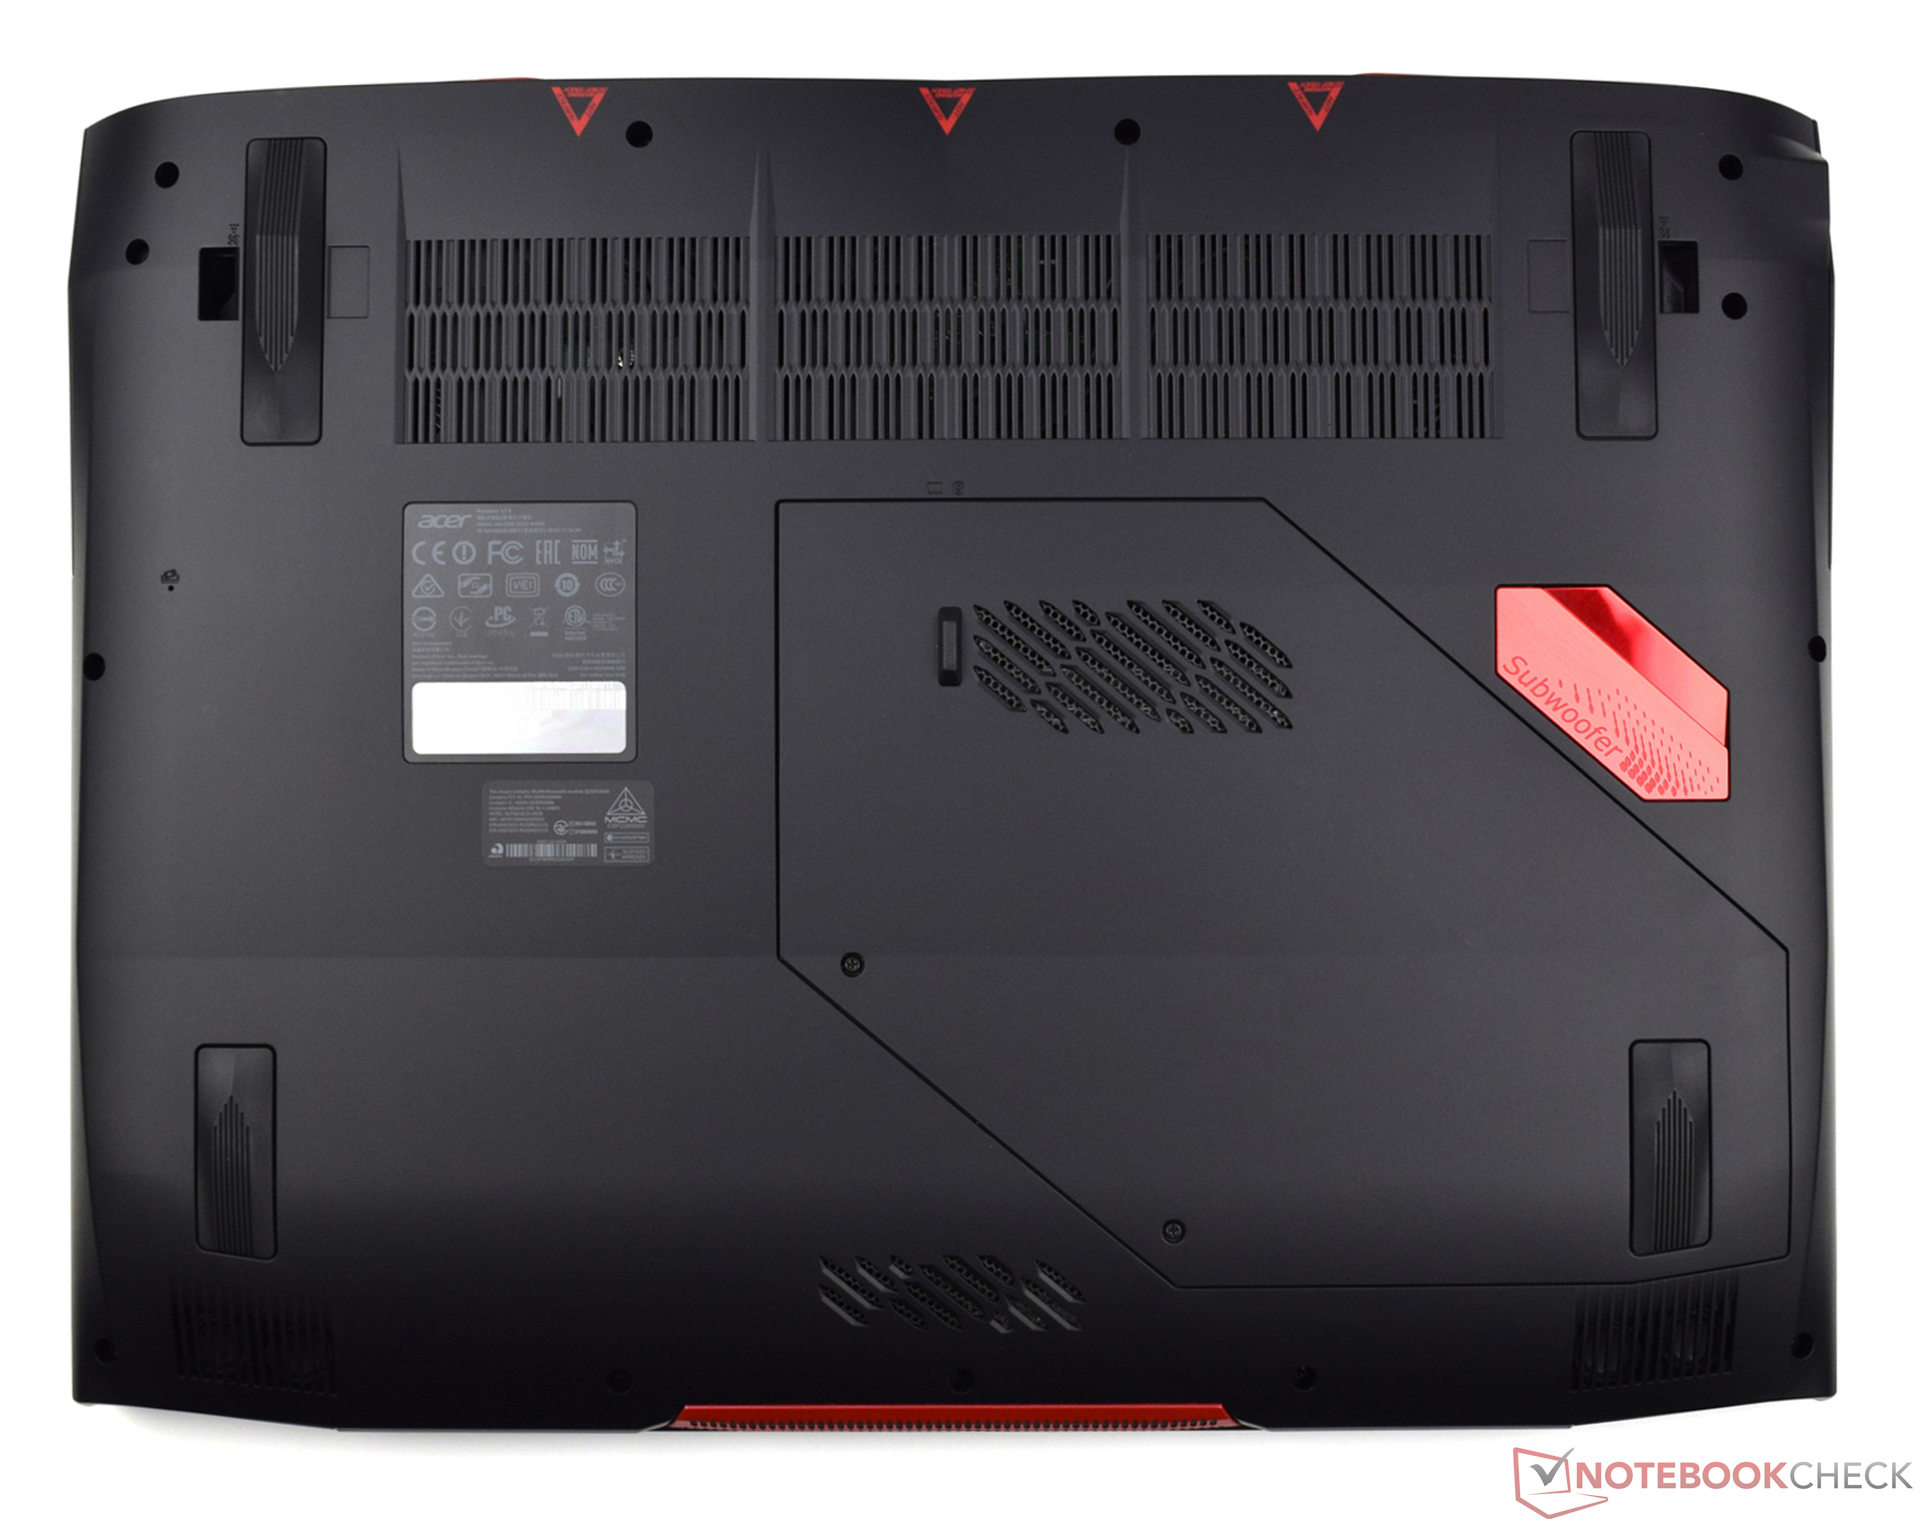
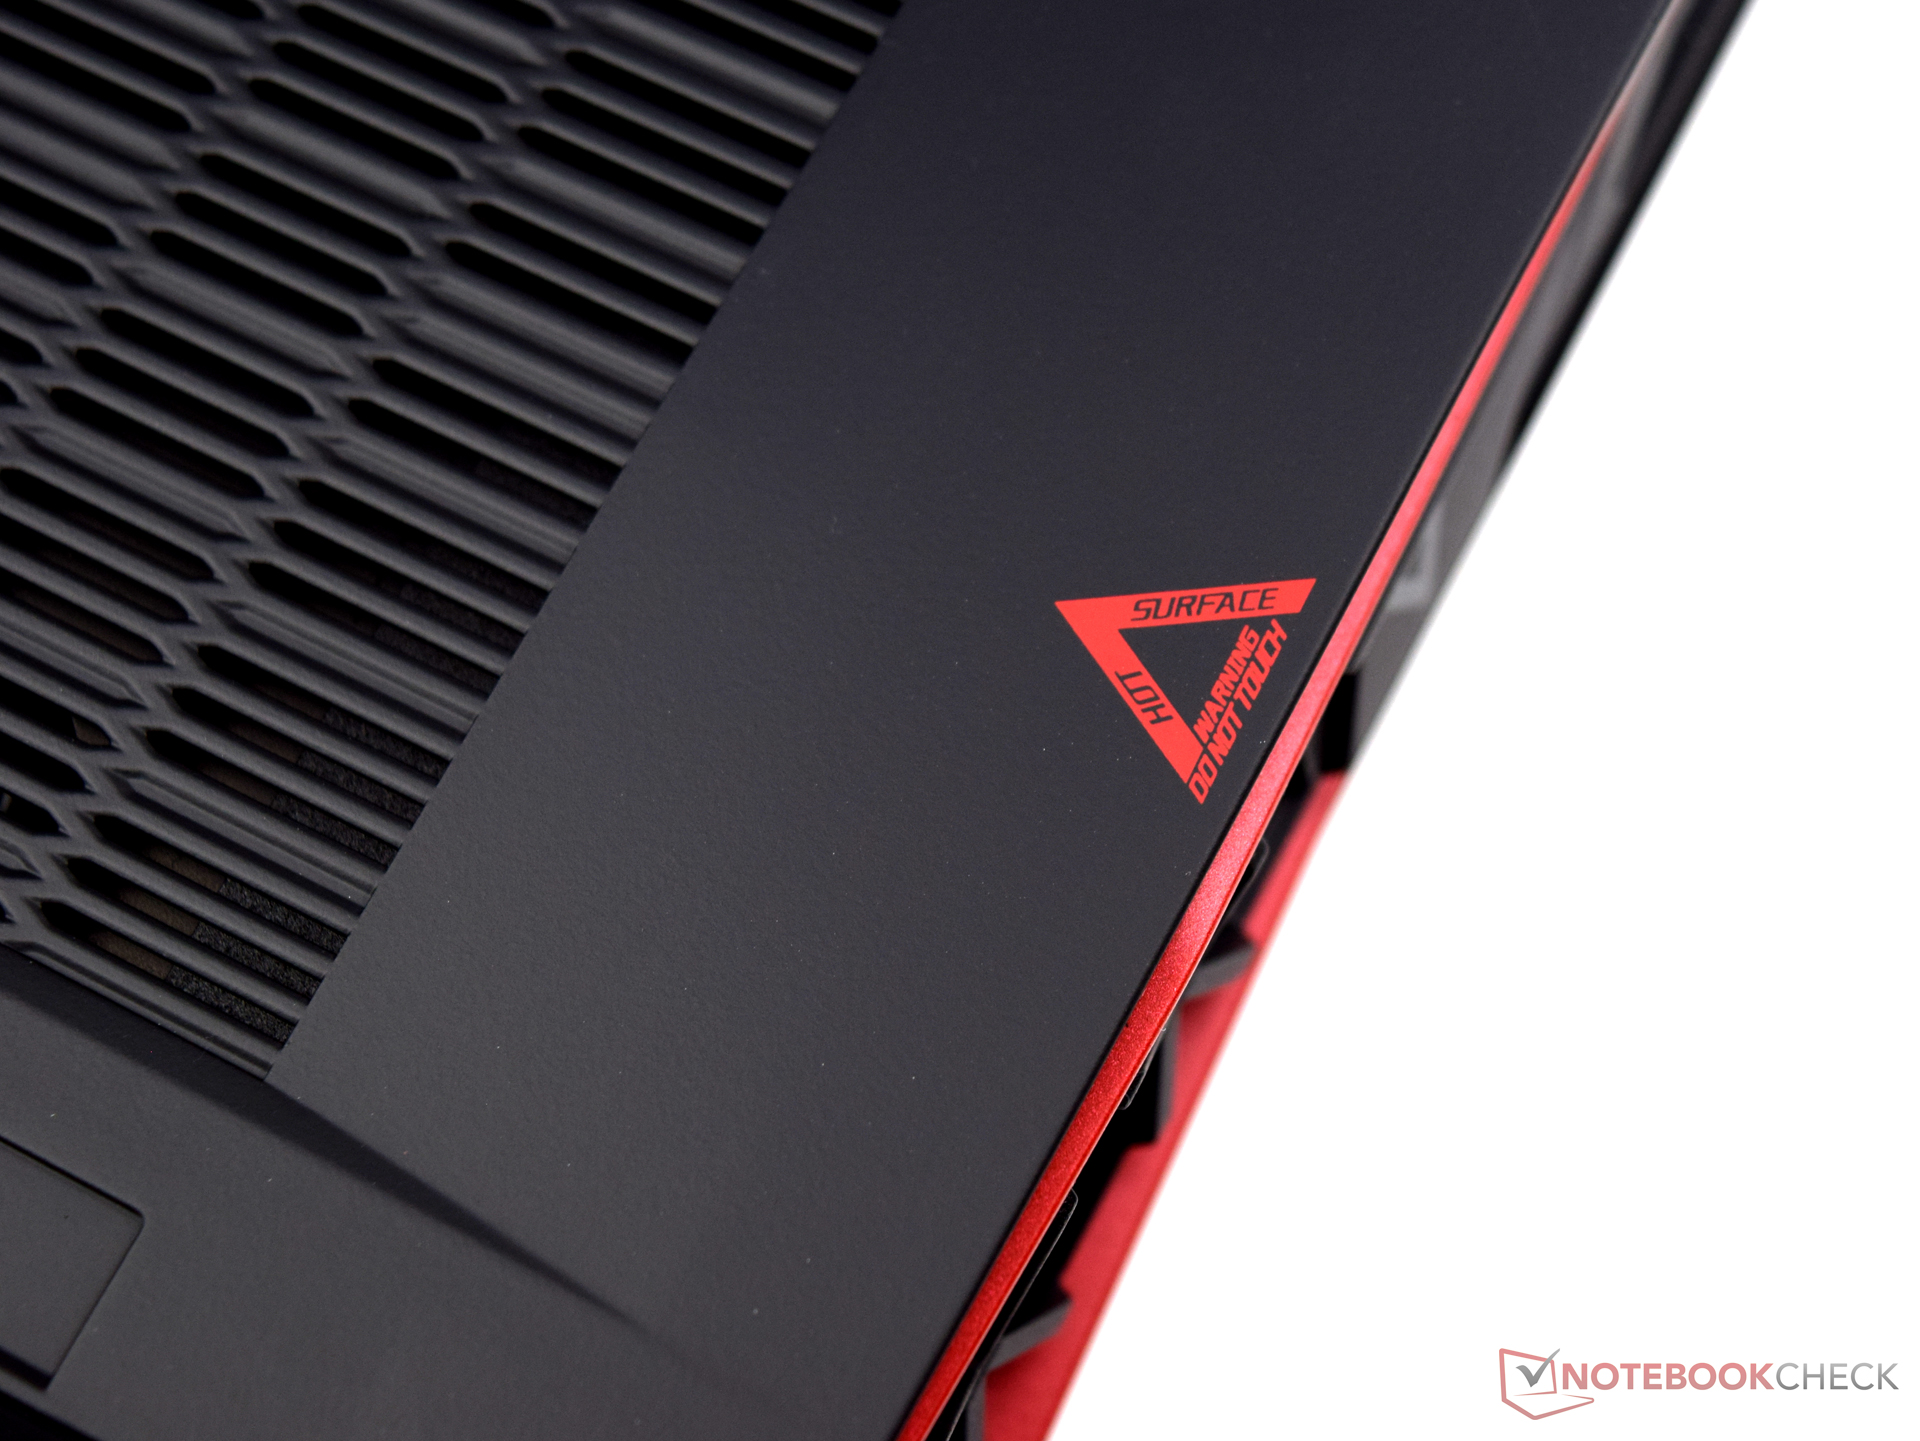
(±) La temperatura massima sul lato superiore è di 44.2 °C / 112 F, rispetto alla media di 40.4 °C / 105 F, che varia da 21.2 a 68.8 °C per questa classe Gaming.
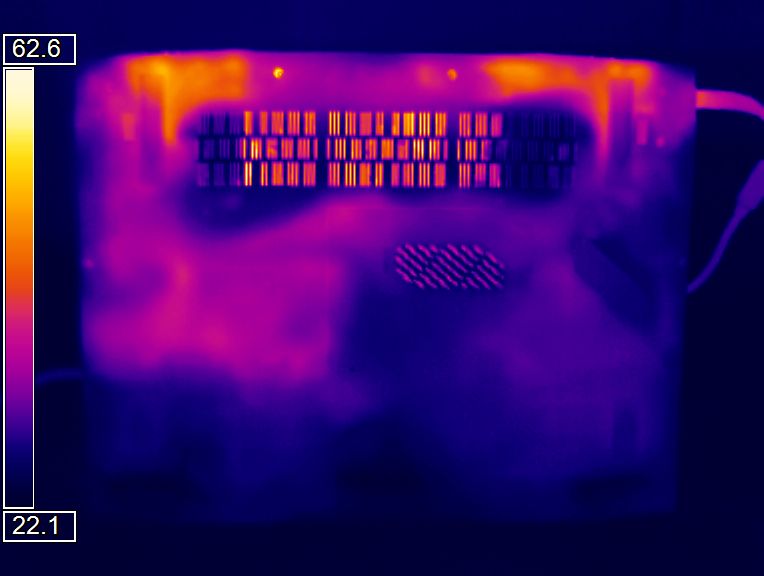
(±) Il lato inferiore si riscalda fino ad un massimo di 43 °C / 109 F, rispetto alla media di 43.2 °C / 110 F
(+) In idle, la temperatura media del lato superiore è di 29.9 °C / 86 F, rispetto alla media deld ispositivo di 33.8 °C / 93 F.
(+) I poggiapolsi e il touchpad sono piu' freddi della temperatura della pelle con un massimo di 31.9 °C / 89.4 F e sono quindi freddi al tatto.
(-) La temperatura media della zona del palmo della mano di dispositivi simili e'stata di 28.9 °C / 84 F (-3 °C / -5.4 F).
| Acer Predator 17 X GX-792-76DL i7-7820HK, GeForce GTX 1080 Mobile | MSI GT73VR 7RF-296 i7-7820HK, GeForce GTX 1080 Mobile | Asus G701VIK-BA049T i7-7820HK, GeForce GTX 1080 Mobile | Asus G752VS-XB78K 6820HK, GeForce GTX 1070 Mobile | MSI GT72VR 7RE-433 i7-7700HQ, GeForce GTX 1070 Mobile | Aorus X7 v6 6820HK, GeForce GTX 1070 Mobile | Acer Predator 17 G9-793-77LG 6700HQ, GeForce GTX 1070 Mobile | |
|---|---|---|---|---|---|---|---|
| Heat | 8% | 0% | 5% | 8% | -3% | 3% | |
| Maximum Upper Side * | 44.2 | 39.8 10% | 50.9 -15% | 42.9 3% | 41.5 6% | 47.5 -7% | 42.6 4% |
| Maximum Bottom * | 43 | 47.8 -11% | 44.6 -4% | 41.5 3% | 50.6 -18% | 54.5 -27% | 44.9 -4% |
| Idle Upper Side * | 32.4 | 27.1 16% | 29.9 8% | 31.6 2% | 26.4 19% | 28.6 12% | 33.1 -2% |
| Idle Bottom * | 32.8 | 27.4 16% | 28.8 12% | 29.5 10% | 25.4 23% | 28.8 12% | 28.9 12% |
* ... Meglio usare valori piccoli
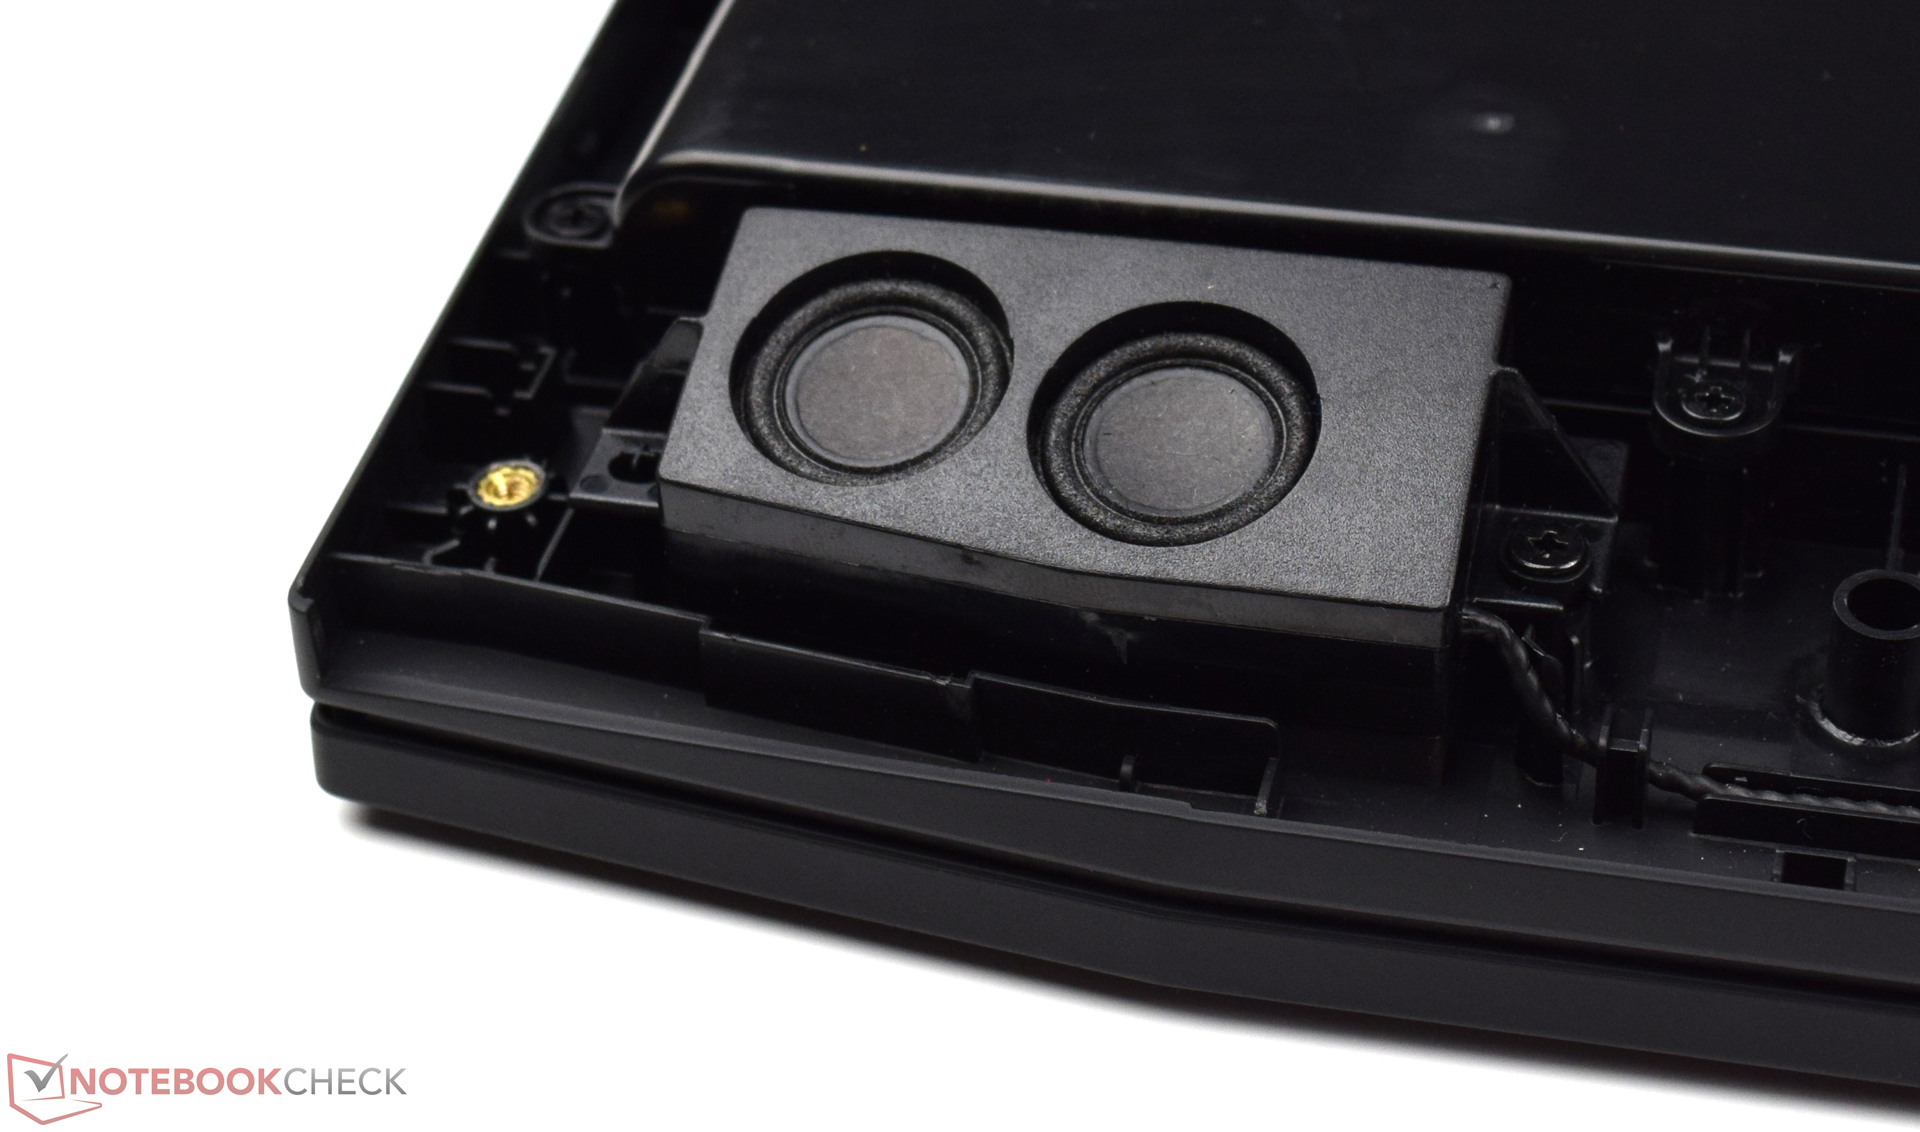
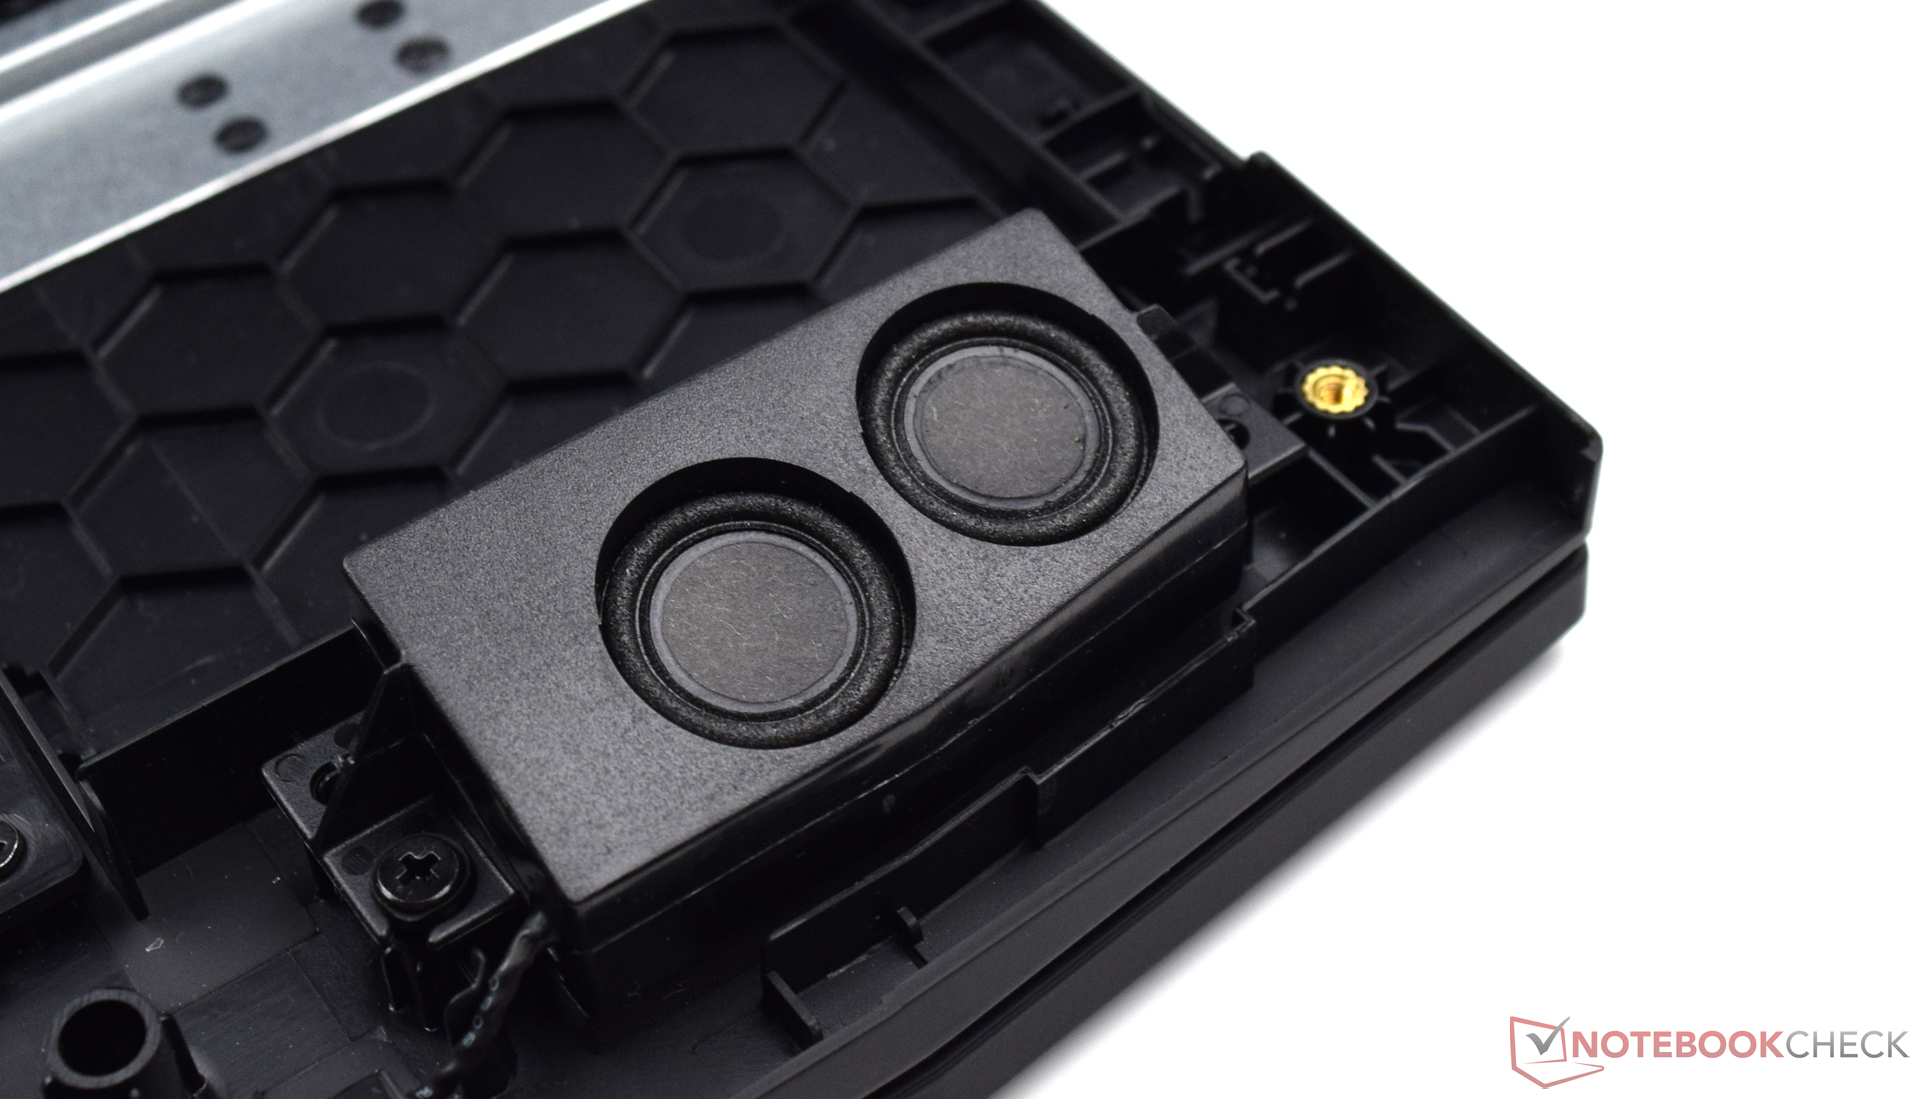
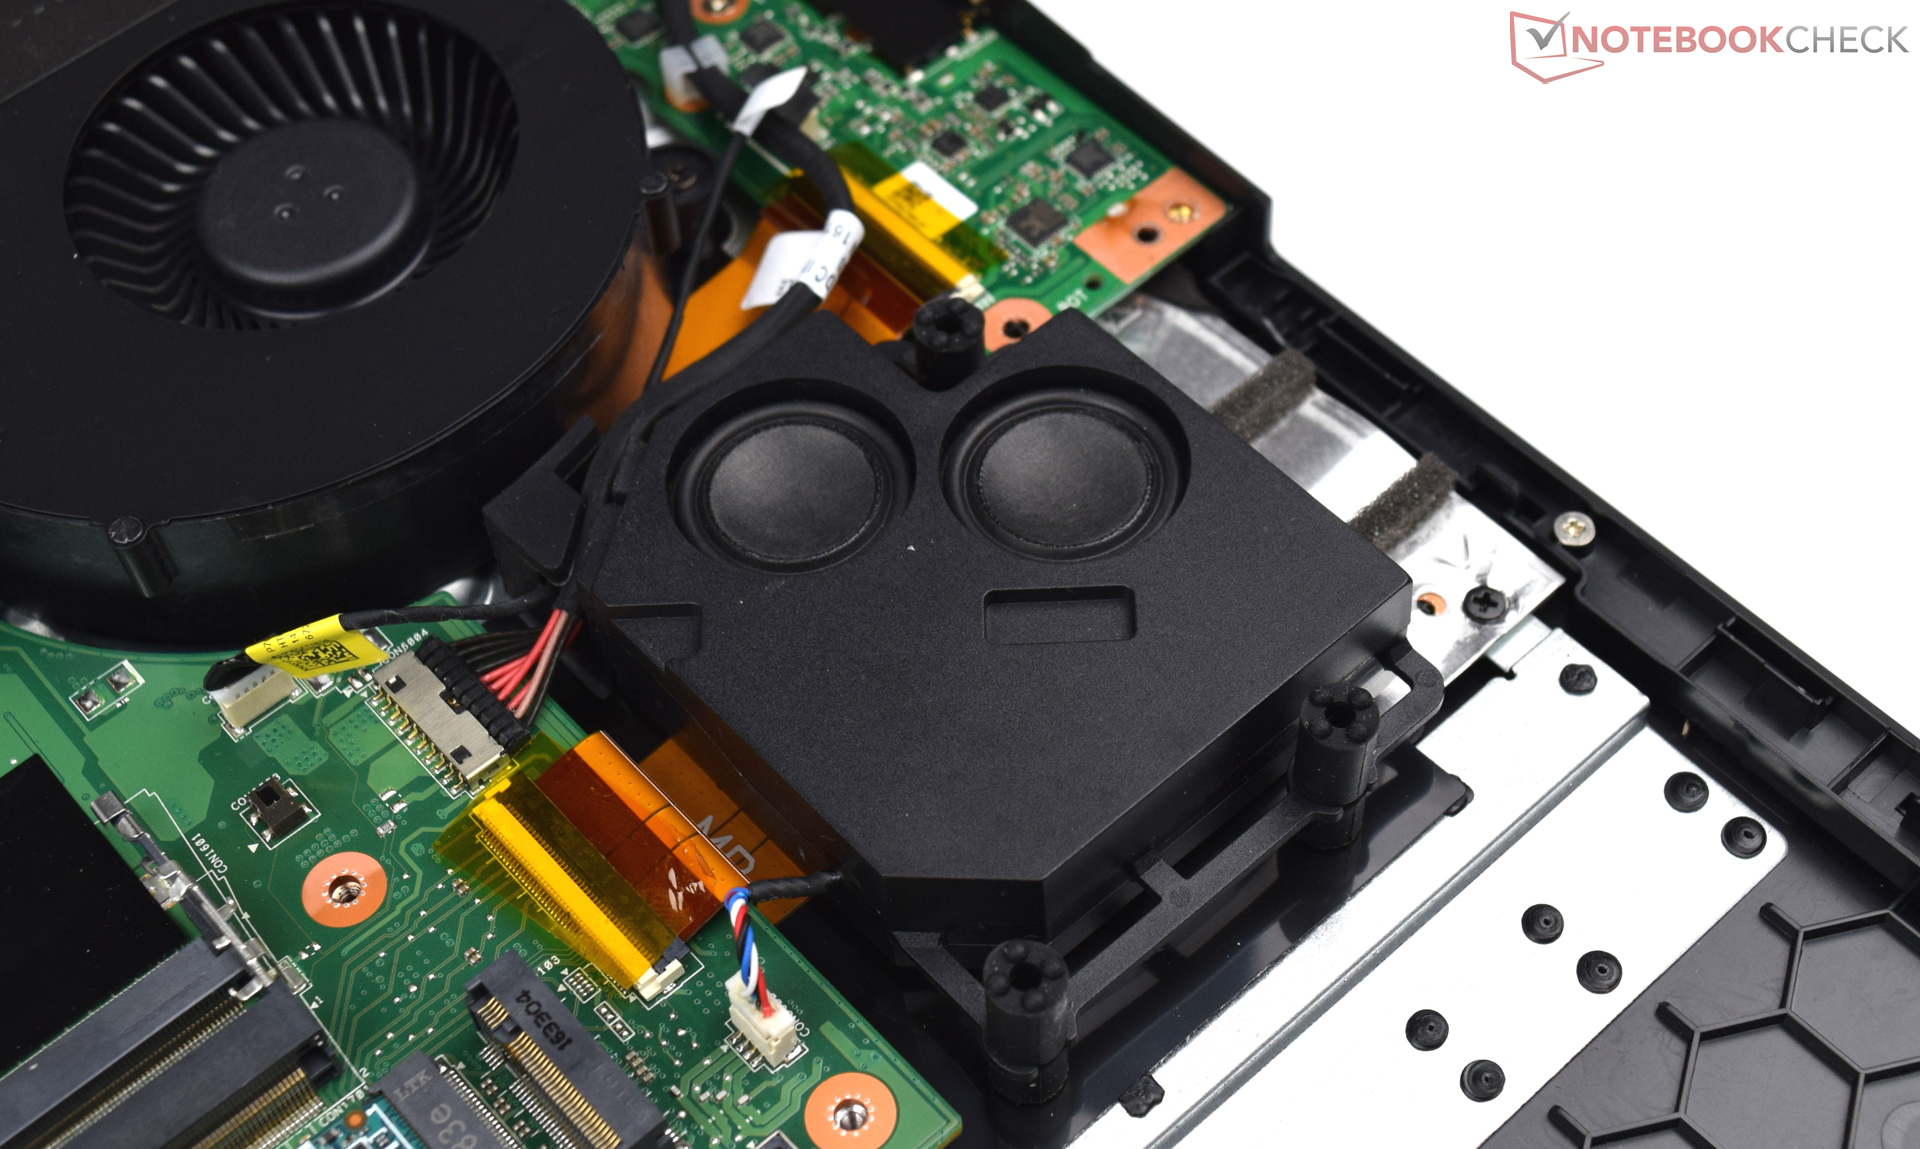
Acer Predator 17 X GX-792-76DL analisi audio
(+) | gli altoparlanti sono relativamente potenti (86 dB)
Bassi 100 - 315 Hz
(±) | bassi ridotti - in media 9.6% inferiori alla media
(±) | la linearità dei bassi è media (9.3% delta rispetto alla precedente frequenza)
Medi 400 - 2000 Hz
(+) | medi bilanciati - solo only 2.6% rispetto alla media
(+) | medi lineari (4.9% delta rispetto alla precedente frequenza)
Alti 2 - 16 kHz
(+) | Alti bilanciati - appena 3.9% dalla media
(+) | alti lineari (6.7% delta rispetto alla precedente frequenza)
Nel complesso 100 - 16.000 Hz
(+) | suono nel complesso lineare (11.1% differenza dalla media)
Rispetto alla stessa classe
» 7% di tutti i dispositivi testati in questa classe è stato migliore, 3% simile, 90% peggiore
» Il migliore ha avuto un delta di 6%, medio di 18%, peggiore di 132%
Rispetto a tutti i dispositivi testati
» 5% di tutti i dispositivi testati in questa classe è stato migliore, 1% similare, 94% peggiore
» Il migliore ha avuto un delta di 4%, medio di 25%, peggiore di 134%
MSI GT73VR 7RF-296 analisi audio
(+) | gli altoparlanti sono relativamente potenti (93 dB)
Bassi 100 - 315 Hz
(±) | bassi ridotti - in media 11.7% inferiori alla media
(±) | la linearità dei bassi è media (9% delta rispetto alla precedente frequenza)
Medi 400 - 2000 Hz
(+) | medi bilanciati - solo only 3% rispetto alla media
(+) | medi lineari (3.6% delta rispetto alla precedente frequenza)
Alti 2 - 16 kHz
(+) | Alti bilanciati - appena 4% dalla media
(+) | alti lineari (3.5% delta rispetto alla precedente frequenza)
Nel complesso 100 - 16.000 Hz
(+) | suono nel complesso lineare (13.6% differenza dalla media)
Rispetto alla stessa classe
» 19% di tutti i dispositivi testati in questa classe è stato migliore, 6% simile, 75% peggiore
» Il migliore ha avuto un delta di 6%, medio di 18%, peggiore di 132%
Rispetto a tutti i dispositivi testati
» 11% di tutti i dispositivi testati in questa classe è stato migliore, 3% similare, 85% peggiore
» Il migliore ha avuto un delta di 4%, medio di 25%, peggiore di 134%
| Off / Standby | |
| Idle | |
| Sotto carico |
|
Leggenda:
min: Attualmente utilizziamo il Metrahit Energy, un multimetro digitale professionale per la misurazione della qualità della potenza e dell'energia monofase, per le nostre misurazioni. | |
| Acer Predator 17 X GX-792-76DL i7-7820HK, GeForce GTX 1080 Mobile | MSI GT73VR 7RF-296 i7-7820HK, GeForce GTX 1080 Mobile | Asus G701VIK-BA049T i7-7820HK, GeForce GTX 1080 Mobile | Asus G752VS-XB78K 6820HK, GeForce GTX 1070 Mobile | MSI GT72VR 7RE-433 i7-7700HQ, GeForce GTX 1070 Mobile | Aorus X7 v6 6820HK, GeForce GTX 1070 Mobile | Acer Predator 17 G9-793-77LG 6700HQ, GeForce GTX 1070 Mobile | |
|---|---|---|---|---|---|---|---|
| Power Consumption | -7% | -1% | 10% | 22% | -2% | -1% | |
| Idle Minimum * | 27 | 29 -7% | 24 11% | 24 11% | 20 26% | 29 -7% | 25 7% |
| Idle Average * | 32 | 35 -9% | 31 3% | 31 3% | 27 16% | 31 3% | 35 -9% |
| Idle Maximum * | 41 | 40 2% | 38 7% | 36 12% | 31 24% | 38 7% | 46 -12% |
| Load Average * | 102 | 94 8% | 98 4% | 94 8% | 86 16% | 111 -9% | 103 -1% |
| Load Maximum * | 248 | 315 -27% | 320 -29% | 204 18% | 184 26% | 253 -2% | 223 10% |
* ... Meglio usare valori piccoli


| Acer Predator 17 X GX-792-76DL i7-7820HK, GeForce GTX 1080 Mobile, 88.8 Wh | MSI GT73VR 7RF-296 i7-7820HK, GeForce GTX 1080 Mobile, 75.2 Wh | Asus G701VIK-BA049T i7-7820HK, GeForce GTX 1080 Mobile, 93 Wh | Asus G752VS-XB78K 6820HK, GeForce GTX 1070 Mobile, 90 Wh | MSI GT72VR 7RE-433 i7-7700HQ, GeForce GTX 1070 Mobile, 83 Wh | Aorus X7 v6 6820HK, GeForce GTX 1070 Mobile, 94 Wh | Acer Predator 17 G9-793-77LG 6700HQ, GeForce GTX 1070 Mobile, 88 Wh | |
|---|---|---|---|---|---|---|---|
| Autonomia della batteria | -33% | -1% | -8% | 2% | -27% | -11% | |
| Reader / Idle | 313 | 342 9% | 311 -1% | 316 1% | 278 -11% | ||
| H.264 | 204 | 145 -29% | 186 -9% | 228 12% | |||
| WiFi v1.3 | 251 | 160 -36% | 241 -4% | 210 -16% | 230 -8% | 182 -27% | 200 -20% |
| Load | 90 | 83 -8% | 84 -7% | 91 1% | 89 -1% |
Pro
Contro

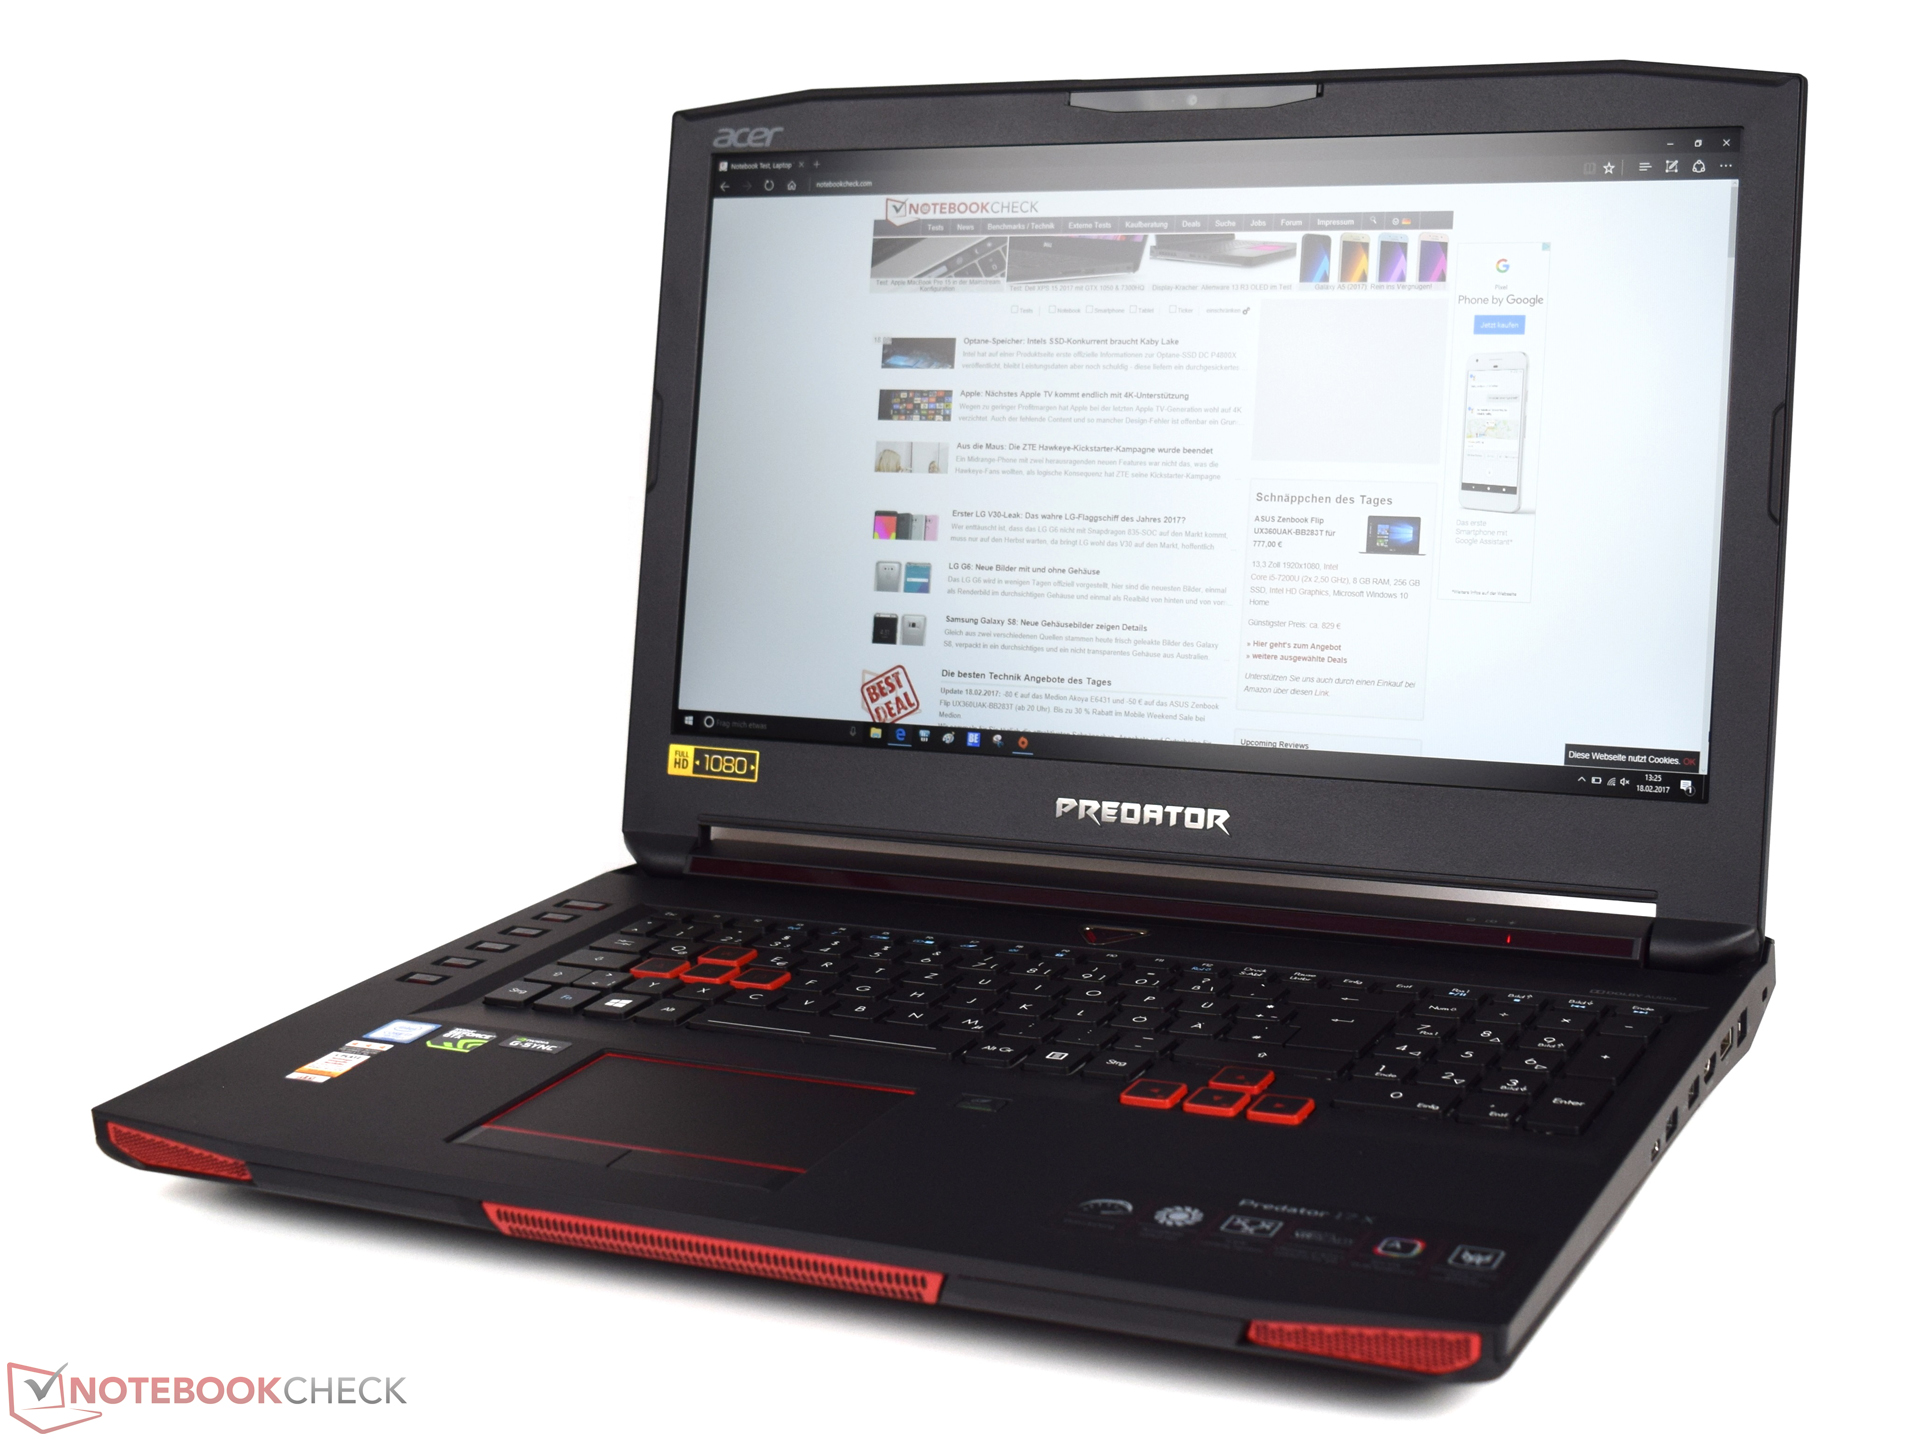
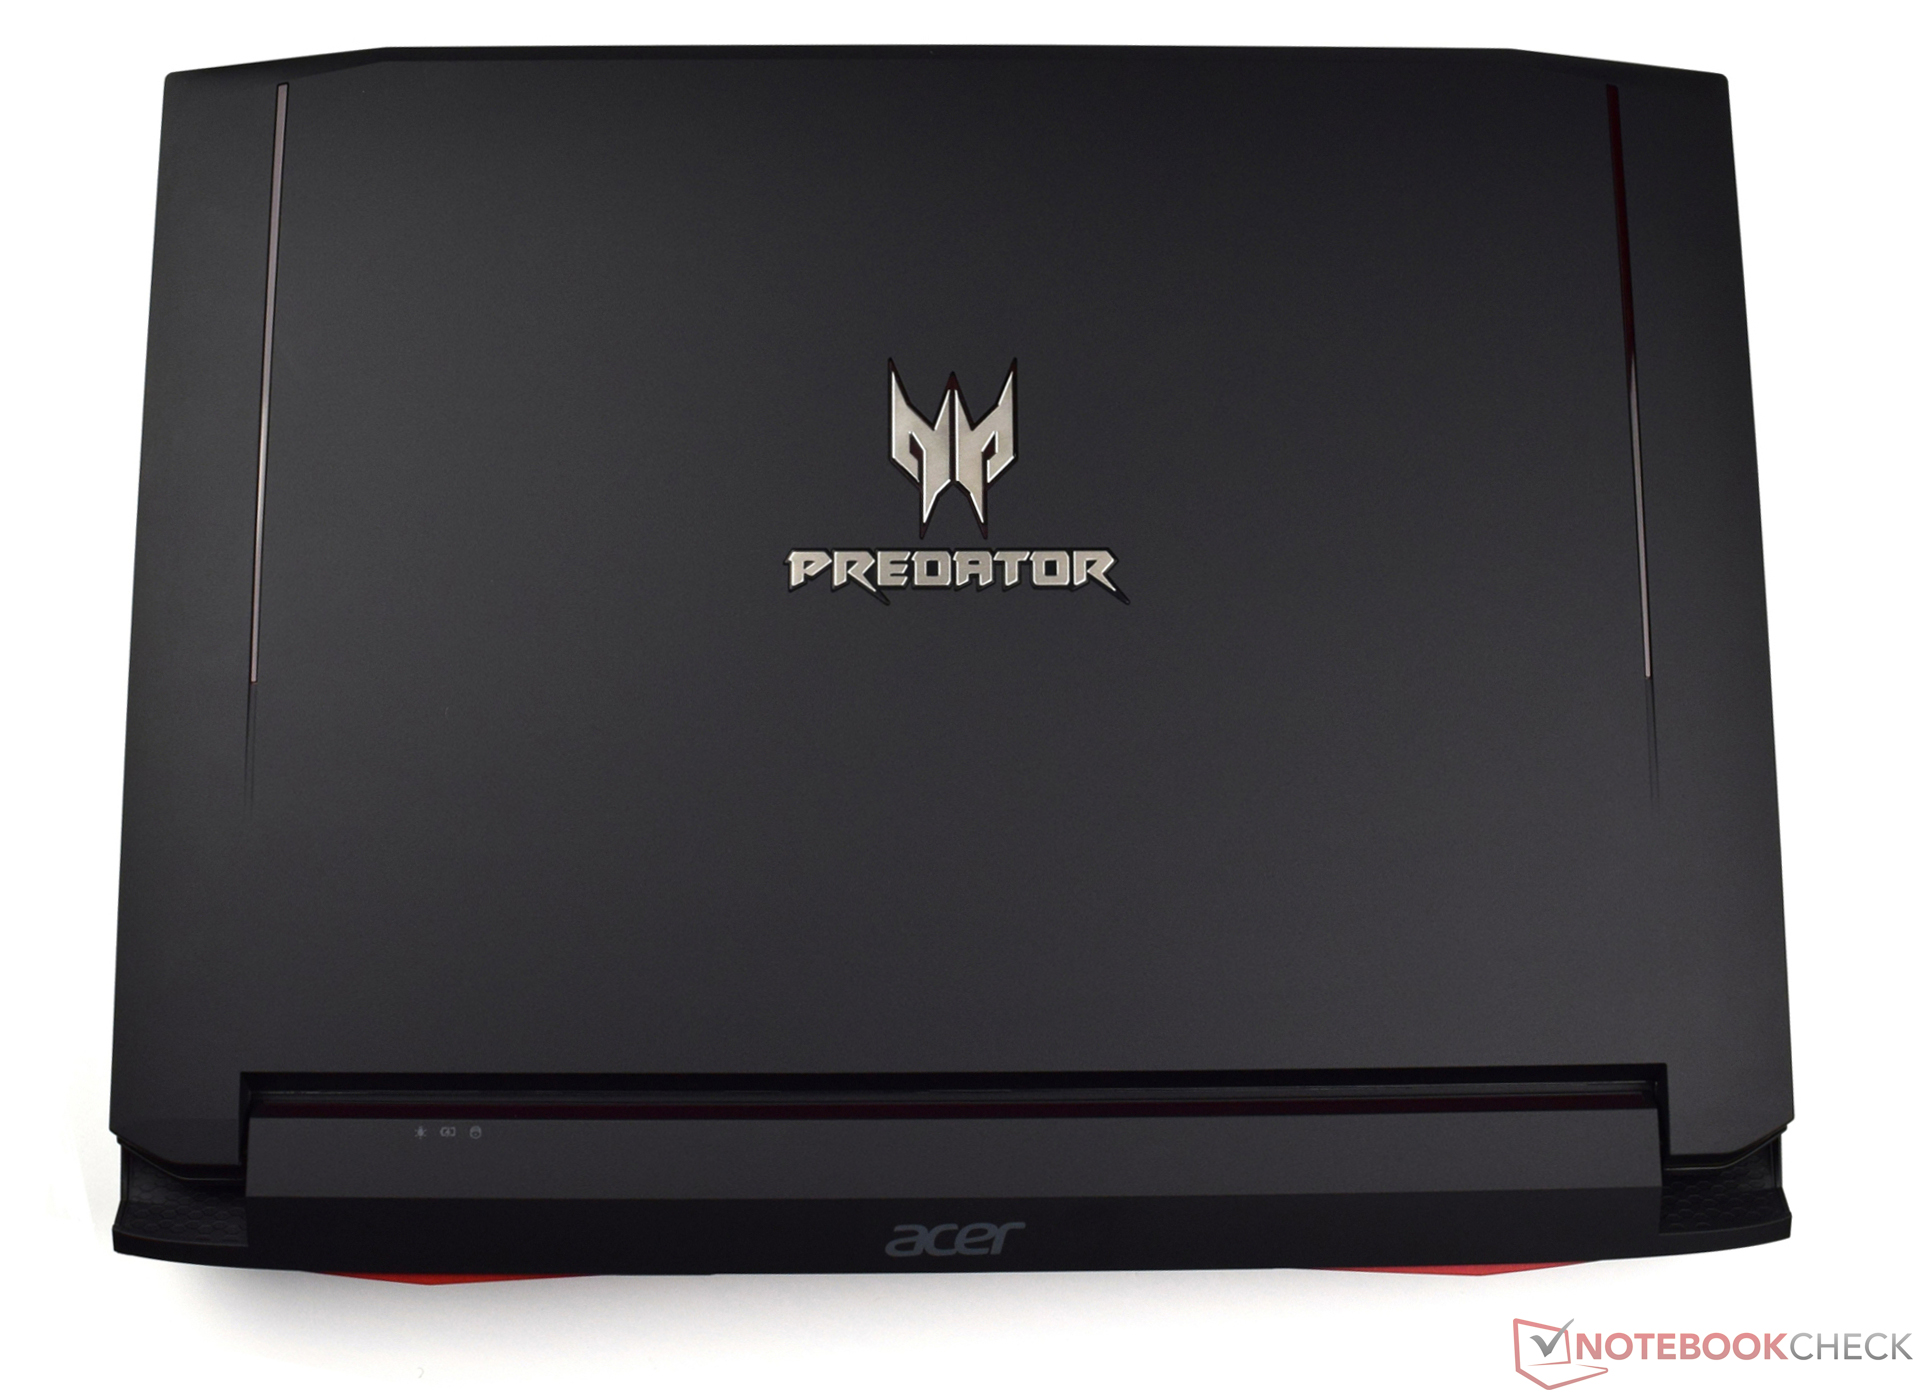
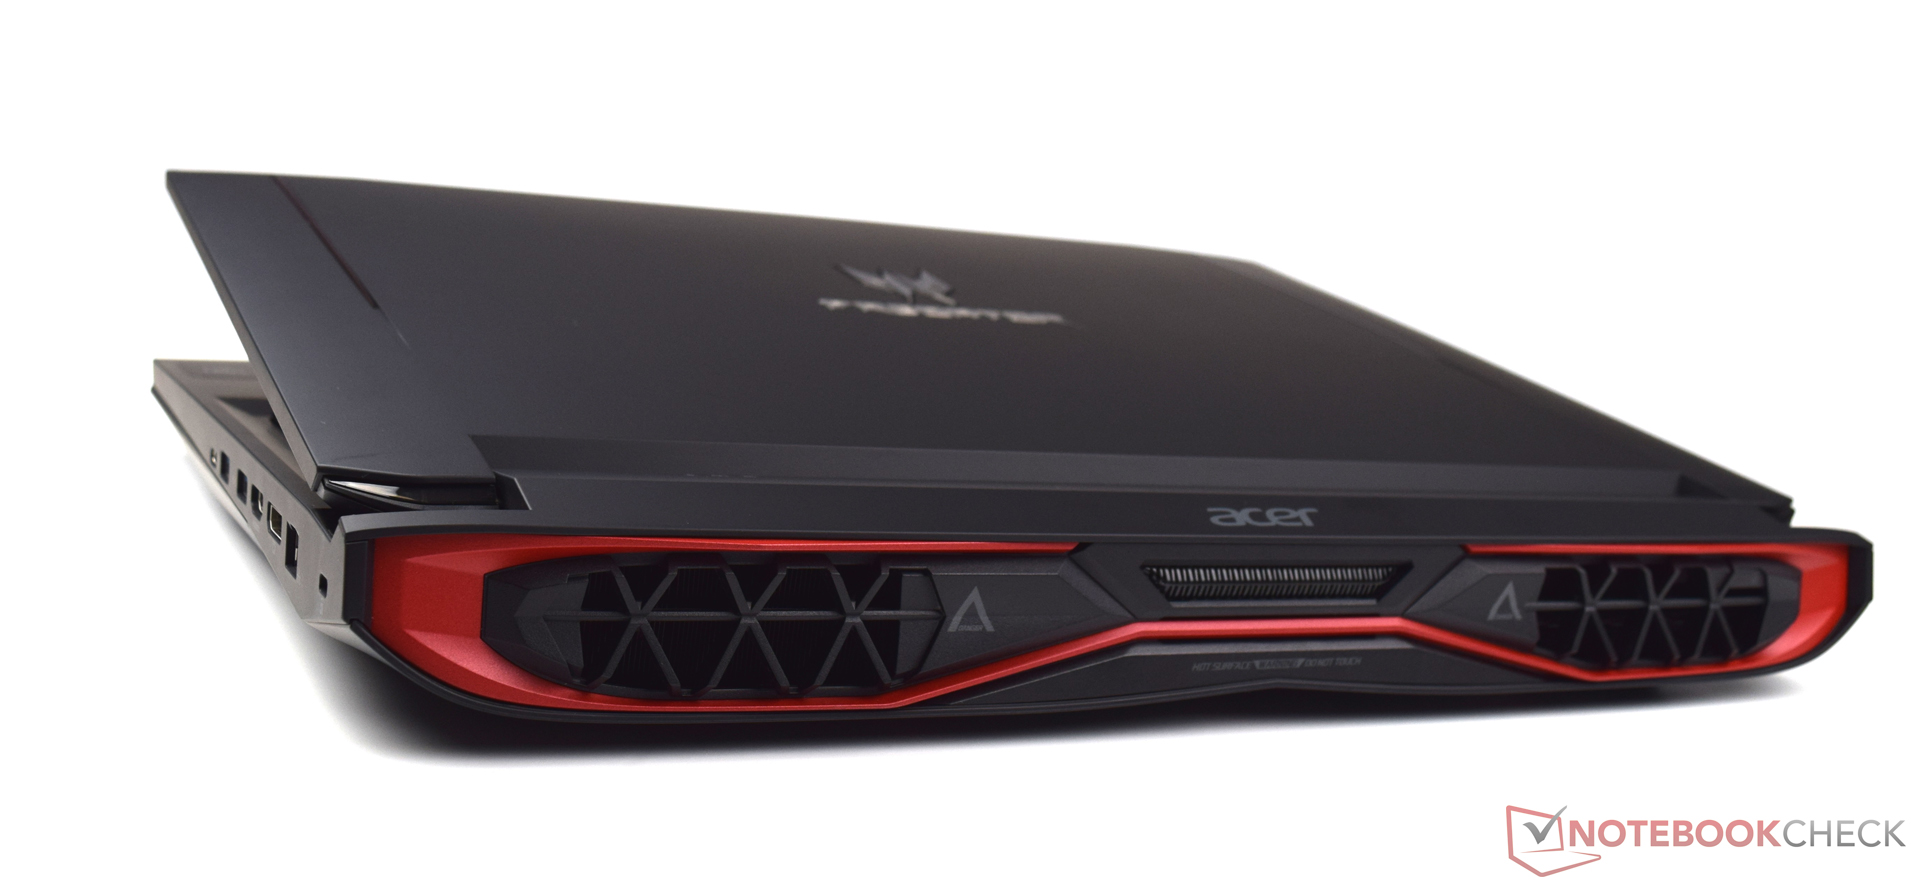
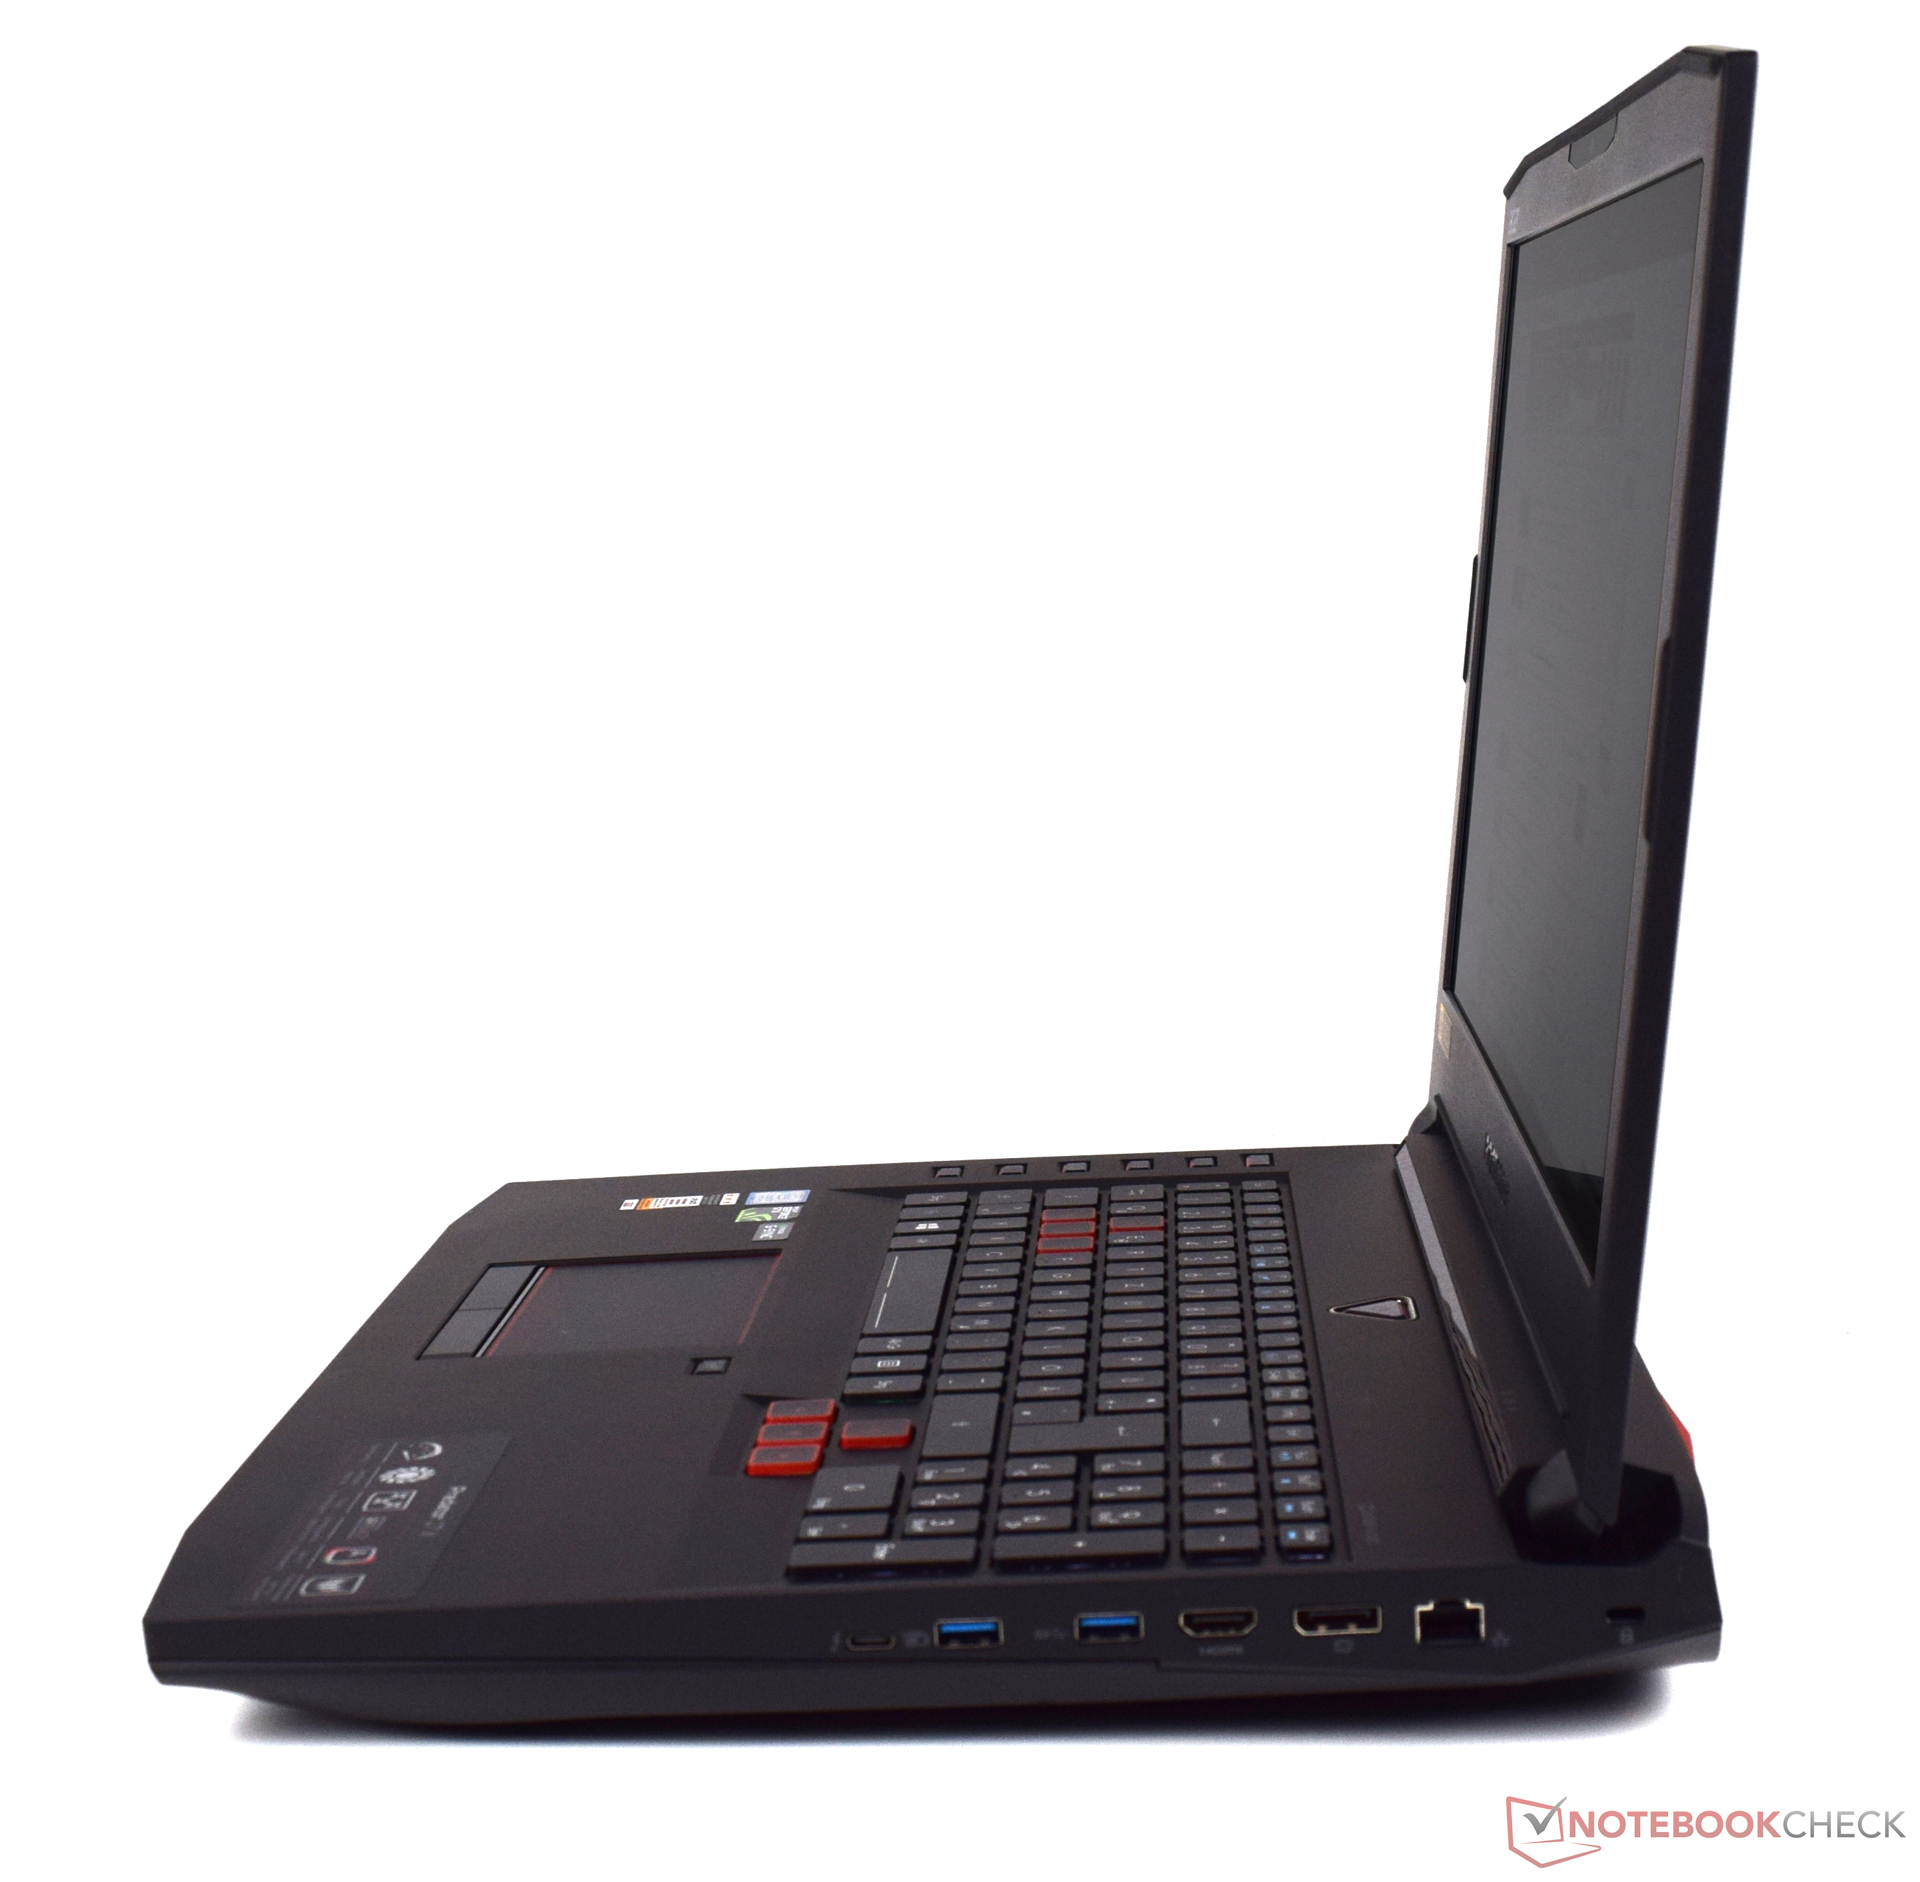
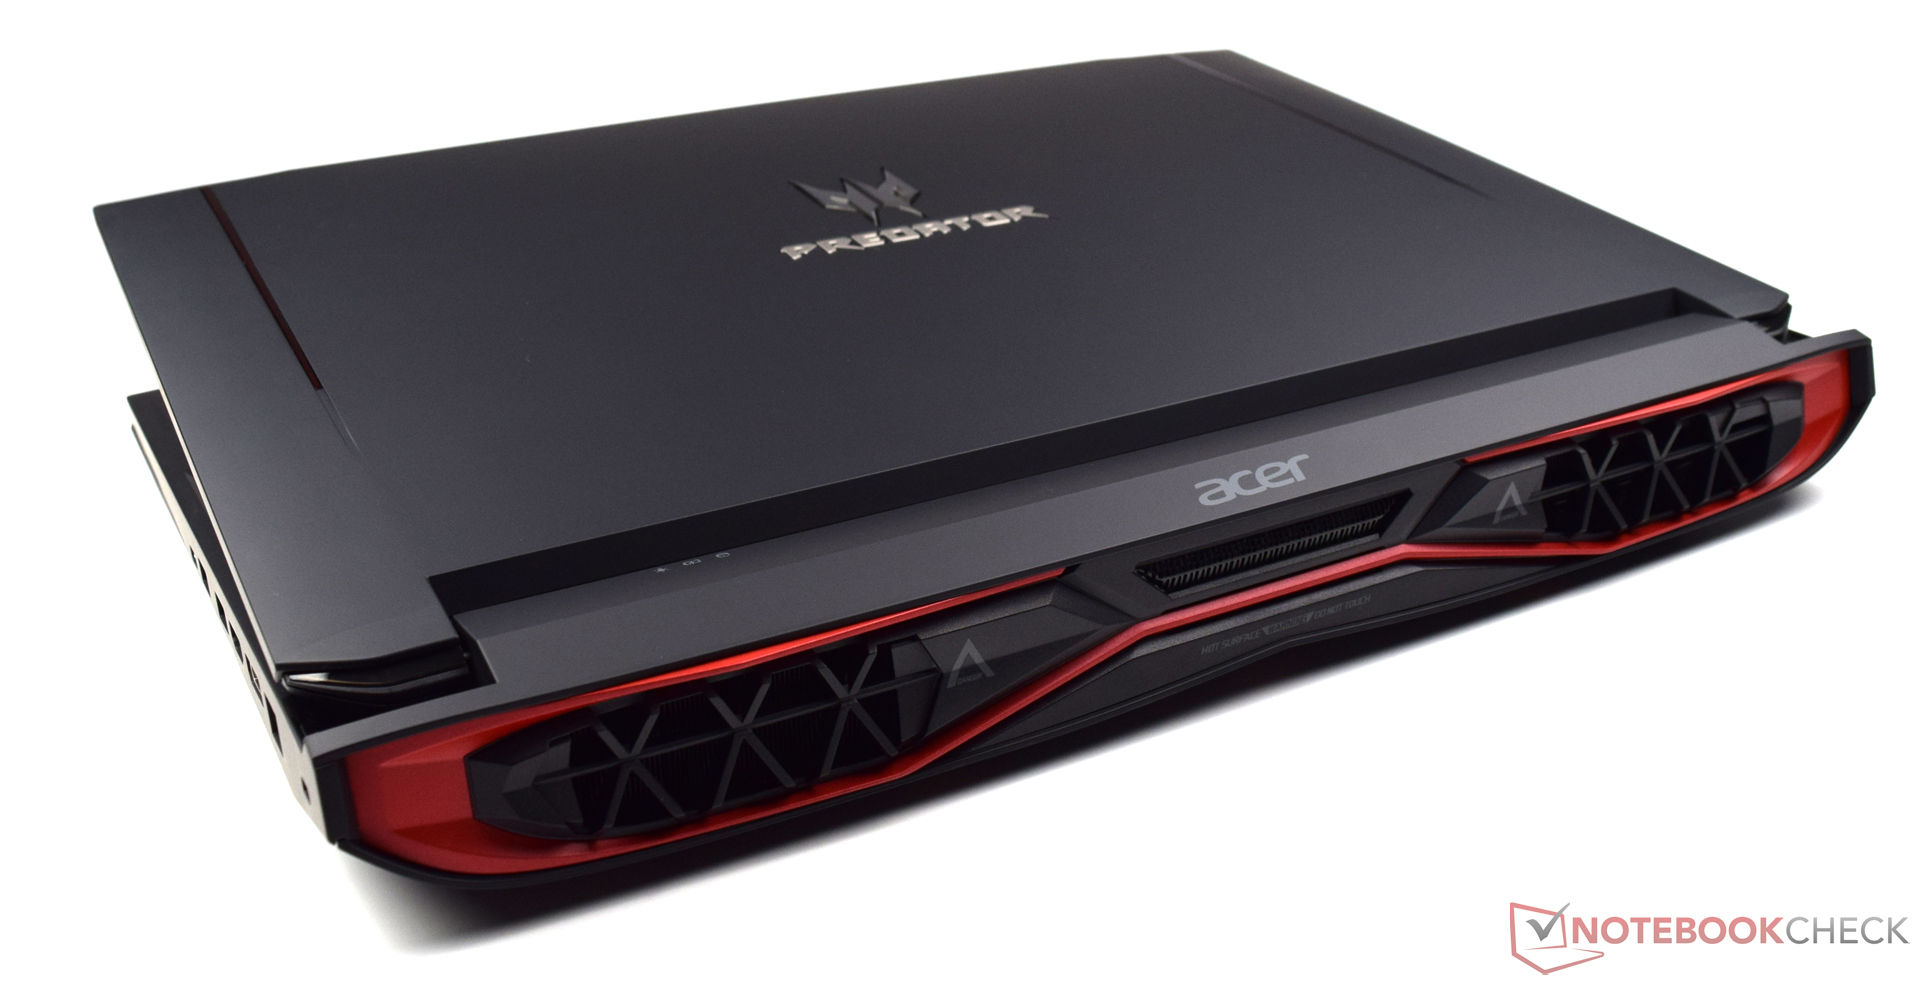
Il Predator 17 X è una buona alternativa al Predator 17 "regolare", sebbene Acer non risolve tutte le pecche. In definitiva non possiamo criticare le prestazioni: l'Intel Core i7-7820HK è adatto alla Nvidia GeForce GTX 1080. In alcuni benchmarks vediamo dei record, quindi si tratta di una potente macchina gaming. Il design è simile ad altri modelli Predator.
Acer ha un novo contendente per il segmento high-end gaming. Il Predator 17 X è un potente dispositivo gaming ed un serio concorrente per altri sistemi.
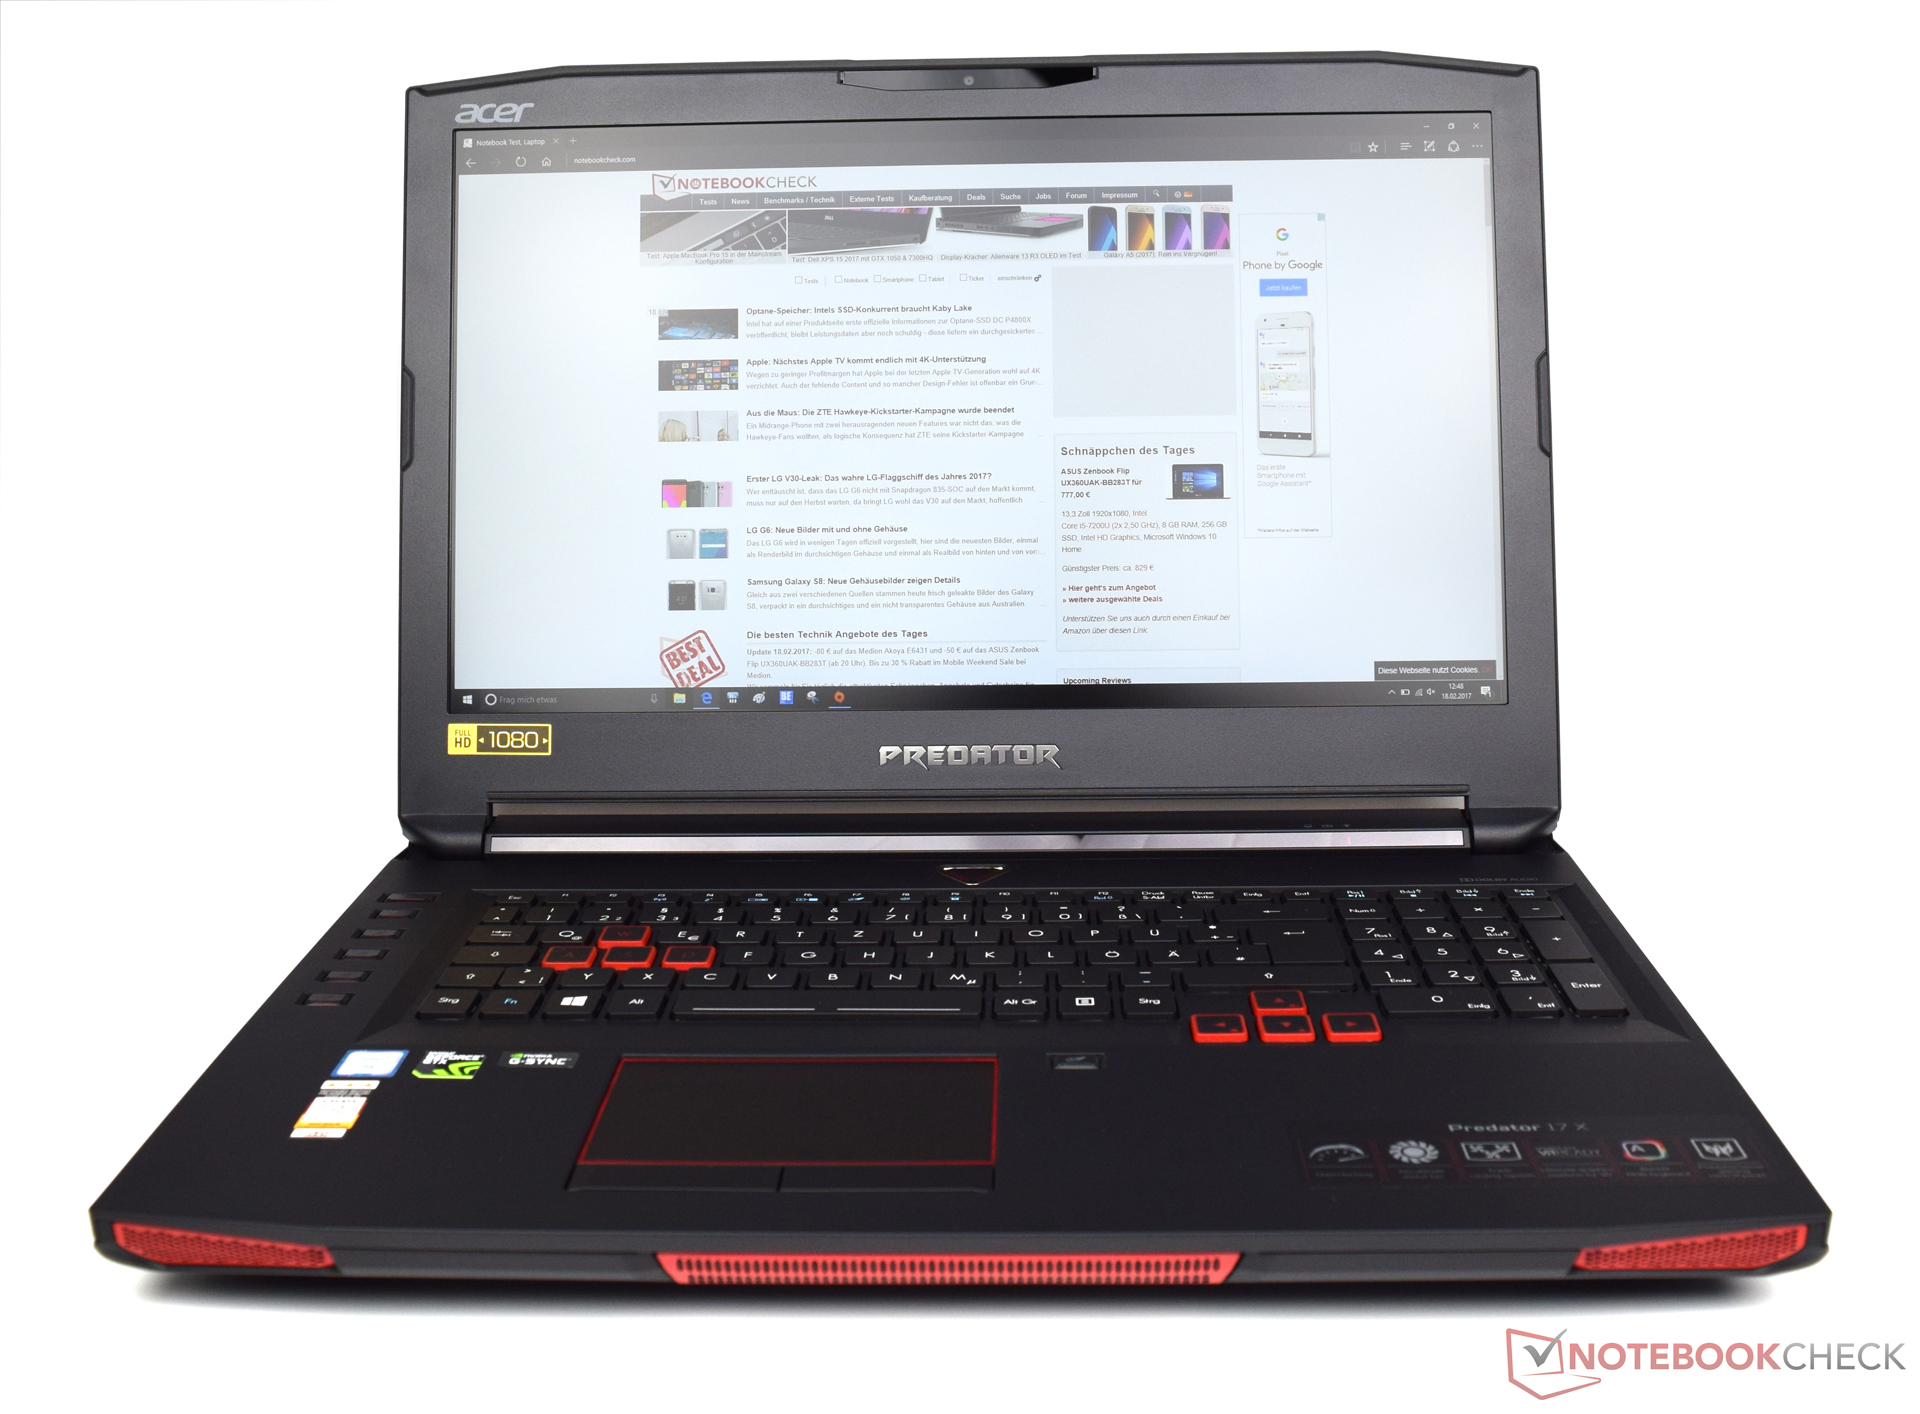
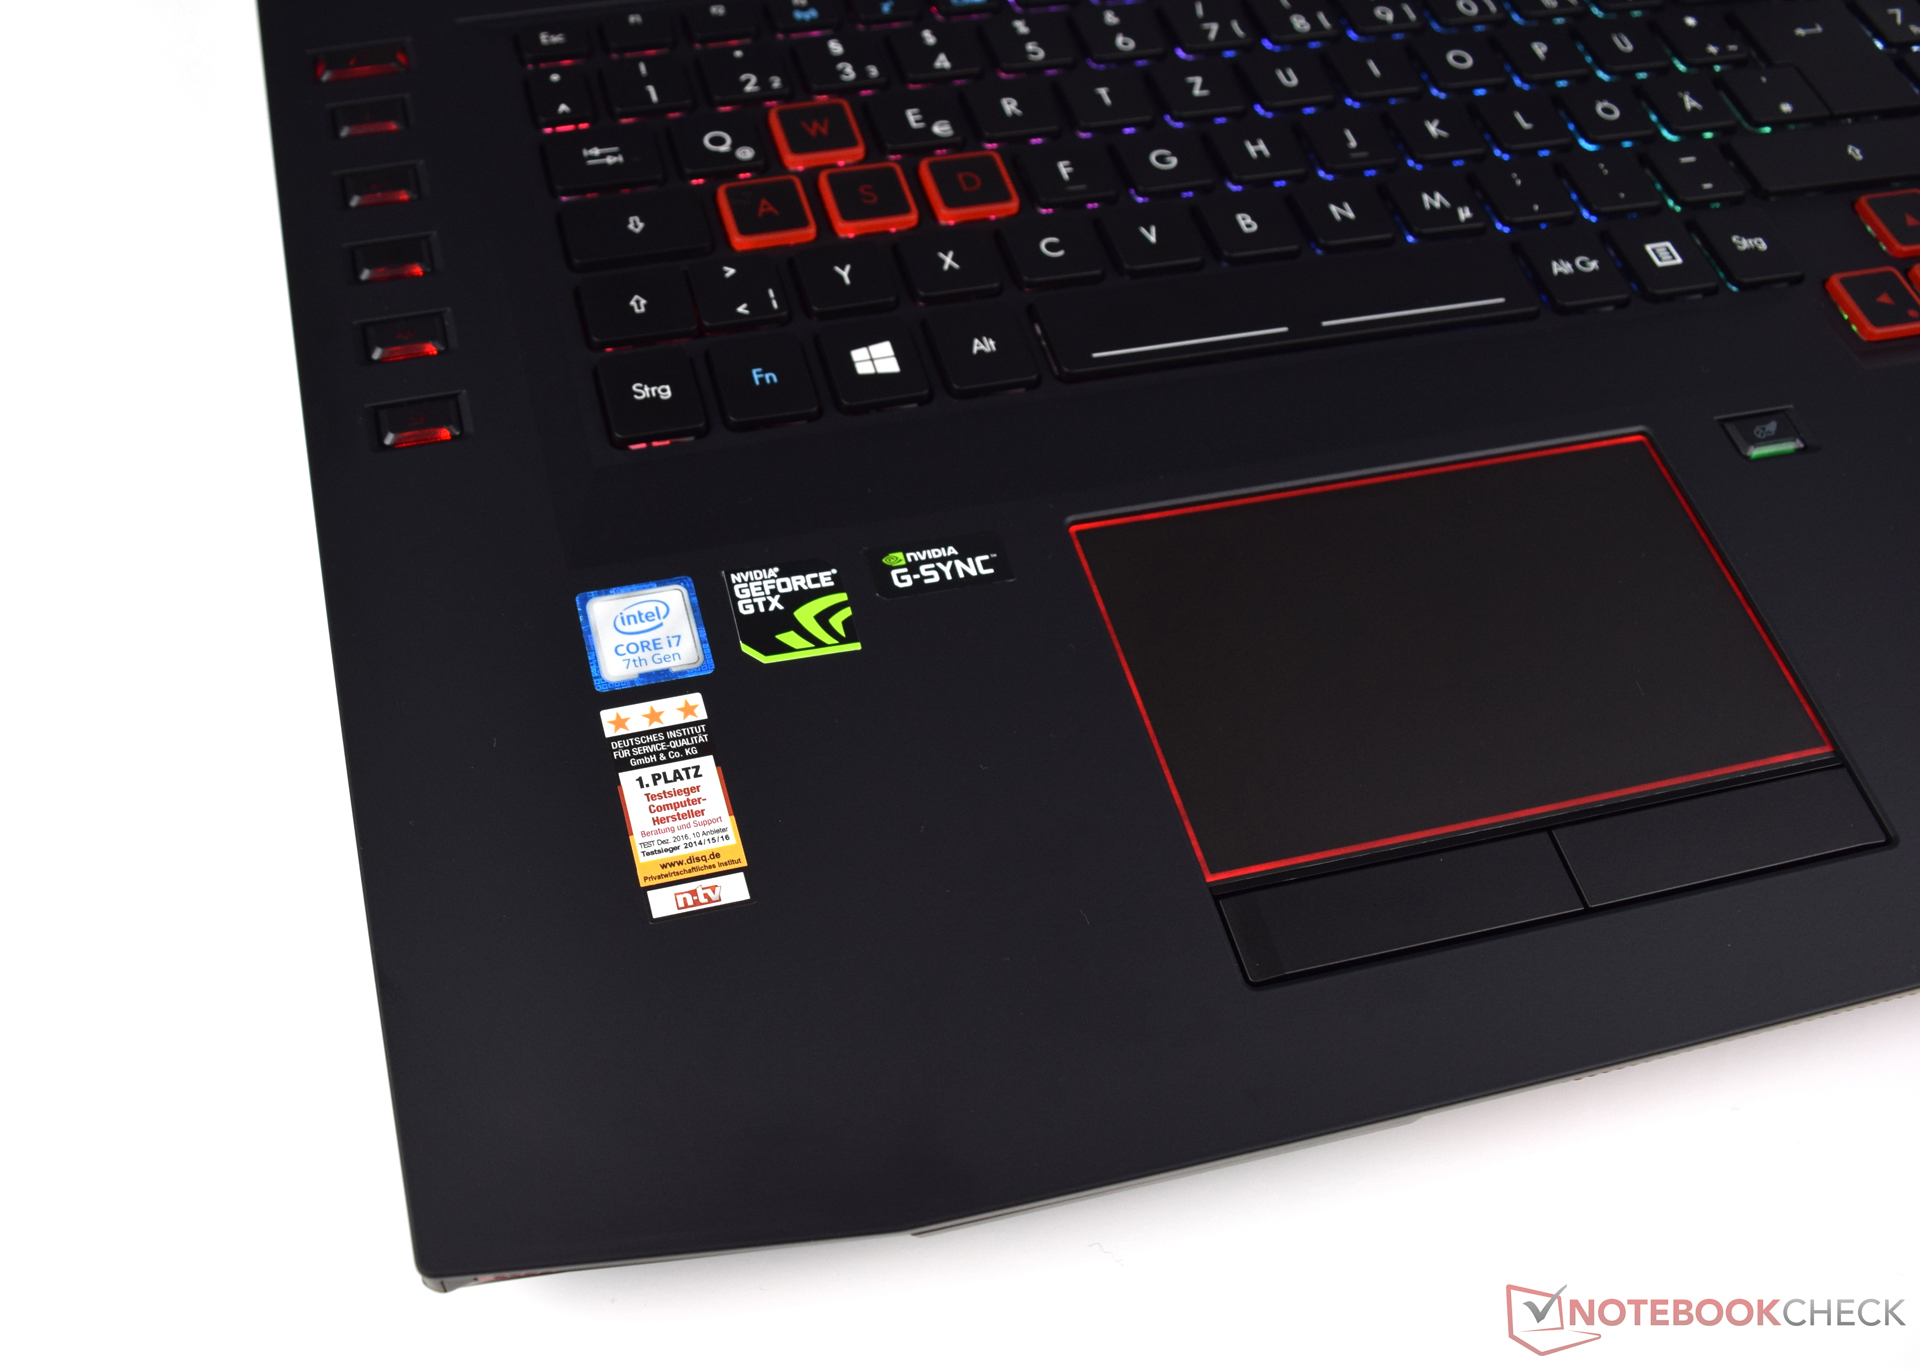
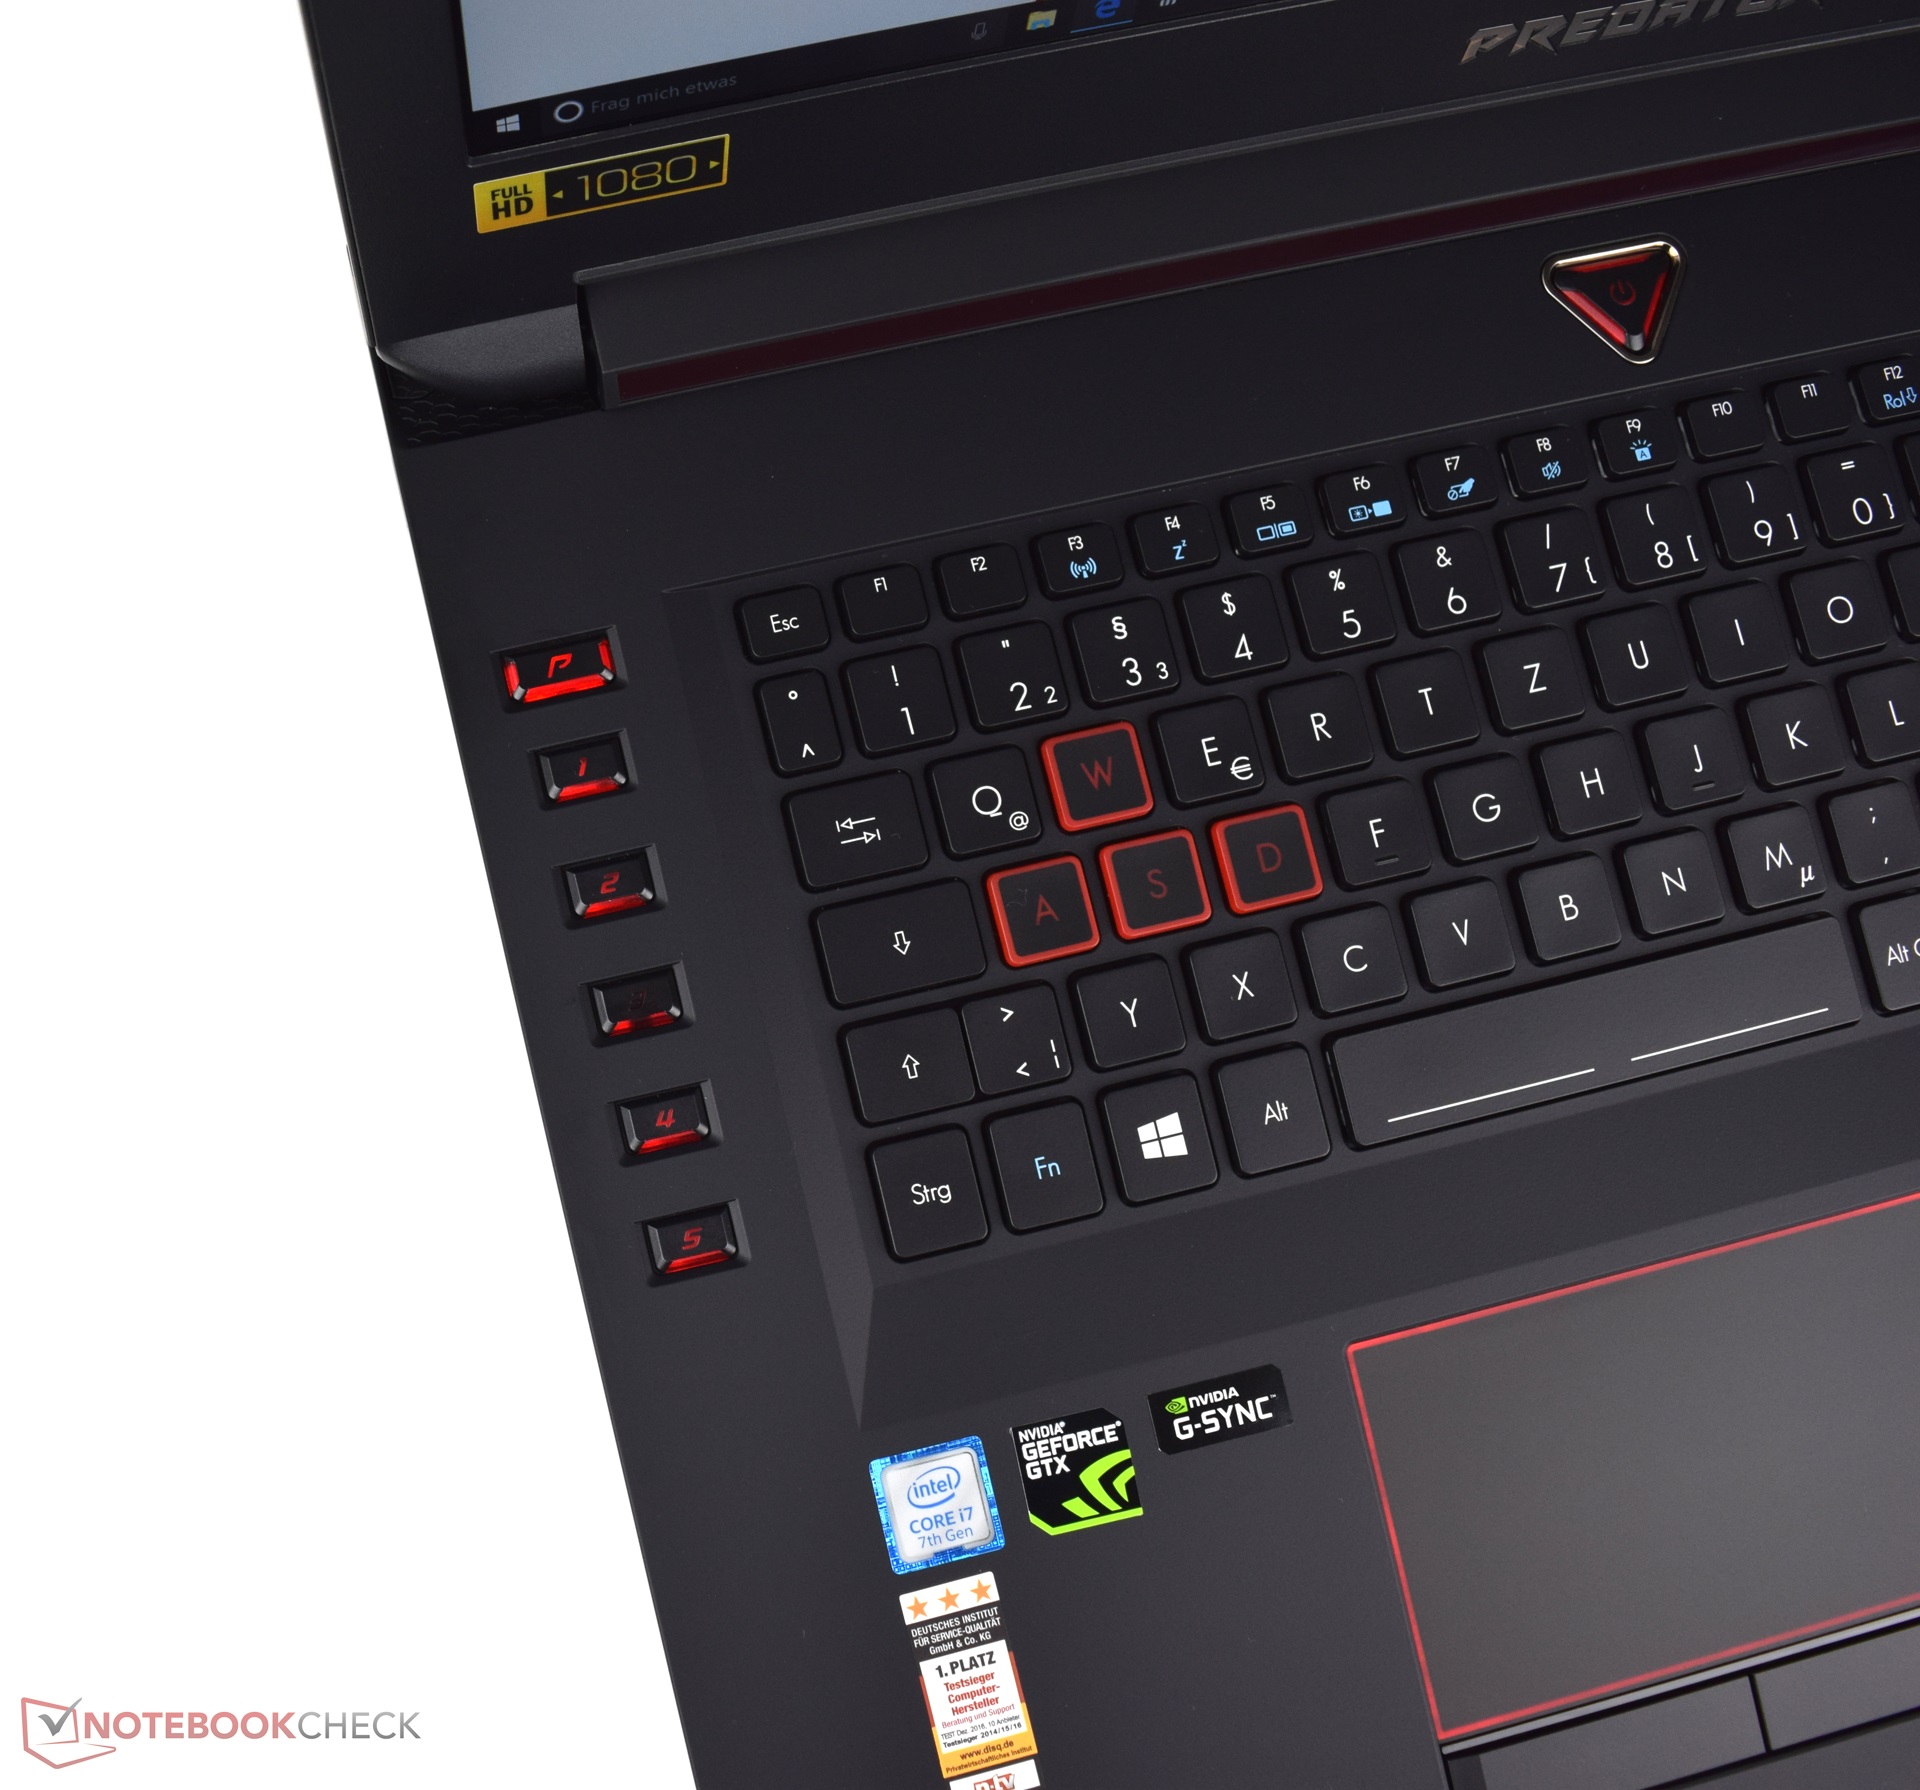
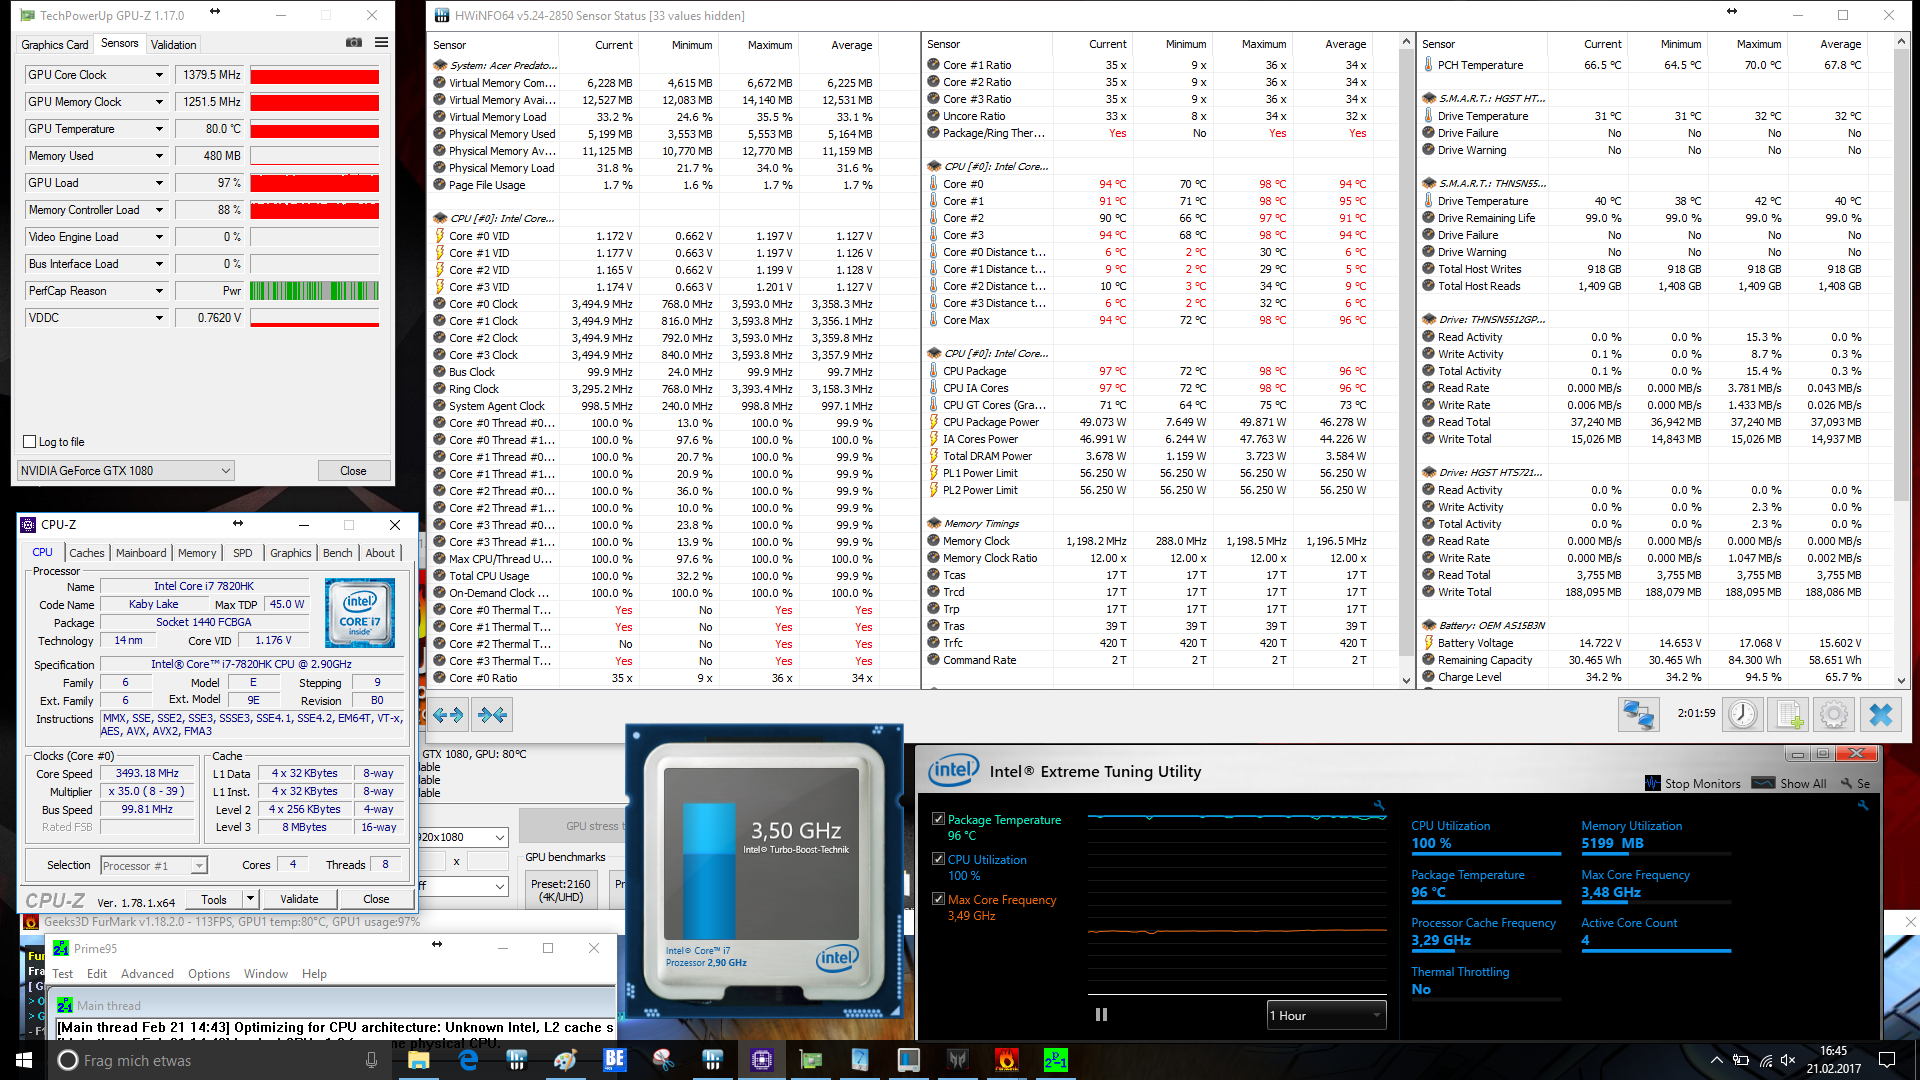
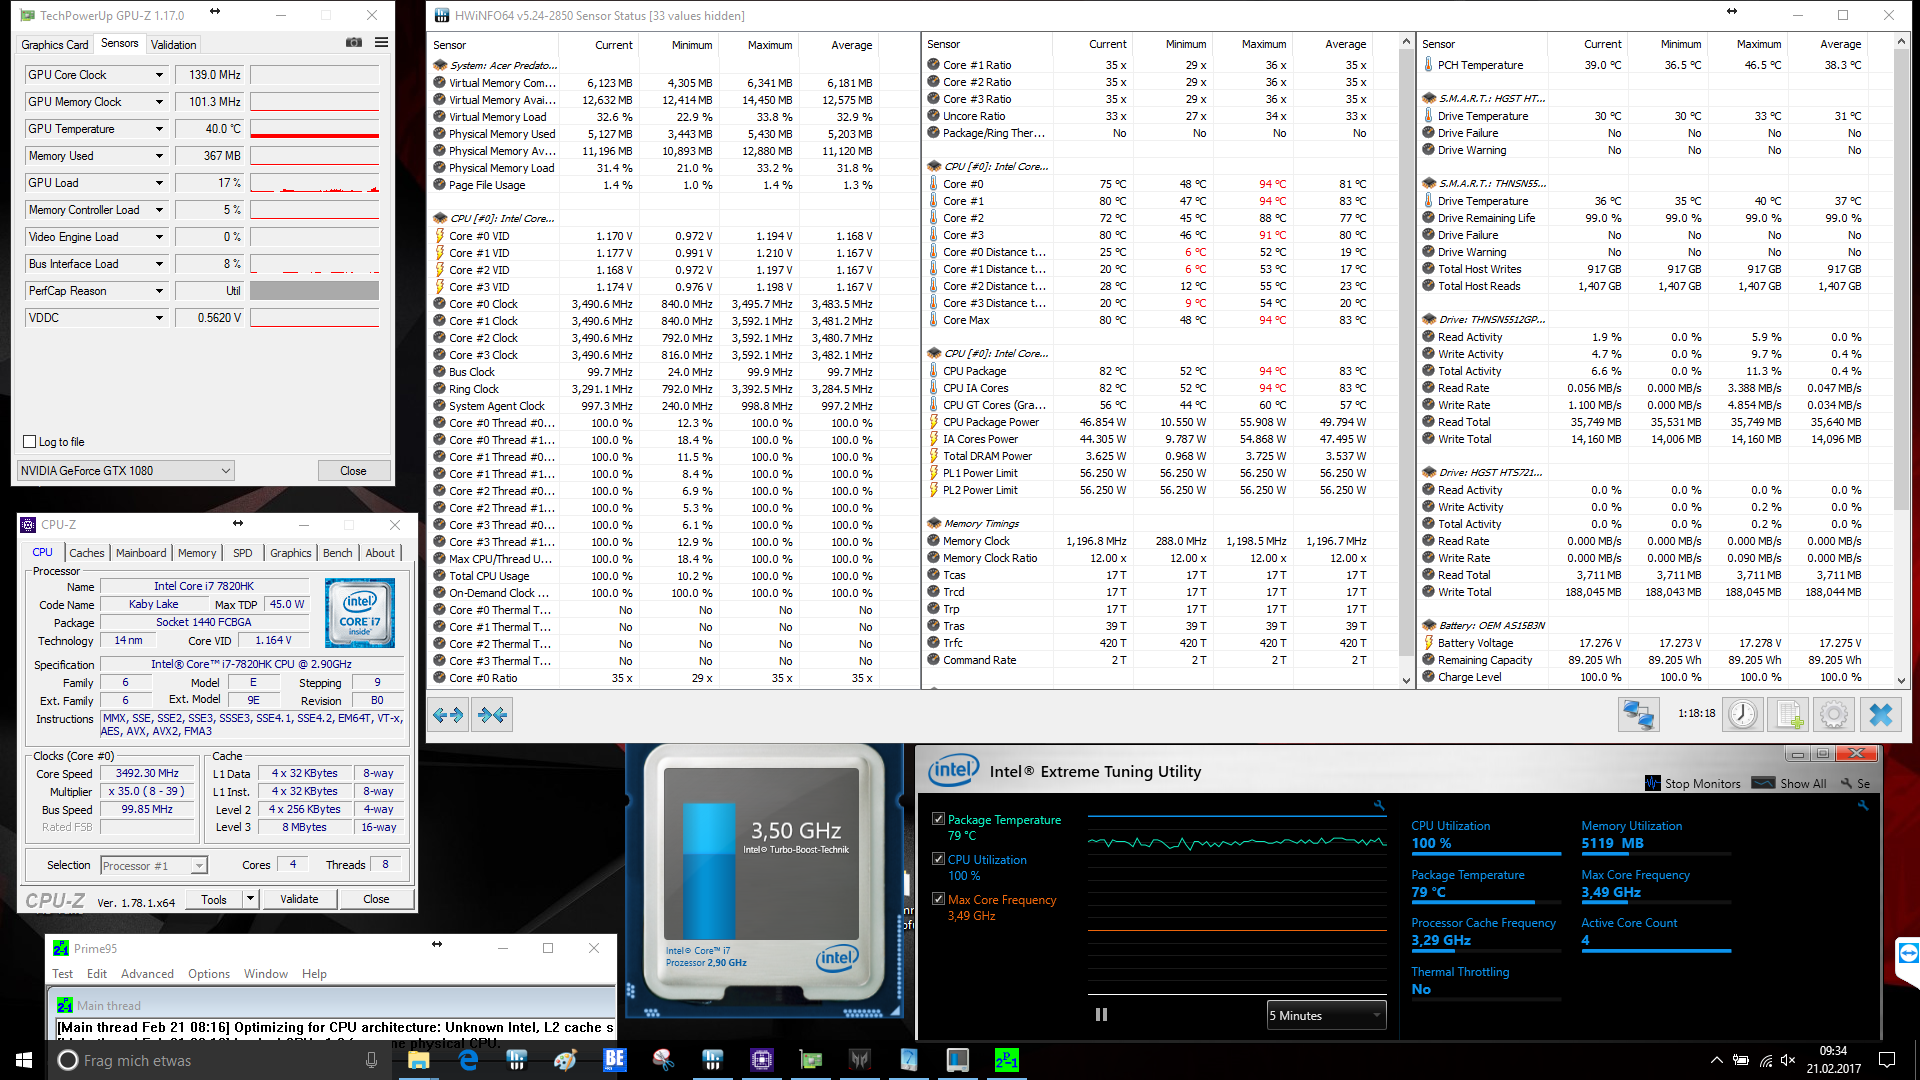
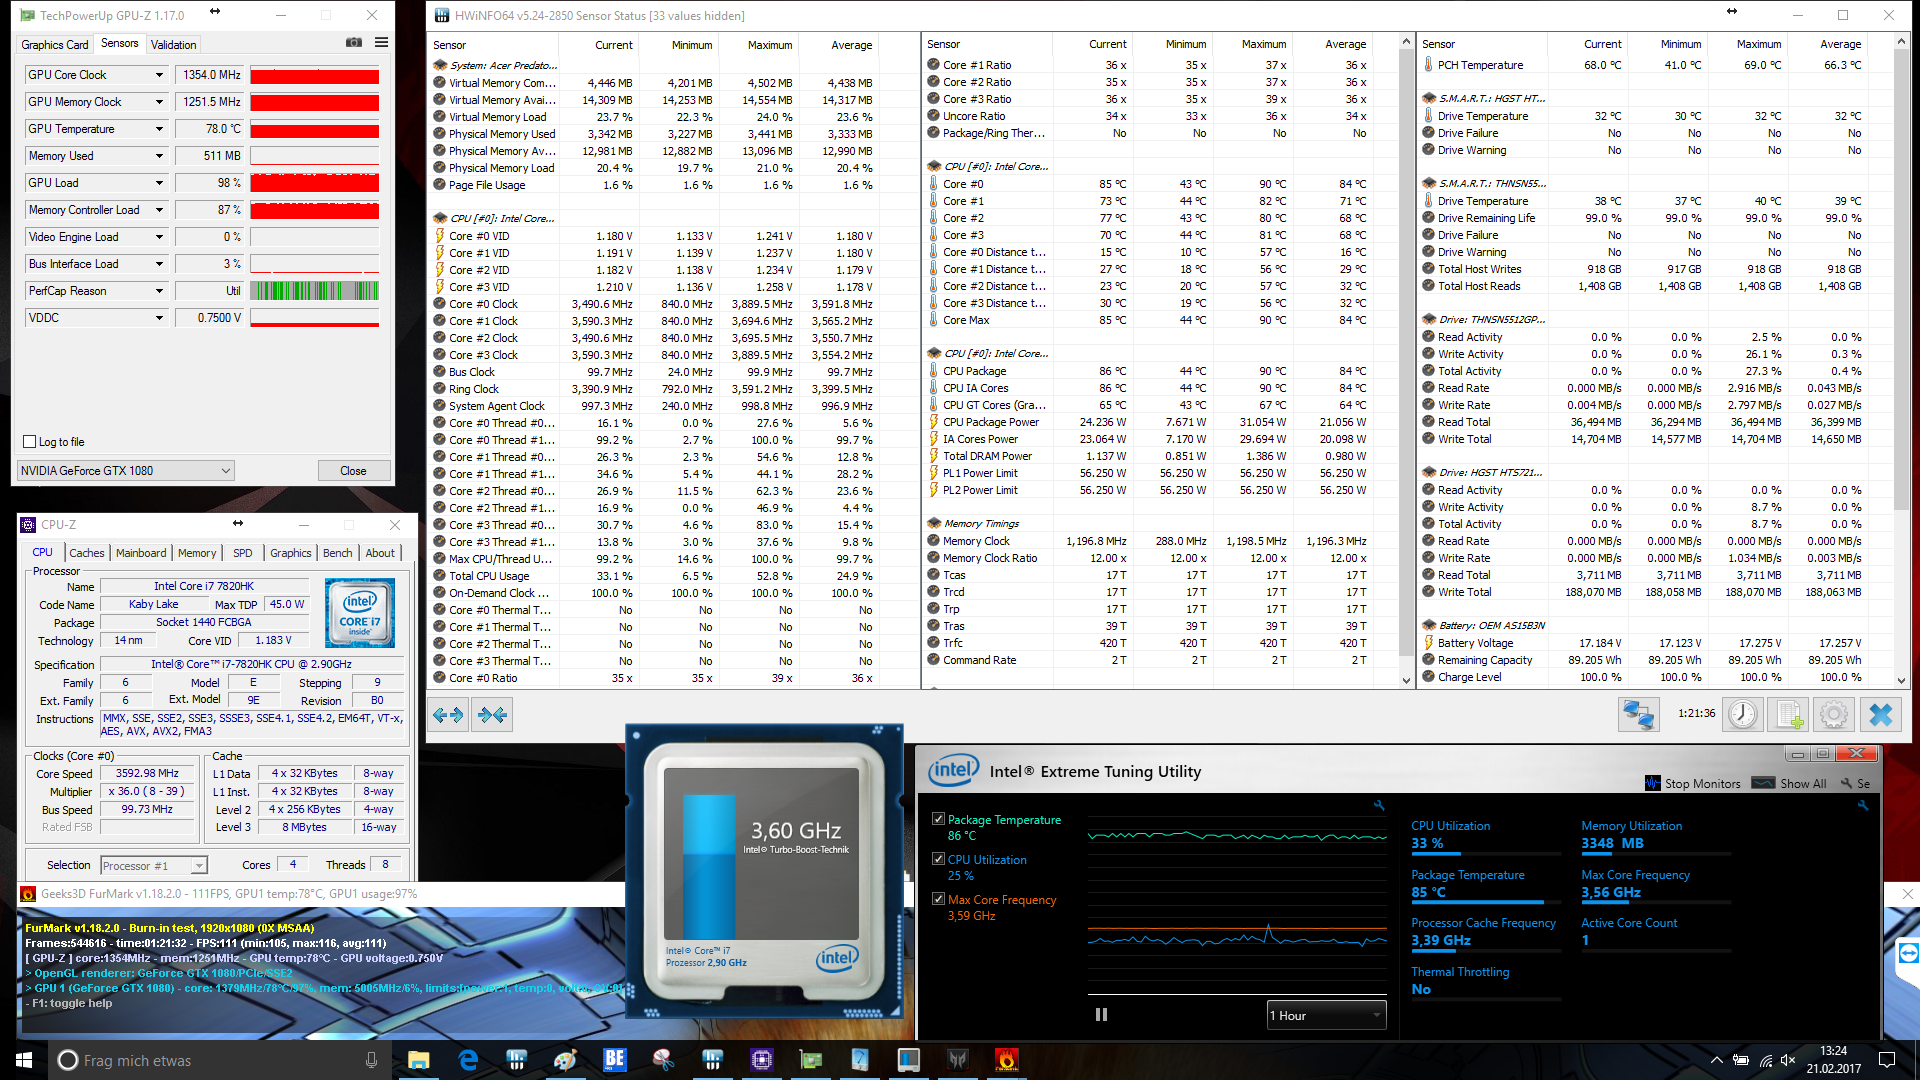
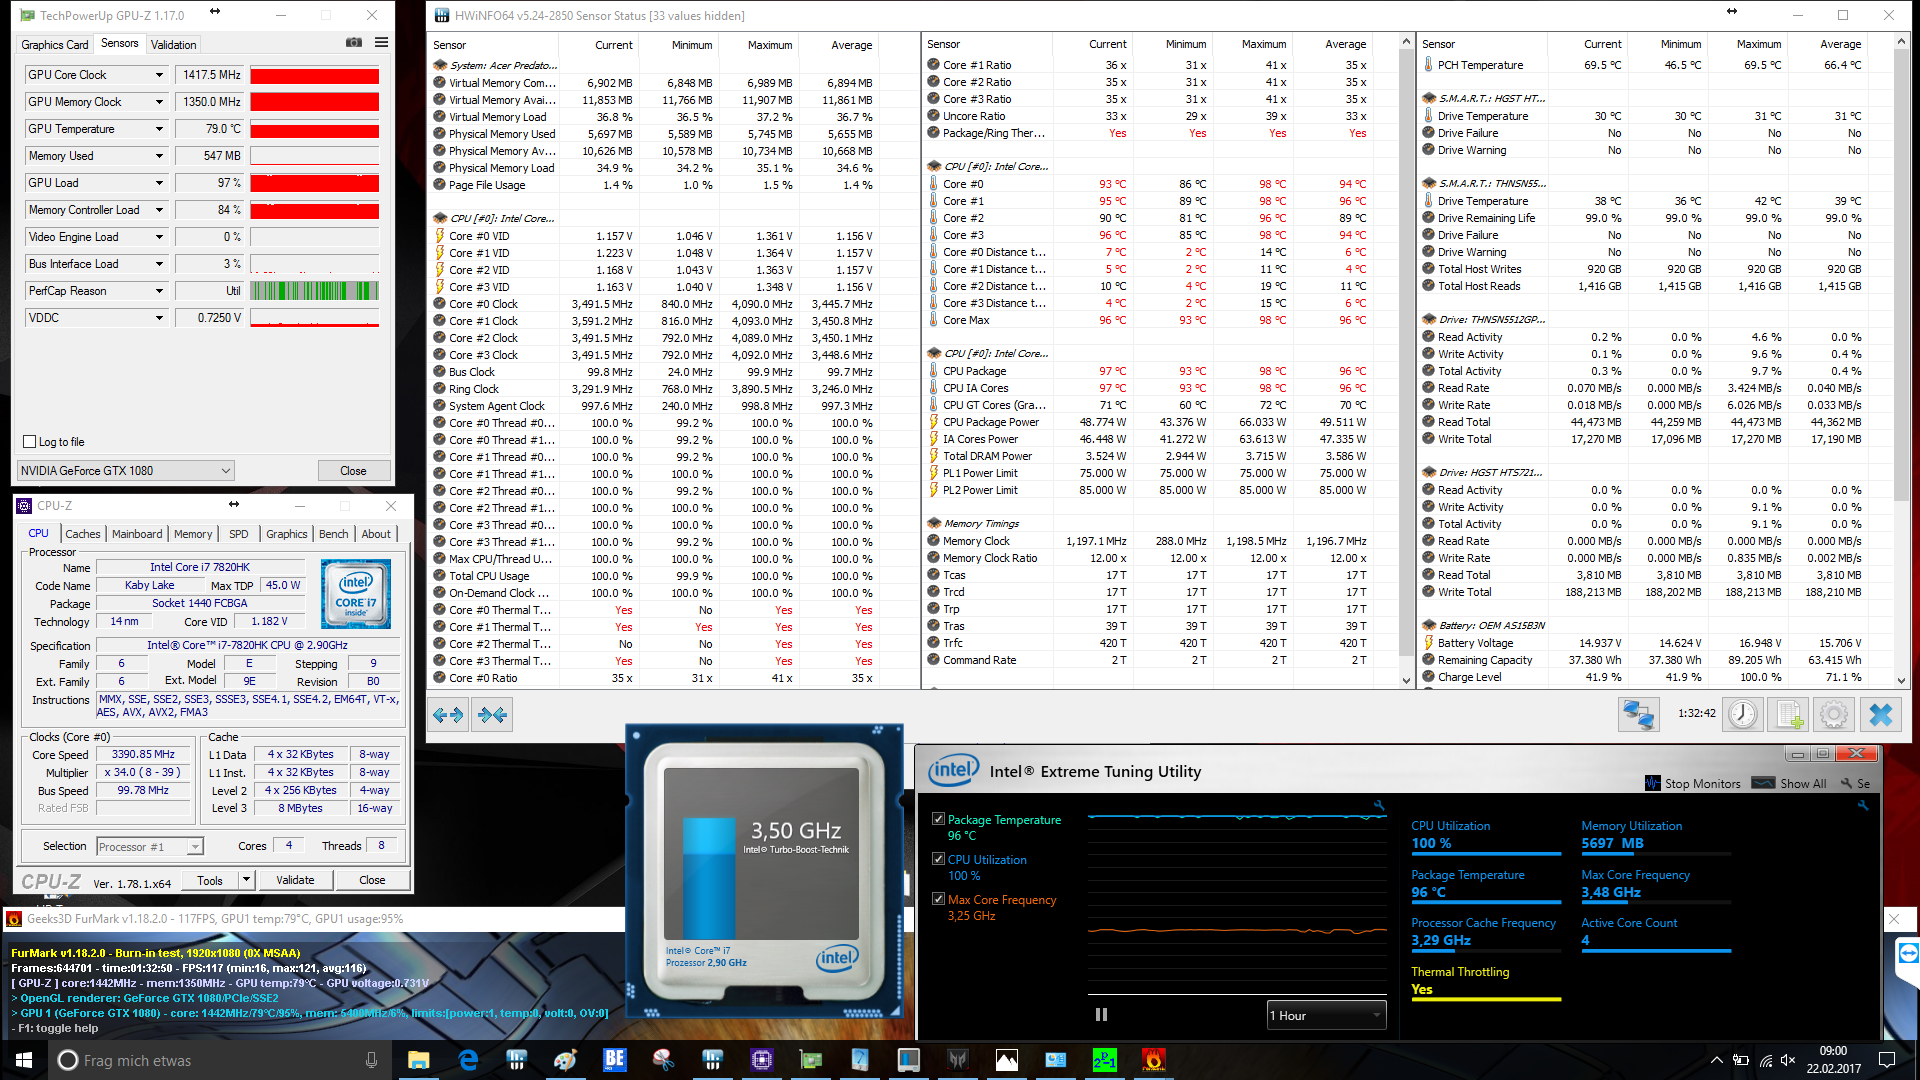
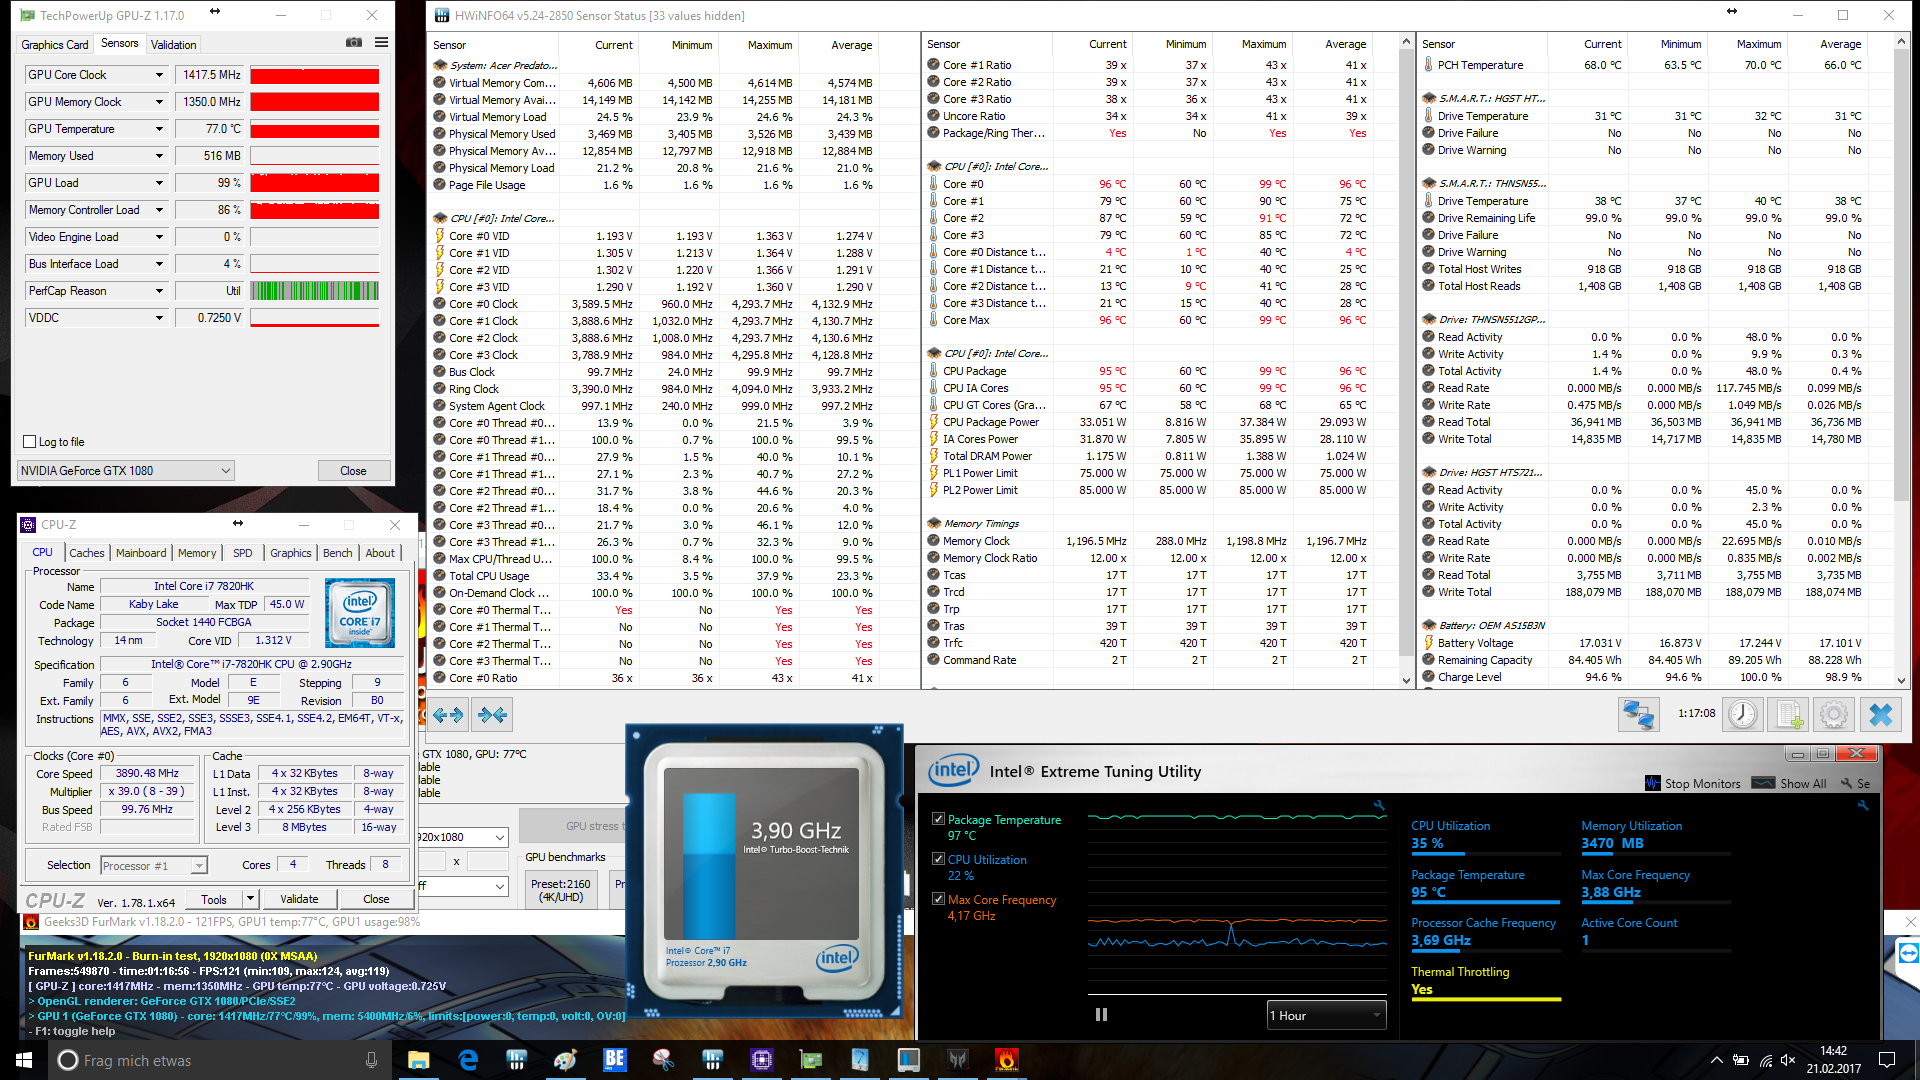
Abbiamo apprezzato i dispositivi di input e la qualità di costruzione dello chassis, ma il display lascia un'impressione mista. La luminosità è buona, ma i tempi di risposta sono alti. Un altro aspetto positivo sono le feature di overclocking, che migliorano le prestazioni in modo netto. Il processore raggiunge il suo limite termico abbastanza presto, ma le prestazioni restano comunque elevate rispetto ai settaggi di default.
Nota: si tratta di una recensione breve, con alcune sezioni non tradotte, per la versione integrale in inglese guardate qui.
Acer Predator 17 X GX-792-76DL
-
03/01/2017 v6(old)
Sebastian Bade
Pricecompare
