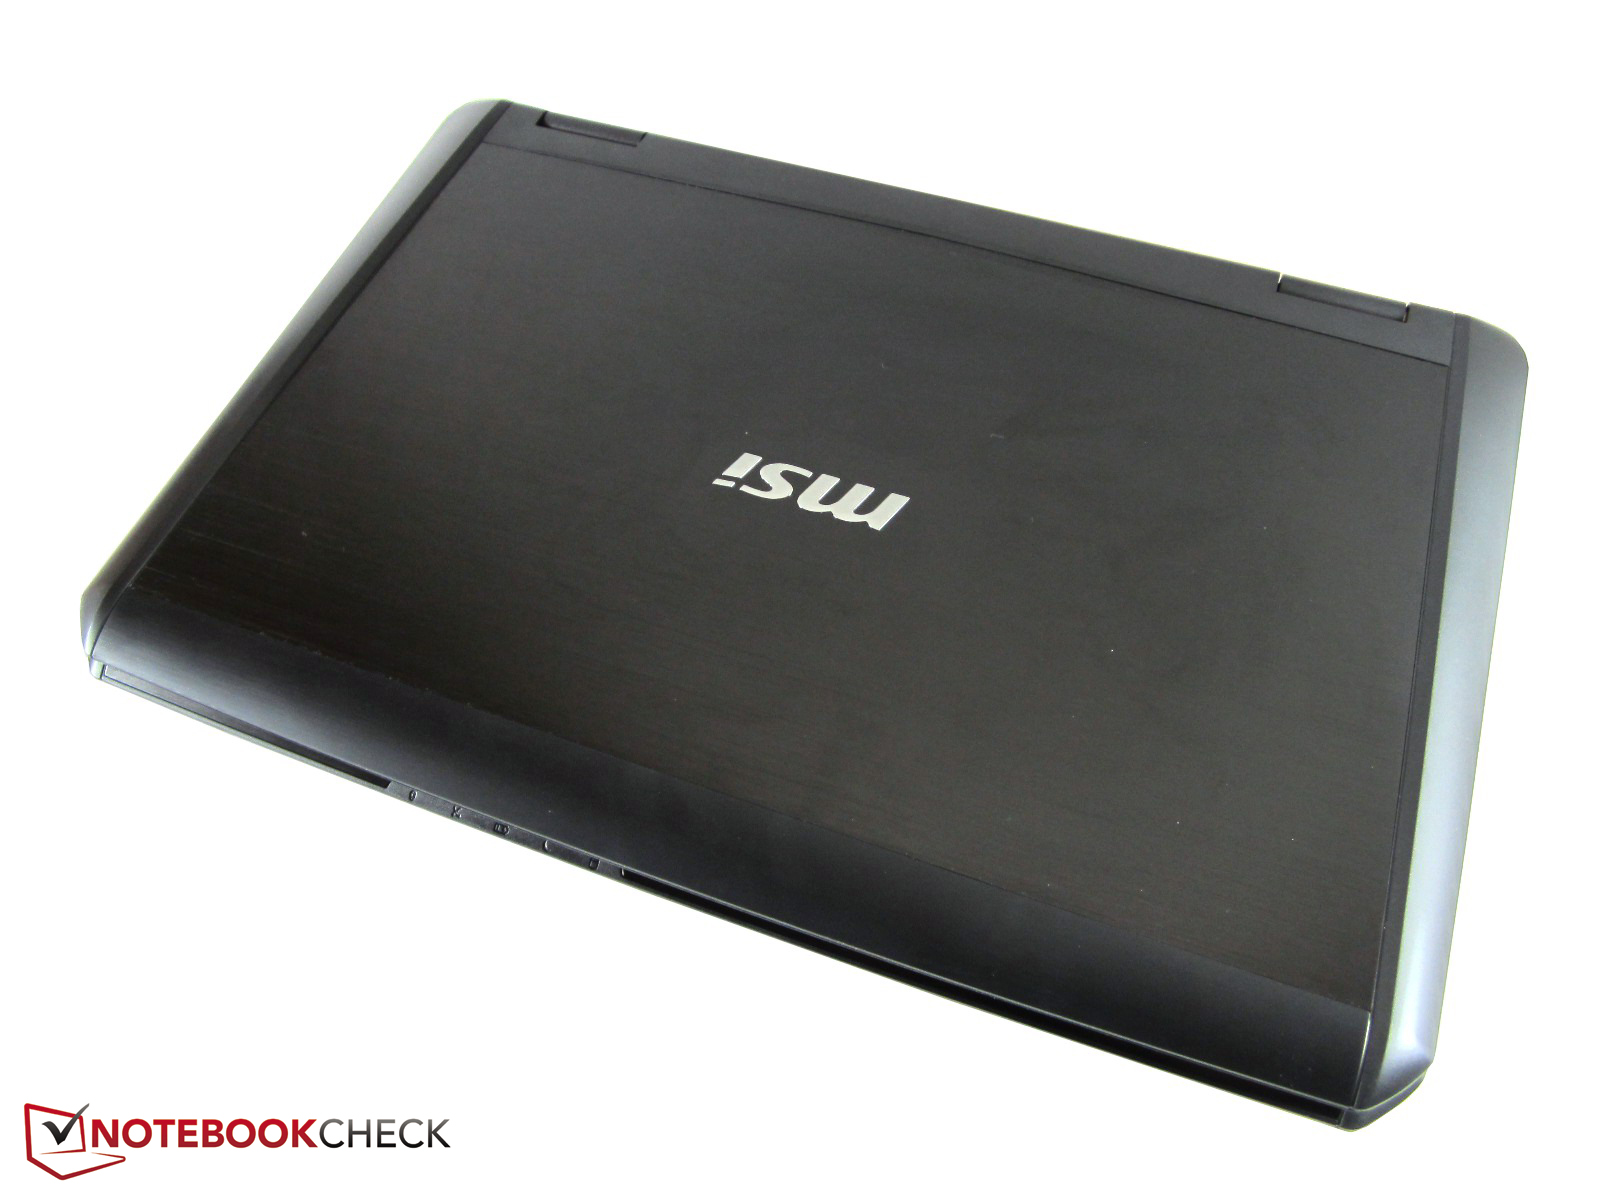
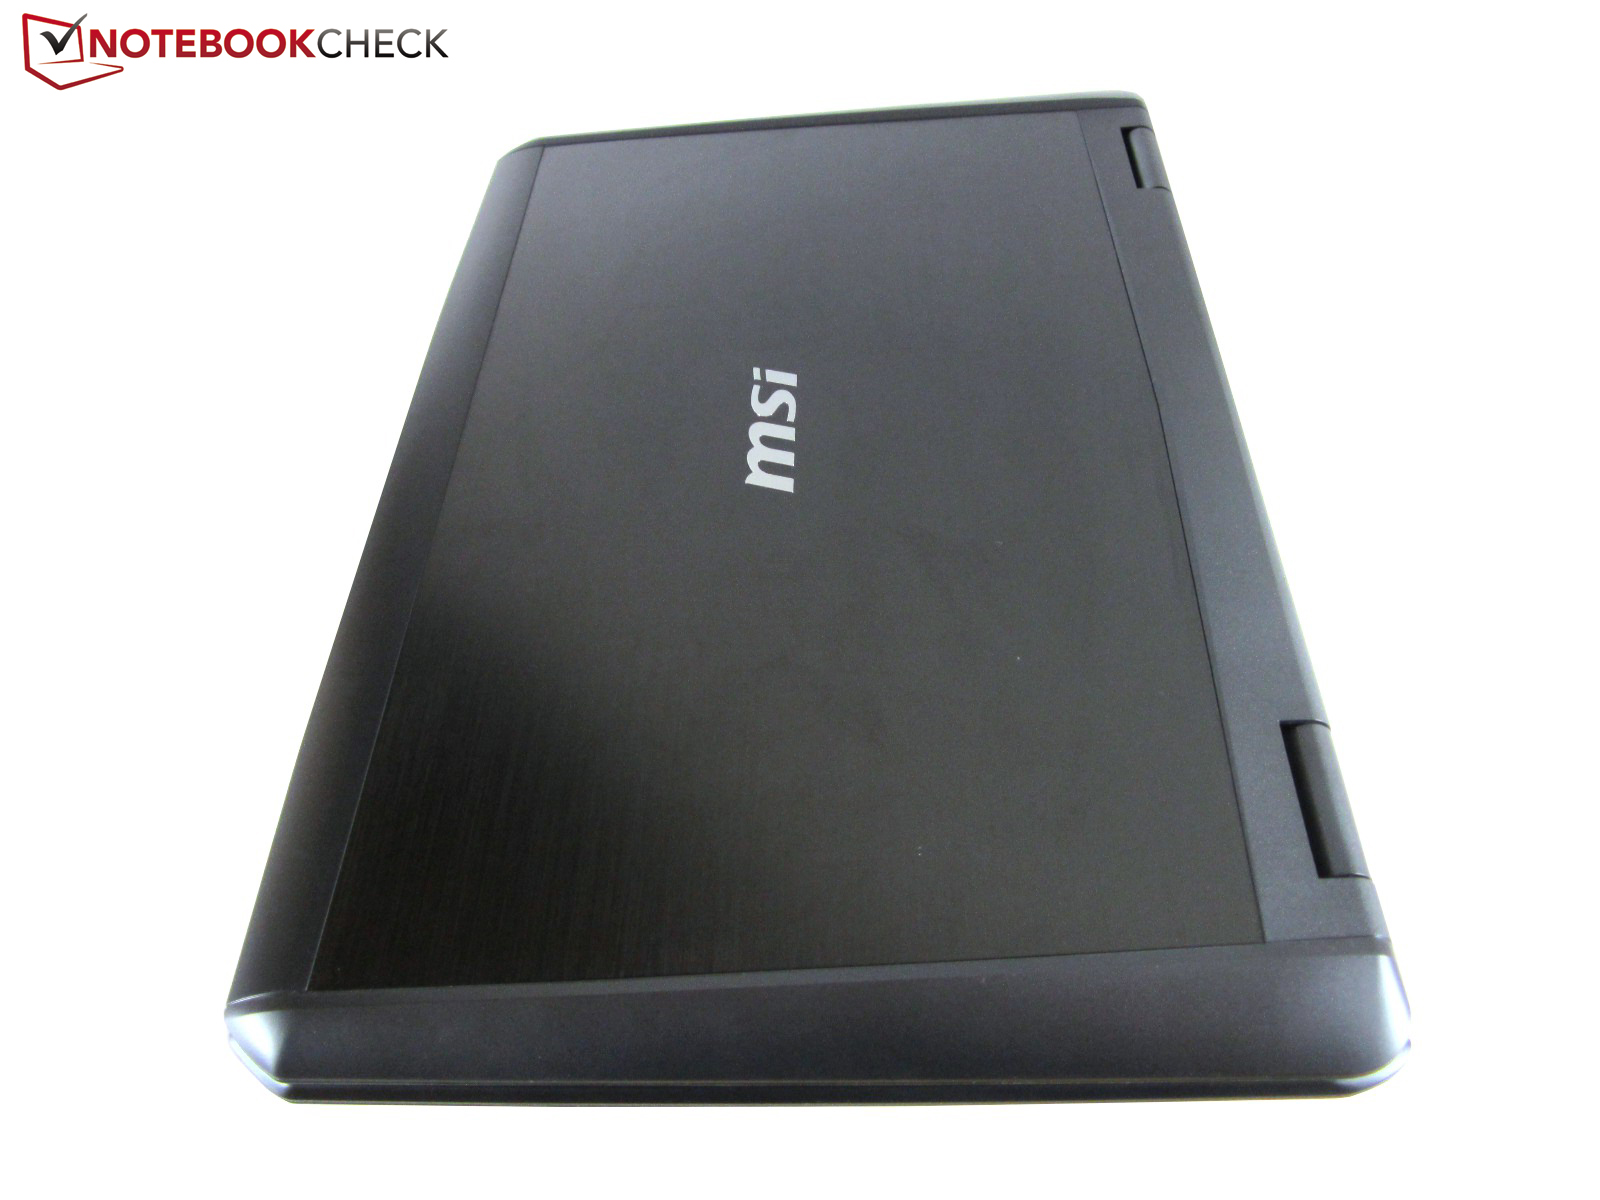
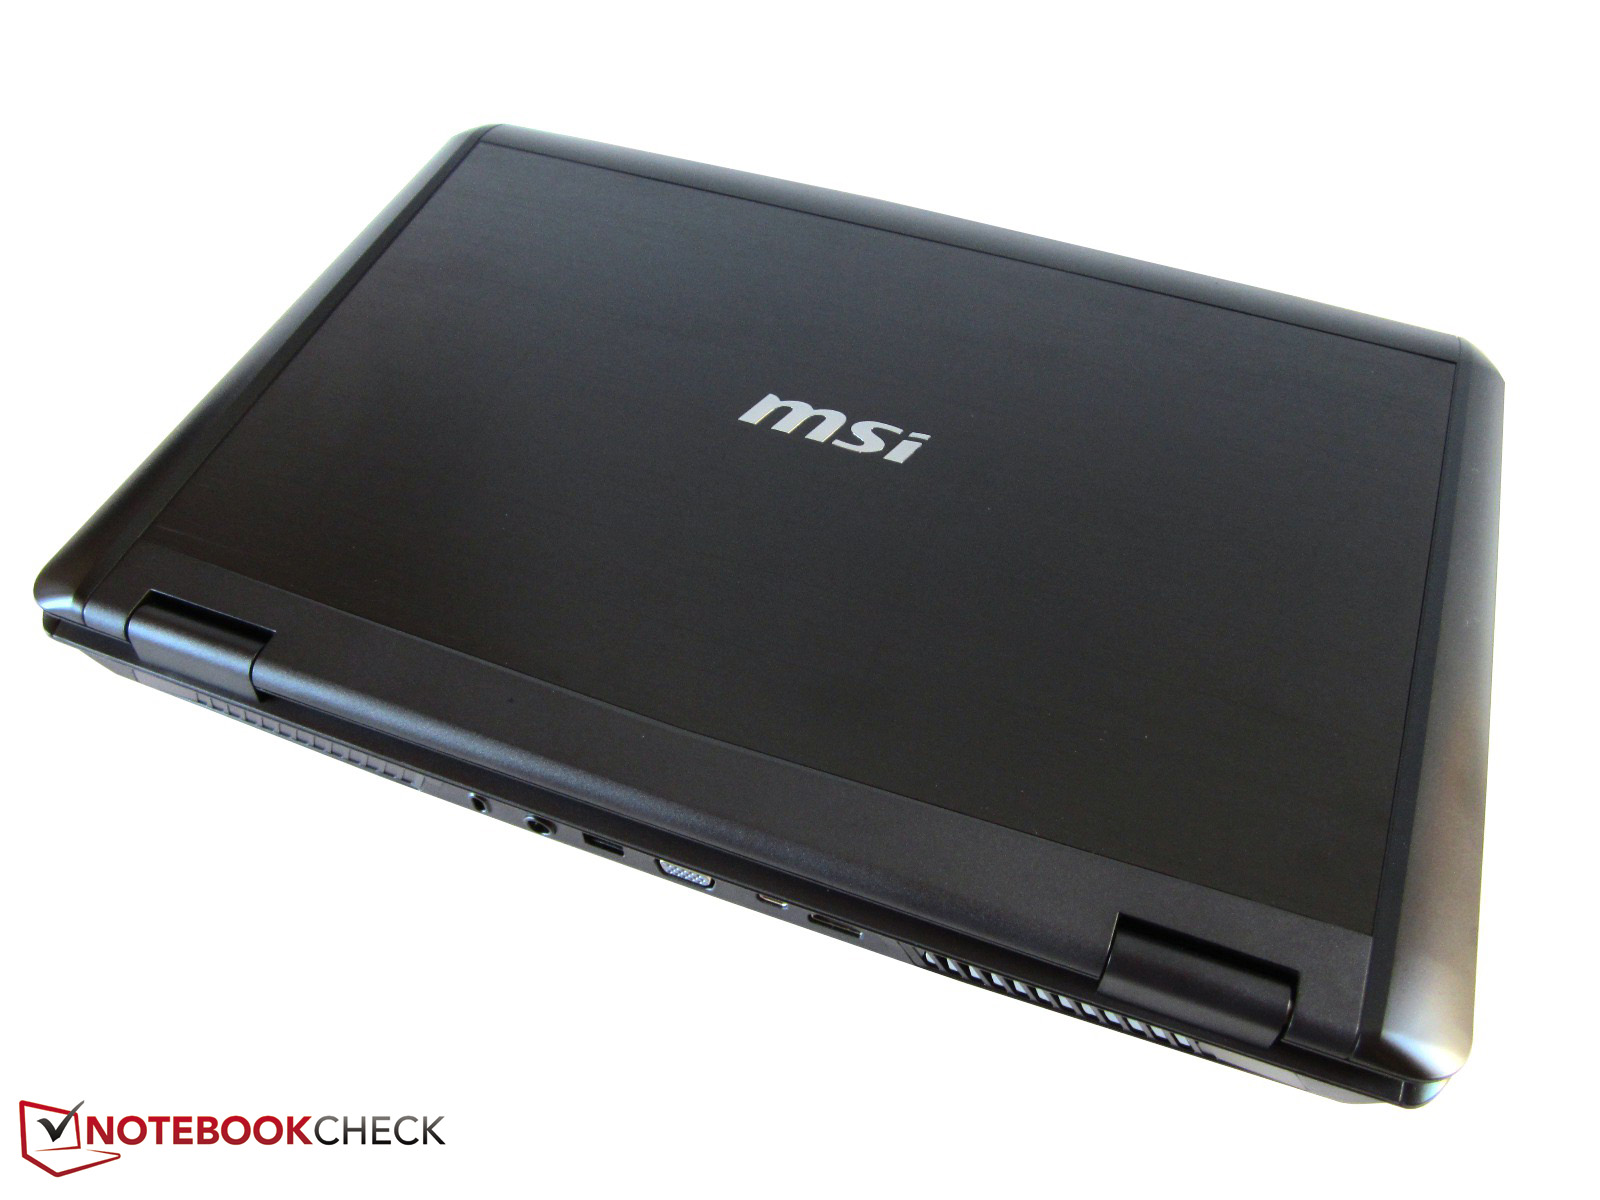
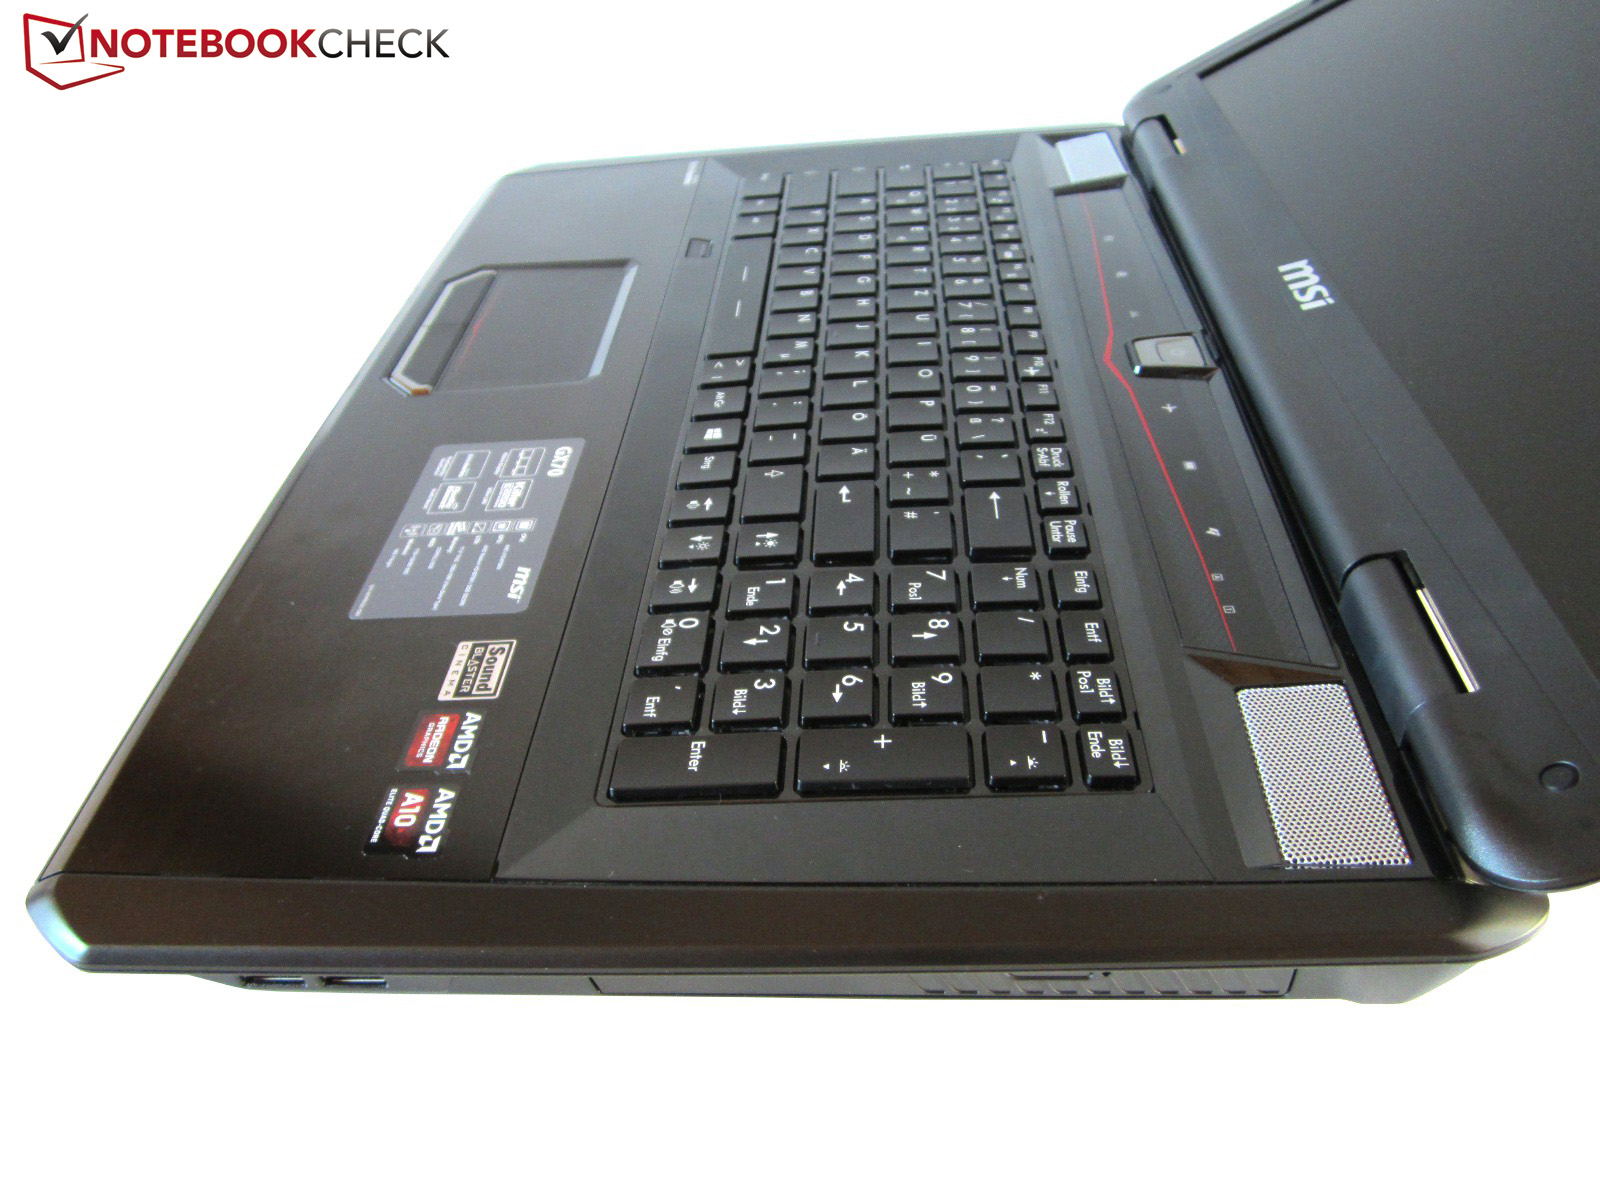
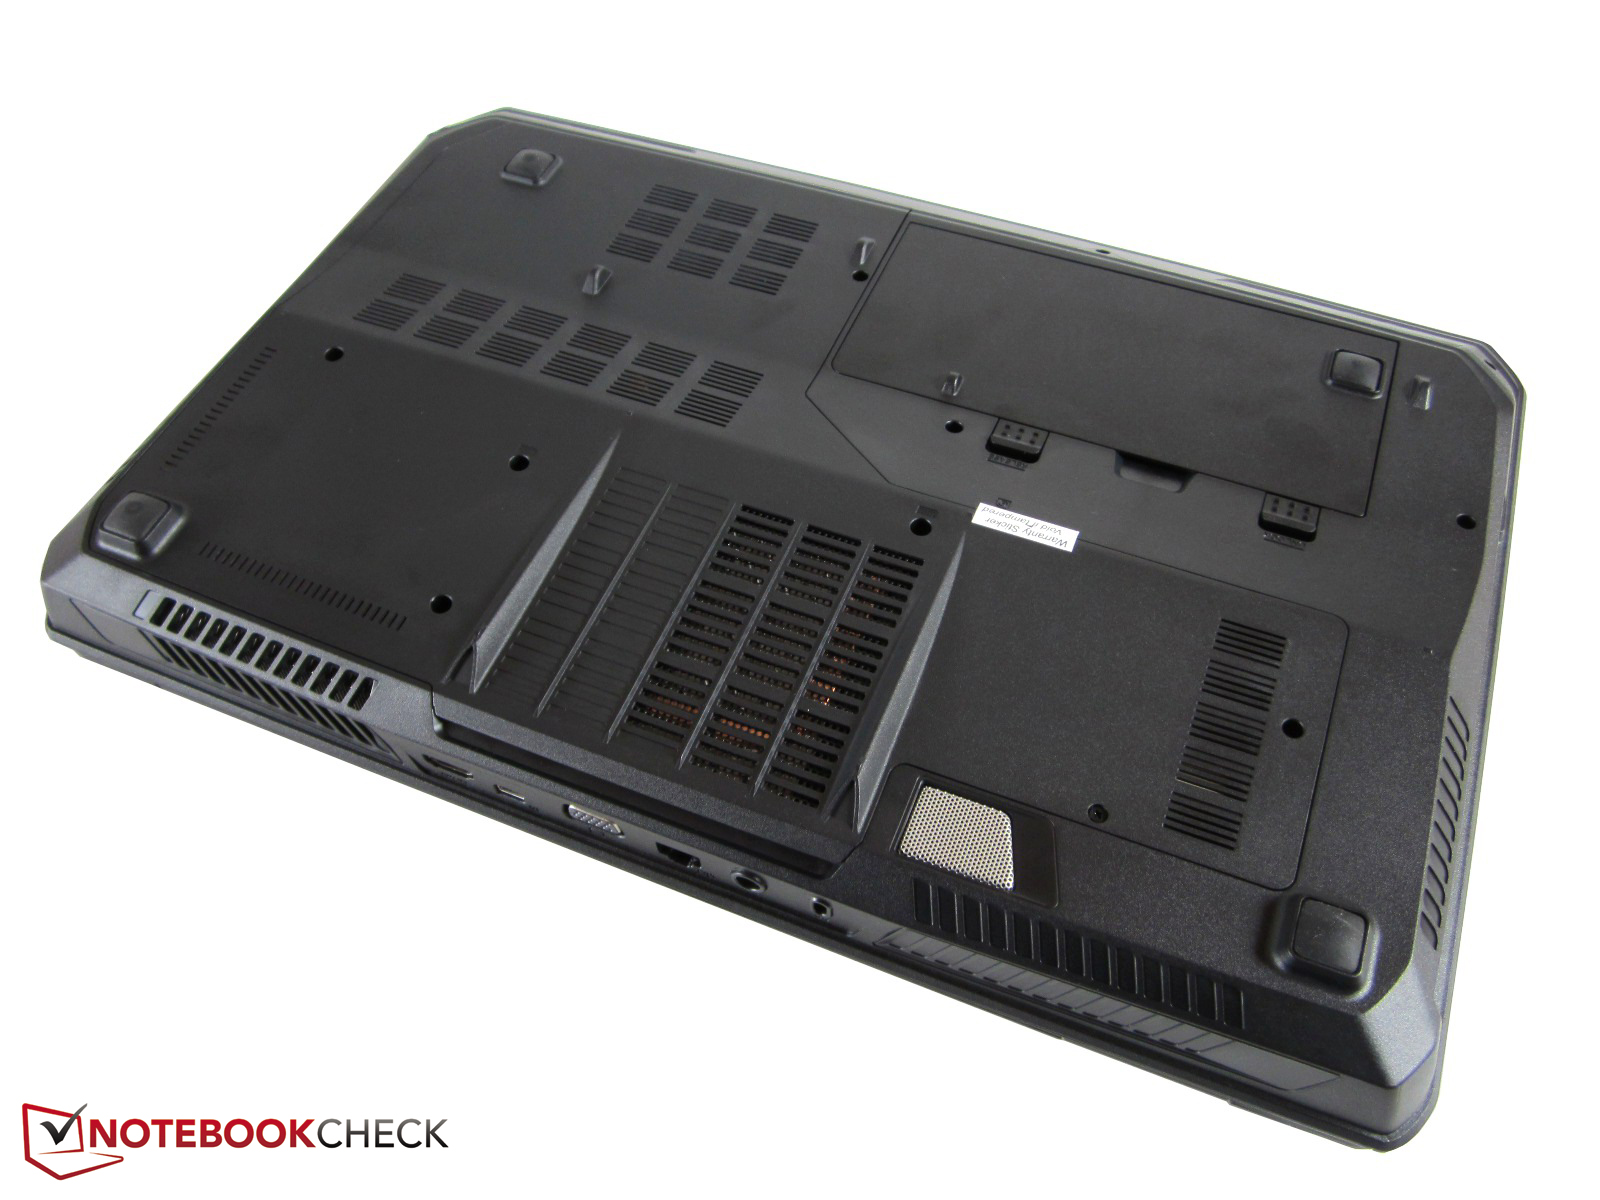
Recensione breve del portatile MSI GX70H-A108972811B
| |||||||||||||||||||||||||
Distribuzione della luminosità: 77 %
Al centro con la batteria: 330 cd/m²
Contrasto: 971:1 (Nero: 0.34 cd/m²)
ΔE ColorChecker Calman: 10.49 | ∀{0.5-29.43 Ø4.73}
ΔE Greyscale Calman: 10.75 | ∀{0.09-98 Ø4.97}
57% AdobeRGB 1998 (Argyll 1.6.3 3D)
61.6% AdobeRGB 1998 (Argyll 3D)
84.5% sRGB (Argyll 3D)
60.5% Display P3 (Argyll 3D)
Gamma: 2.54
CCT: 12789 K
| Cinebench R10 | |
| Rendering Single CPUs 64Bit (ordina per valore) | |
| AMD A10-5750M | |
| AMD A10-4600M | |
| Intel Core i7-4702MQ | |
| Intel Core i7-4700MQ | |
| Rendering Multiple CPUs 64Bit (ordina per valore) | |
| AMD A10-5750M | |
| AMD A10-4600M | |
| Intel Core i7-4702MQ | |
| Intel Core i7-4700MQ | |
| 3DMark 11 - 1280x720 Performance GPU (ordina per valore) | |
| Radeon HD 8970M (9.12.0.0) / A10-5750M | |
| Radeon HD 7970M (Cat. 12.11) / A10-4600M | |
| GeForce GTX 765M (311.27) / Core i7-4800MQ | |
| GeForce GTX 770M (311.27) / Core i7-4800MQ | |
| Radeon HD 8970M (12.103.0.0) / Core i7-4700MQ | |
| GeForce GTX 780M (311.27) / Core i7-4700MQ | |
| 3DMark Vantage - 1280x1024 P GPU no PhysX (ordina per valore) | |
| Radeon HD 8970M (9.12.0.0) / A10-5750M | |
| Radeon HD 7970M (Cat. 12.11) / A10-4600M | |
| GeForce GTX 765M (311.27) / Core i7-4800MQ | |
| GeForce GTX 770M (311.27) / Core i7-4800MQ | |
| Radeon HD 8970M (12.103.0.0) / Core i7-4700MQ | |
| GeForce GTX 780M (311.27) / Core i7-4700MQ | |
| 3DMark 06 Standard Score | 13040 punti | |
| 3DMark Vantage P Result | 13455 punti | |
| 3DMark 11 Performance | 4922 punti | |
| 3DMark Ice Storm Standard Score | 56878 punti | |
| 3DMark Cloud Gate Standard Score | 7787 punti | |
| 3DMark Fire Strike Score | 3812 punti | |
Aiuto | ||

| PCMark Vantage Result | 11467 punti | |
| PCMark 7 Score | 2782 punti | |
Aiuto | ||
| basso | medio | alto | ultra | |
|---|---|---|---|---|
| Battlefield 3 (2011) | 35.4 | 30.9 | ||
| The Elder Scrolls V: Skyrim (2011) | 38.4 | |||
| Anno 2070 (2011) | 46.1 | |||
| Alan Wake (2012) | 33.1 | |||
| Risen 2: Dark Waters (2012) | 35 | |||
| Dirt Showdown (2012) | 35 | 33.4 | ||
| Max Payne 3 (2012) | 29.3 | 30.5 | ||
| Sleeping Dogs (2012) | 37.7 | 23.4 | ||
| Counter-Strike: GO (2012) | 102.1 | |||
| Guild Wars 2 (2012) | 22.2 | 20.4 | ||
| Borderlands 2 (2012) | 47.2 | |||
| Fifa 13 (2012) | 115 | |||
| Dishonored (2012) | 73.3 | |||
| Need for Speed: Most Wanted (2012) | 28.6 | 27.2 | ||
| Call of Duty: Black Ops 2 (2012) | 60.9 | |||
| Hitman: Absolution (2012) | 21.4 | 19.7 | ||
| Assassin´s Creed III (2012) | 14.6 | 12.1 | ||
| Far Cry 3 (2012) | 32.8 | 18.7 | ||
| Dead Space 3 (2013) | 81.3 | |||
| Crysis 3 (2013) | 36.2 | 20.6 | ||
| Tomb Raider (2013) | 54.2 | |||
| BioShock Infinite (2013) | 37.4 | |||
| Metro: Last Light (2013) | 29.4 | 23.1 | ||
| GRID 2 (2013) | 37.8 | |||
| Company of Heroes 2 (2013) | 22.8 | 18.7 |
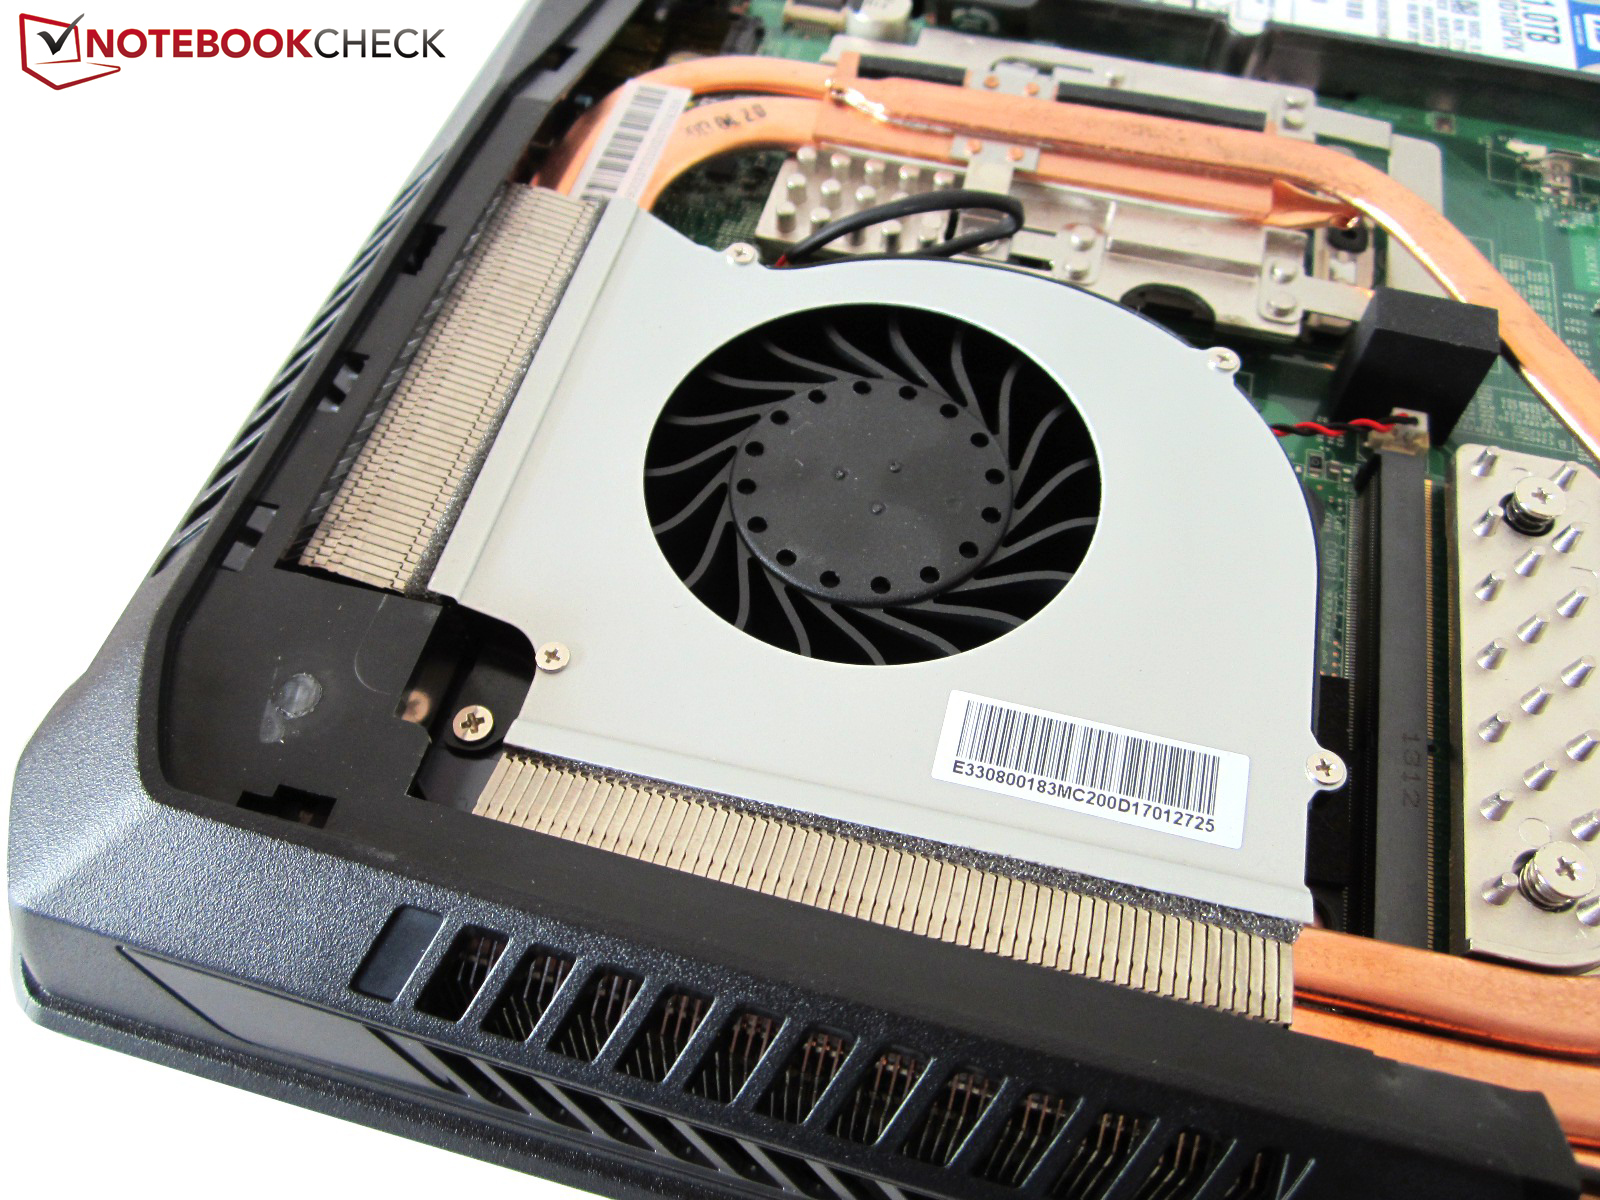
Rumorosità
| Idle |
| 32.6 / 33 / 34.2 dB(A) |
| DVD |
| 35.6 / dB(A) |
| Sotto carico |
| 43 / 51.1 dB(A) |
 | ||
30 dB silenzioso 40 dB(A) udibile 50 dB(A) rumoroso |
||
min: | ||
(-) La temperatura massima sul lato superiore è di 48.9 °C / 120 F, rispetto alla media di 40.4 °C / 105 F, che varia da 21.2 a 68.8 °C per questa classe Gaming.
(-) Il lato inferiore si riscalda fino ad un massimo di 45.2 °C / 113 F, rispetto alla media di 43.2 °C / 110 F
(+) In idle, la temperatura media del lato superiore è di 29.1 °C / 84 F, rispetto alla media deld ispositivo di 33.9 °C / 93 F.
(+) I poggiapolsi e il touchpad sono piu' freddi della temperatura della pelle con un massimo di 31.2 °C / 88.2 F e sono quindi freddi al tatto.
(-) La temperatura media della zona del palmo della mano di dispositivi simili e'stata di 28.8 °C / 83.8 F (-2.4 °C / -4.4 F).
| Off / Standby | |
| Idle | |
| Sotto carico |
|
Leggenda:
min: | |
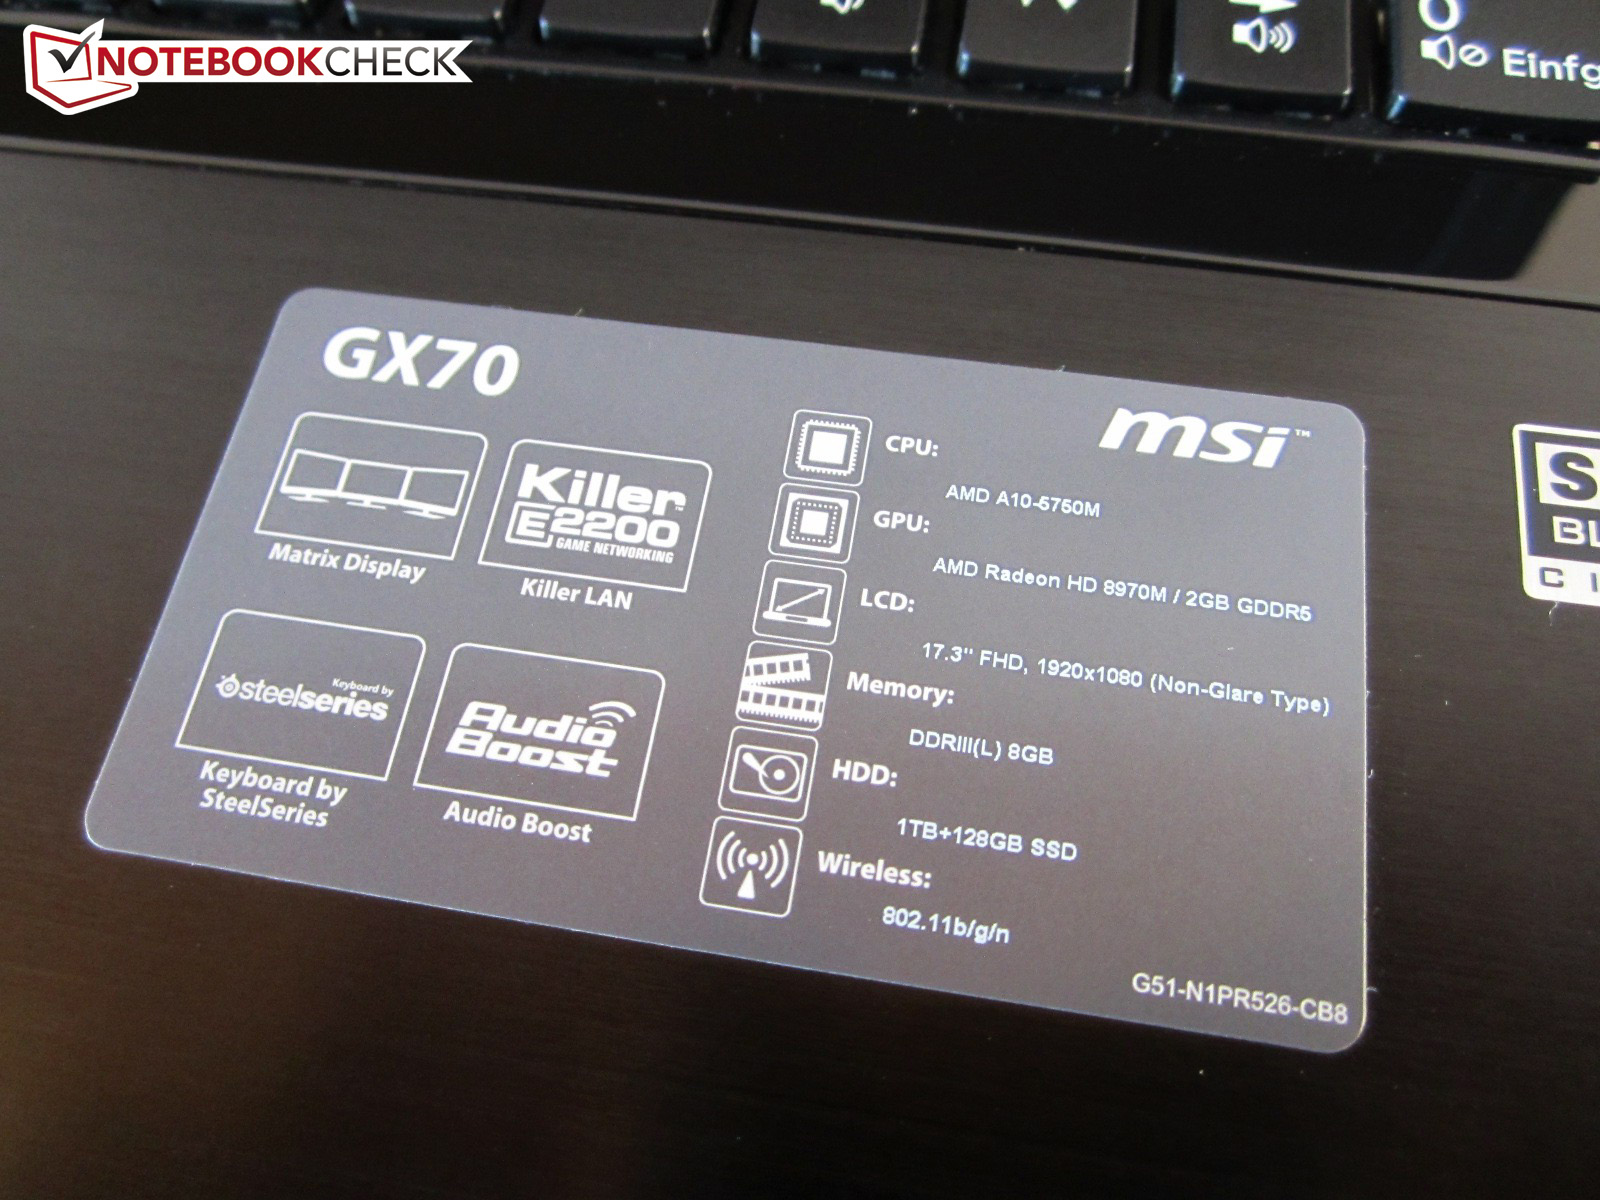
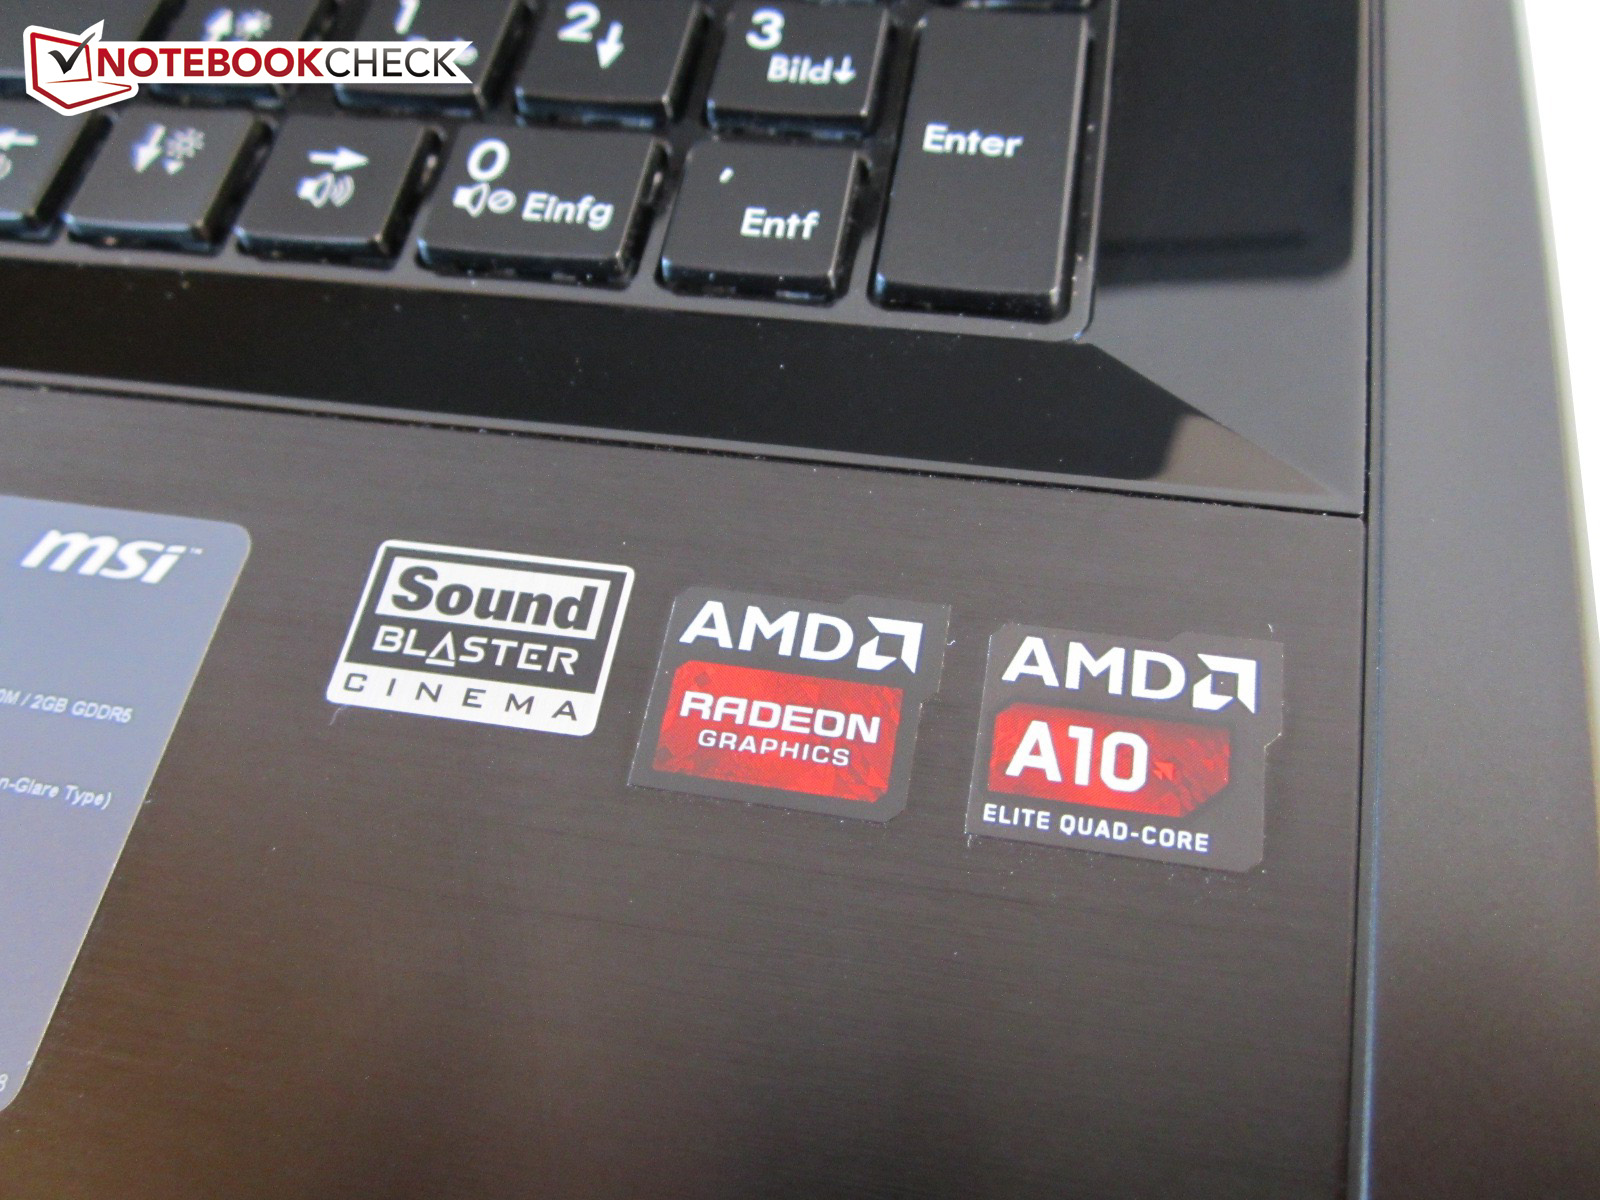
La nostra recensione evidenzia che il GX70 non è in grado di sfruttare tutto il suo potenziale. Non si può parlare in pieno di un sistema bilanciato quando una scheda grafica high-end perde circa il 50% delle prestazioni a causa del processore. I processori Intel Core i sono significativamente più veloci rispetto all'AMD A10-5750M, e nemmeno la GPU più veloce riesce a cambiare questa situazione.
MSI dovrebbe in definitiva riconsiderare questo concetto ed utilizzare processori Intel. Combinando una Radeon HD 8970M con un processore così debole non ha molto senso a nostro parere. Uno sguardo a qualche gioco (Assassin's Creed III, Hitman: Absolution, Guild Wars 2) genera dubbi sil fatto che il dispositivo sia realmente in grado di affrontare il futuro; anche settaggi grafici ridotti (high) non generano un frame rate giocabile a causa della CPU. La Nvidia GTX 765M, ad esempio non ha questi problemi se combinata con una CPU quad-core Intel. Avere dei benefici si alcuni giochi a spese dei titoli più recenti.
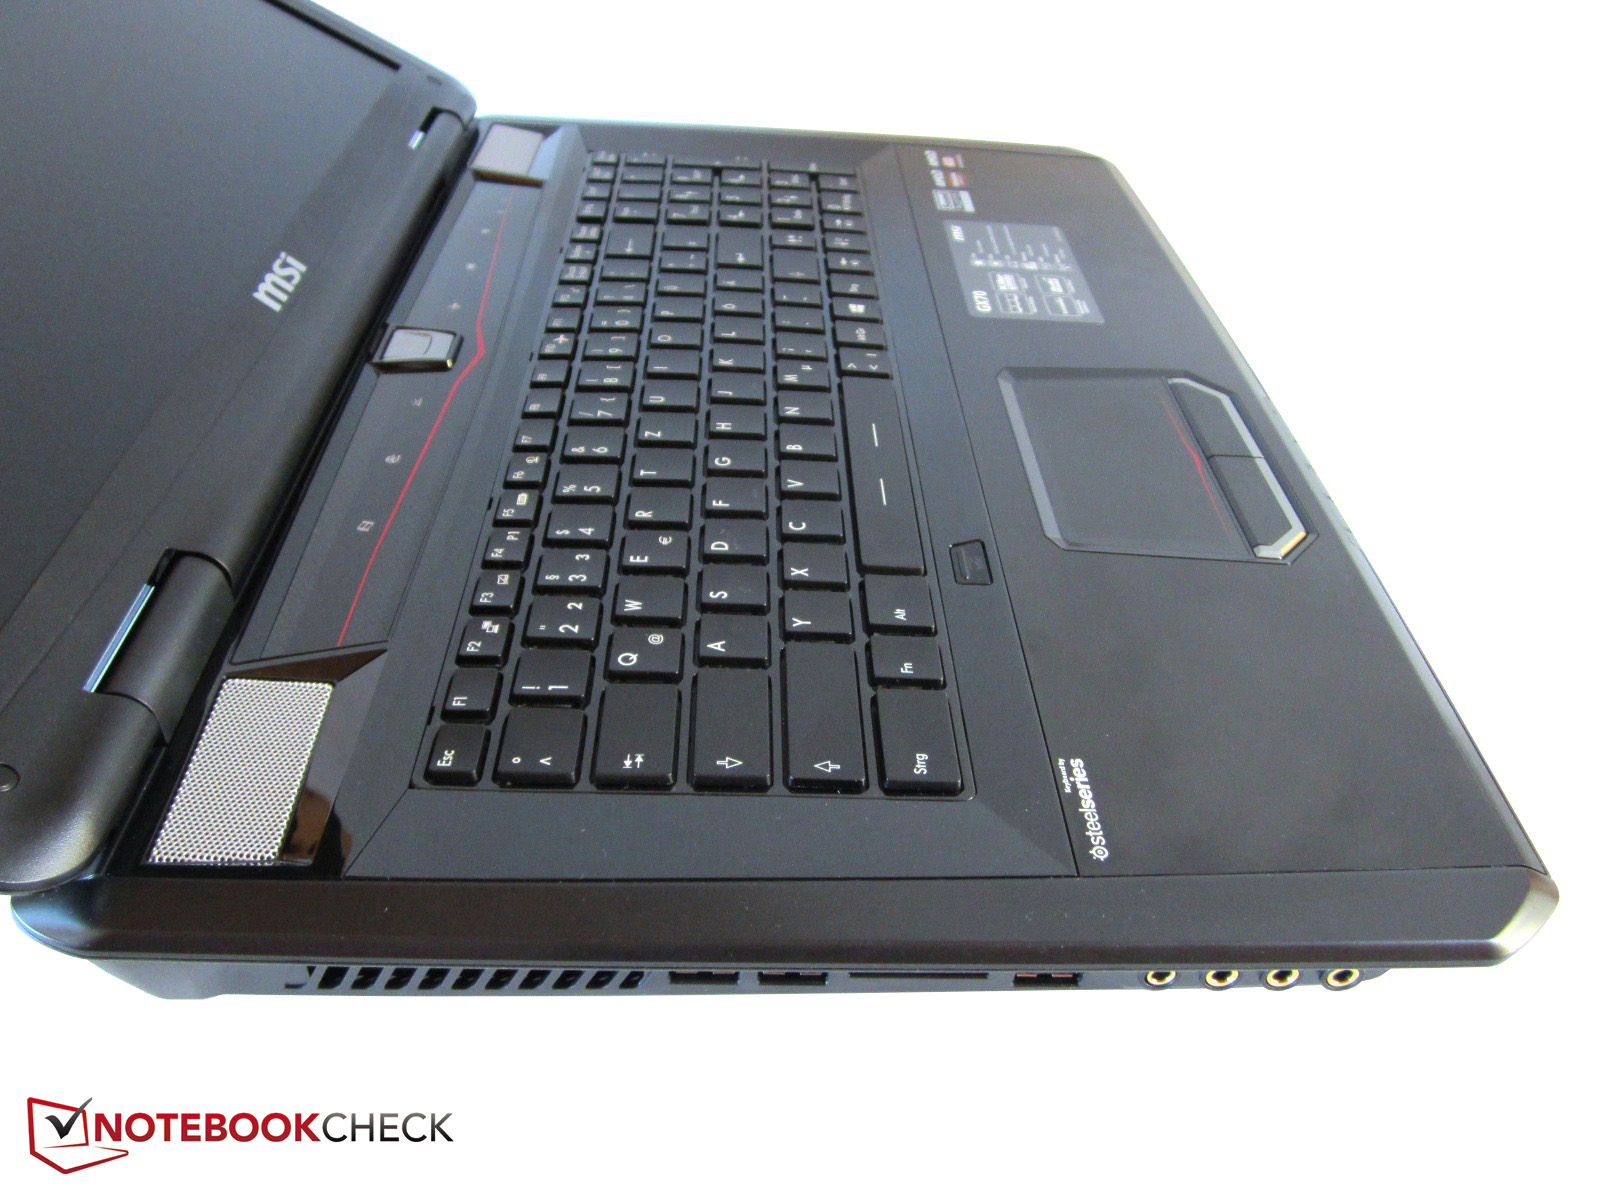
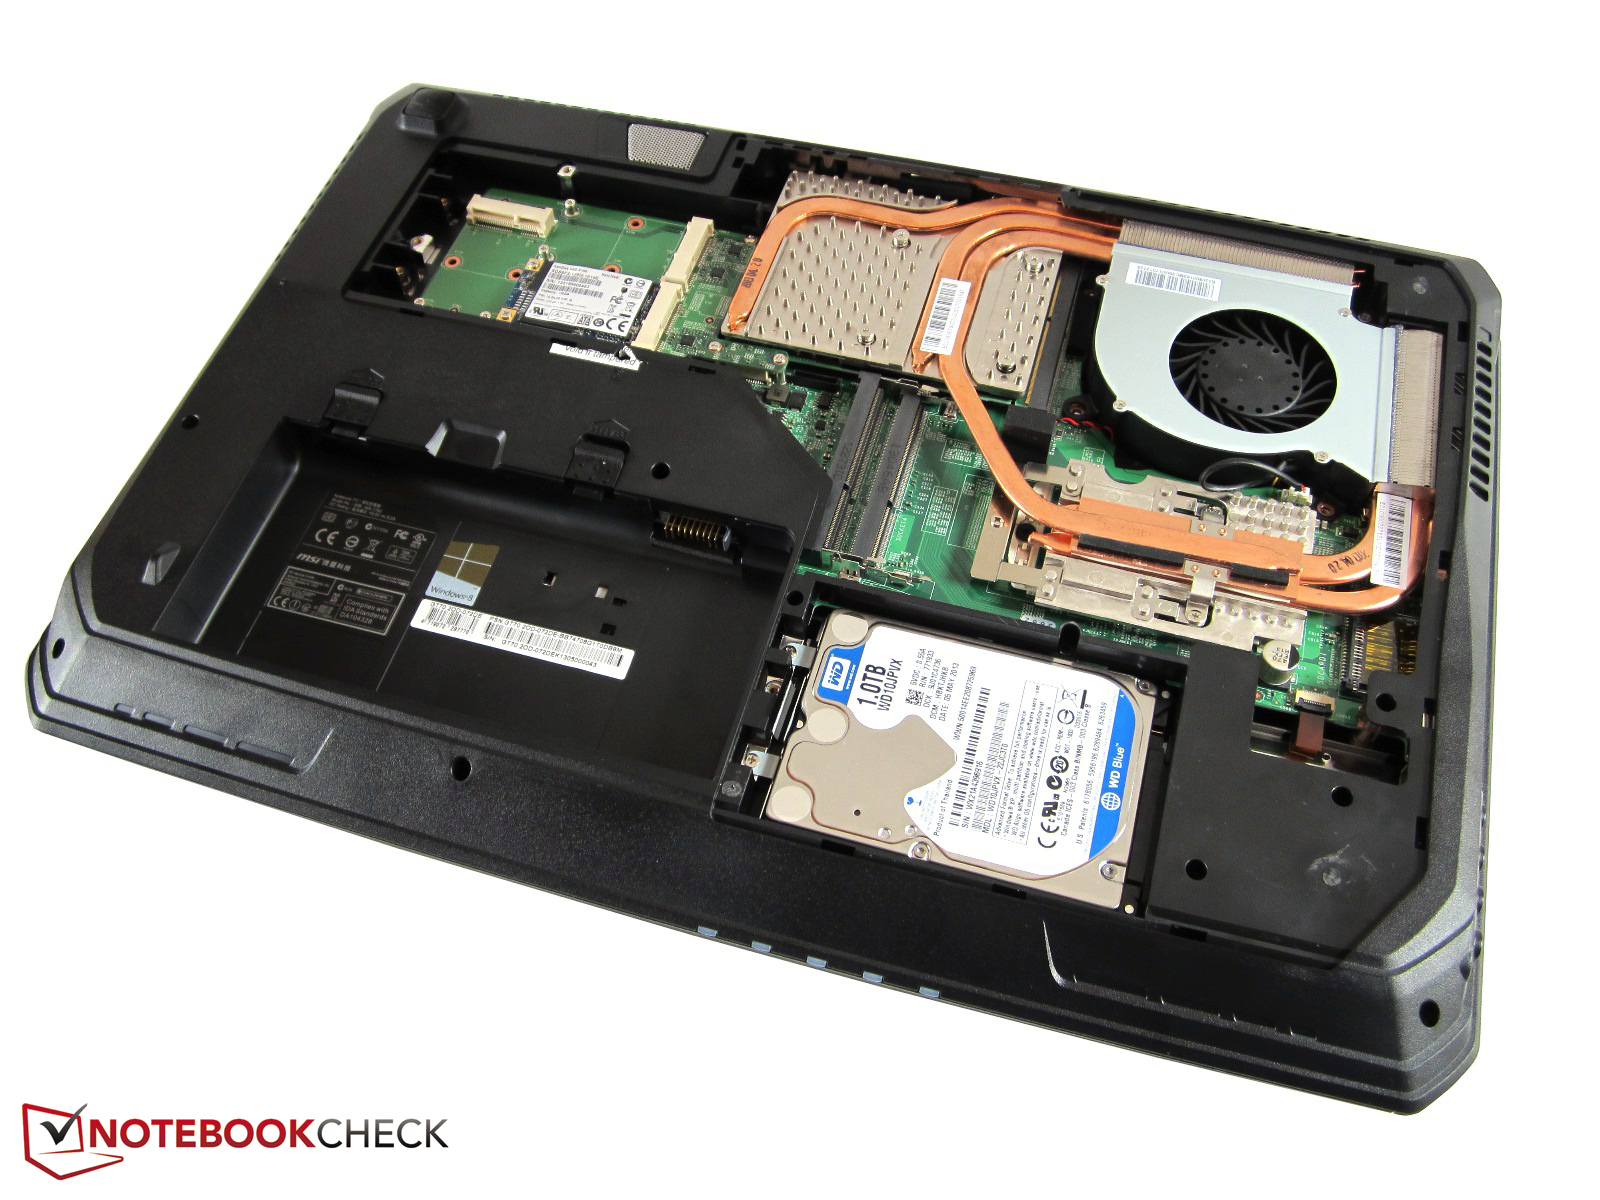
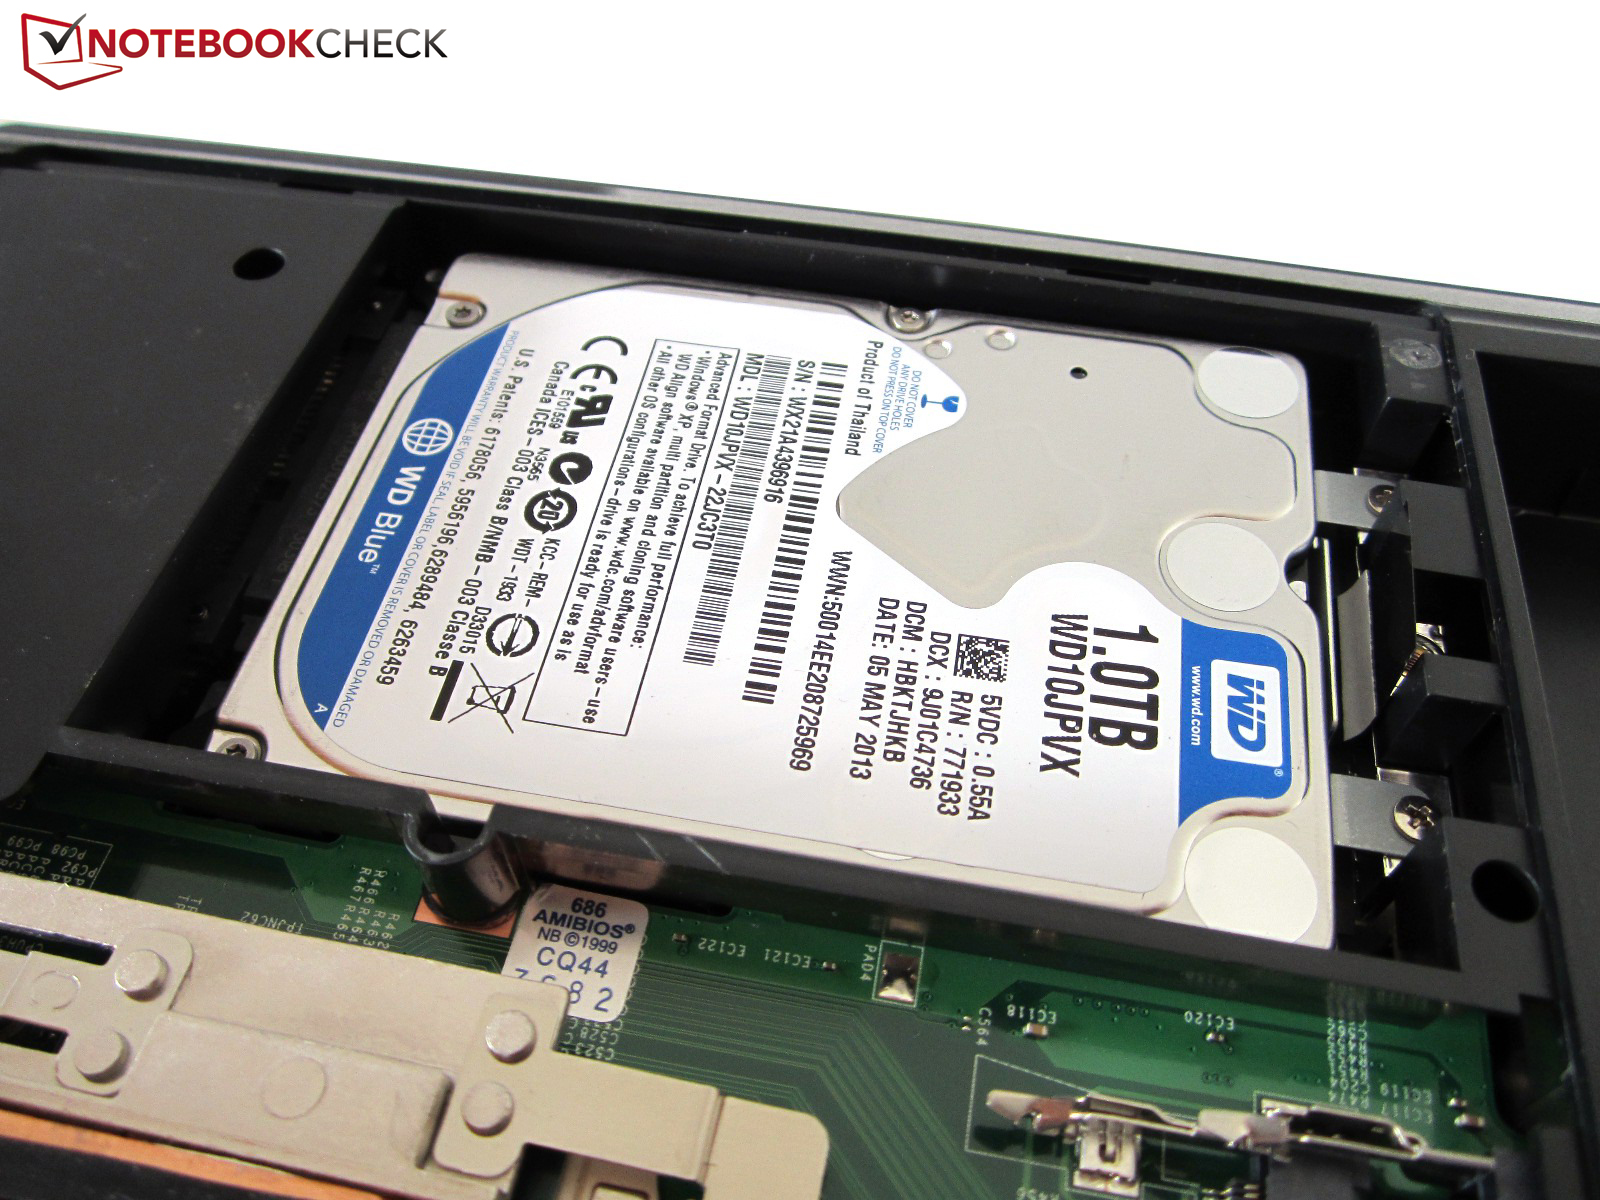
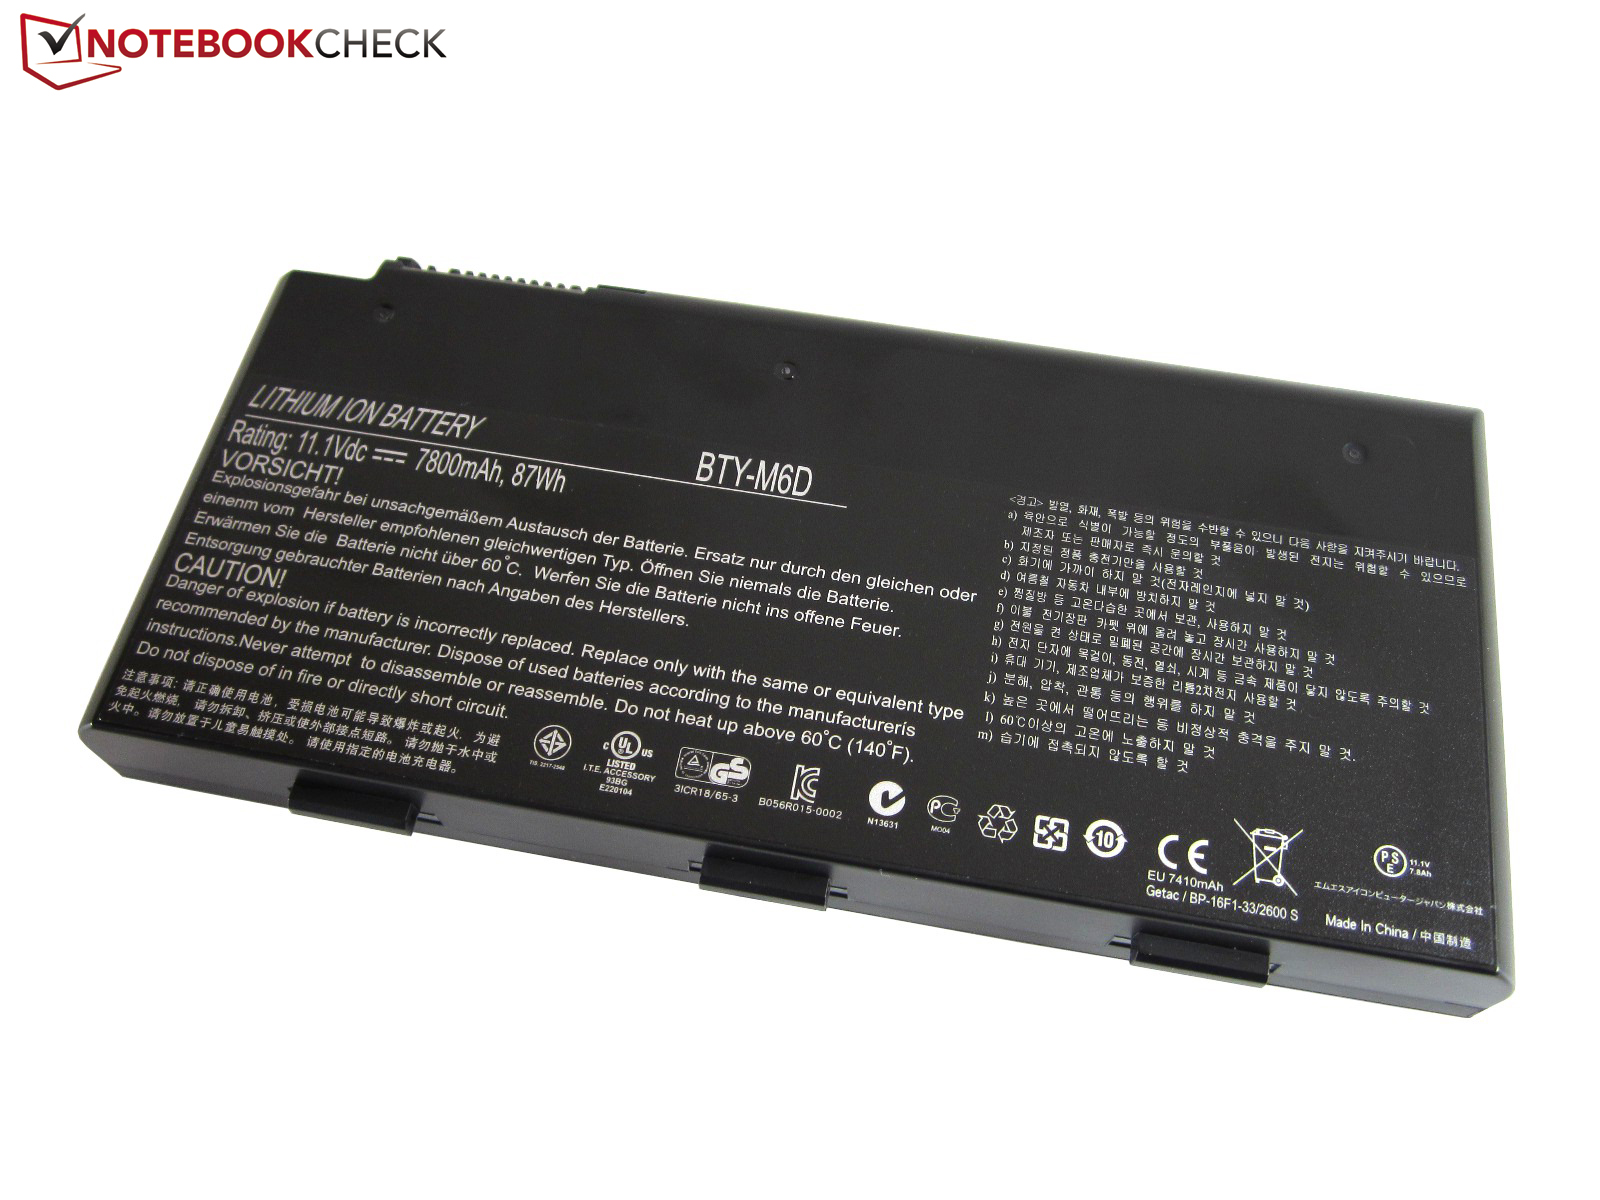
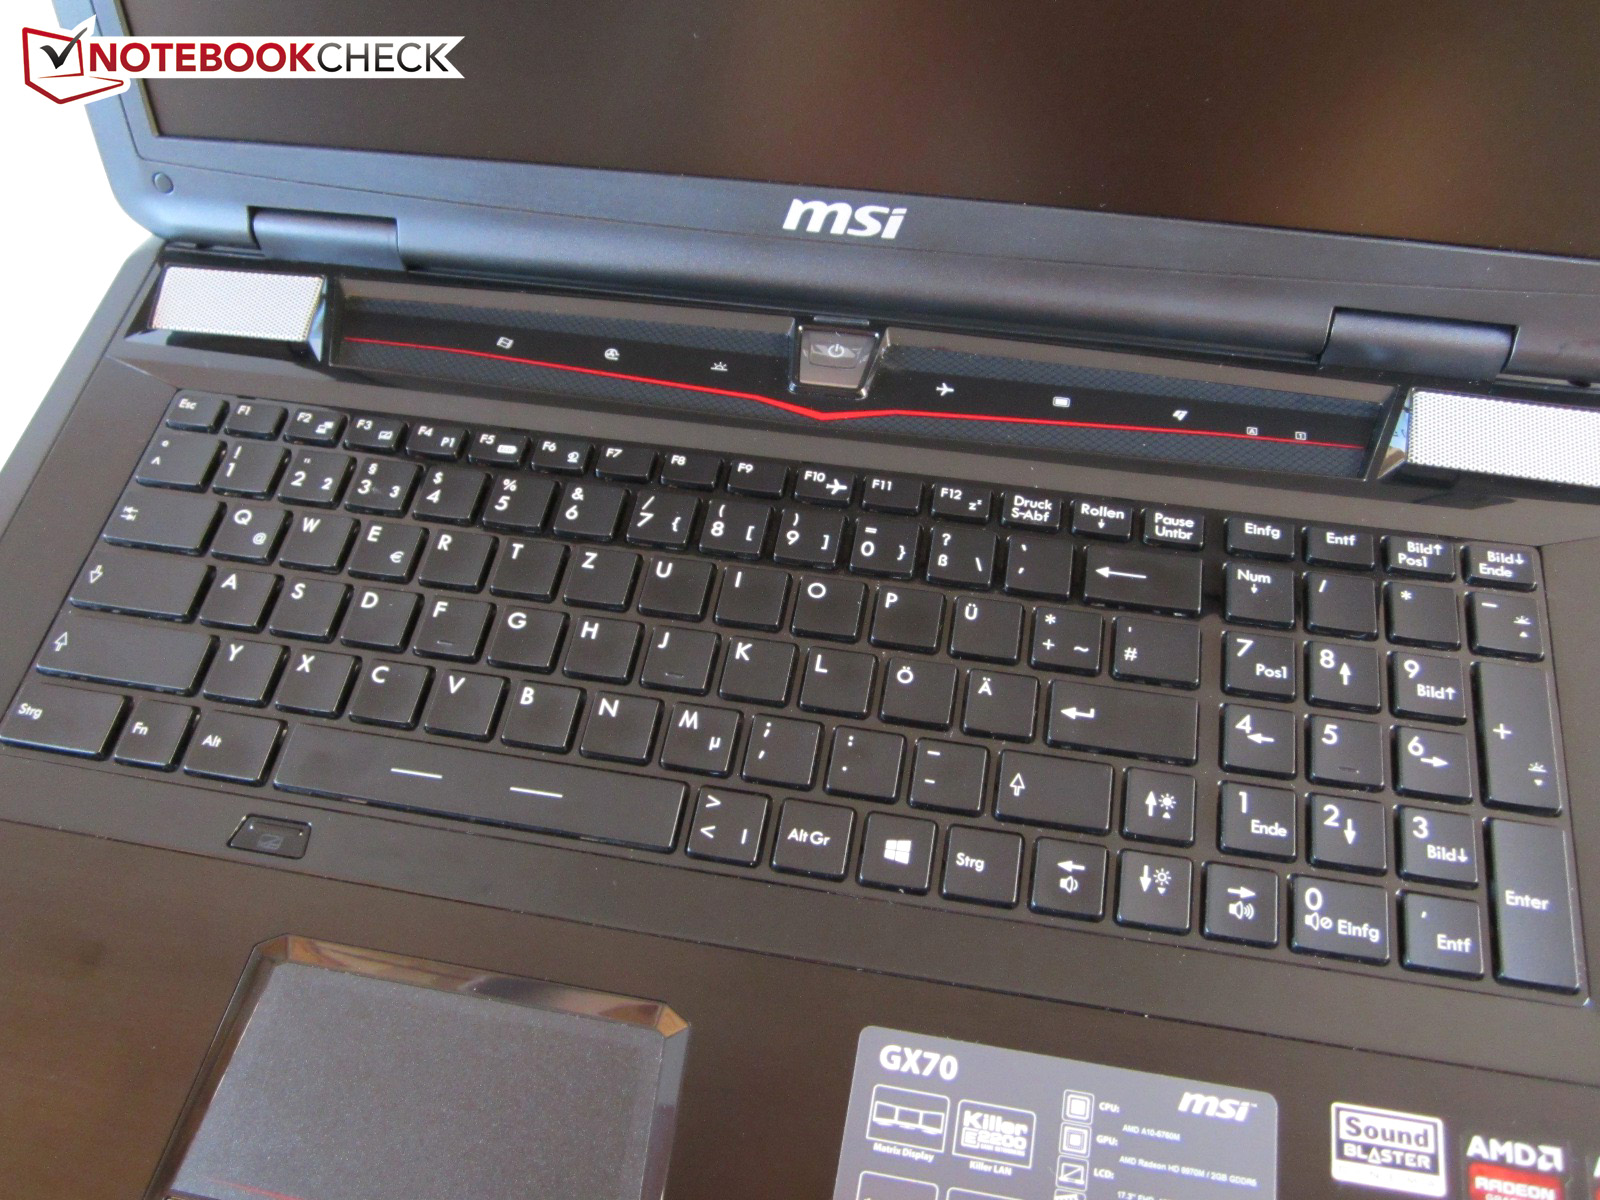
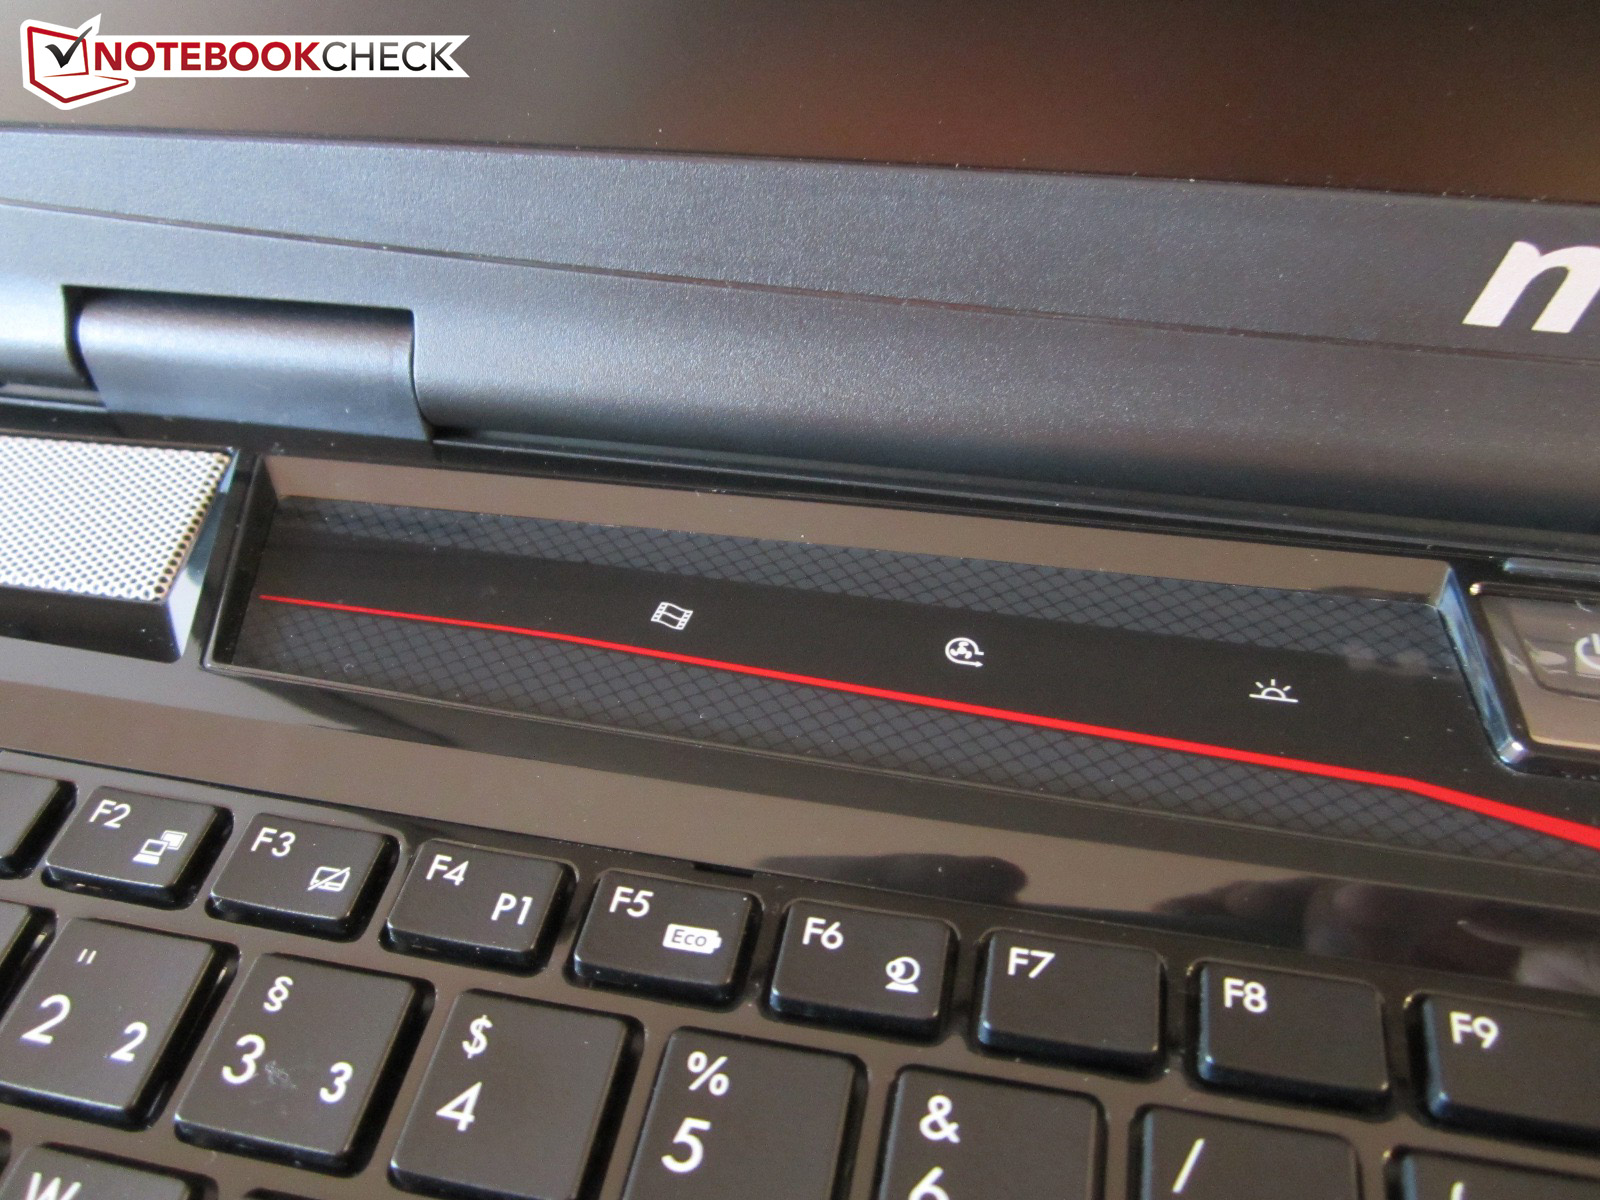
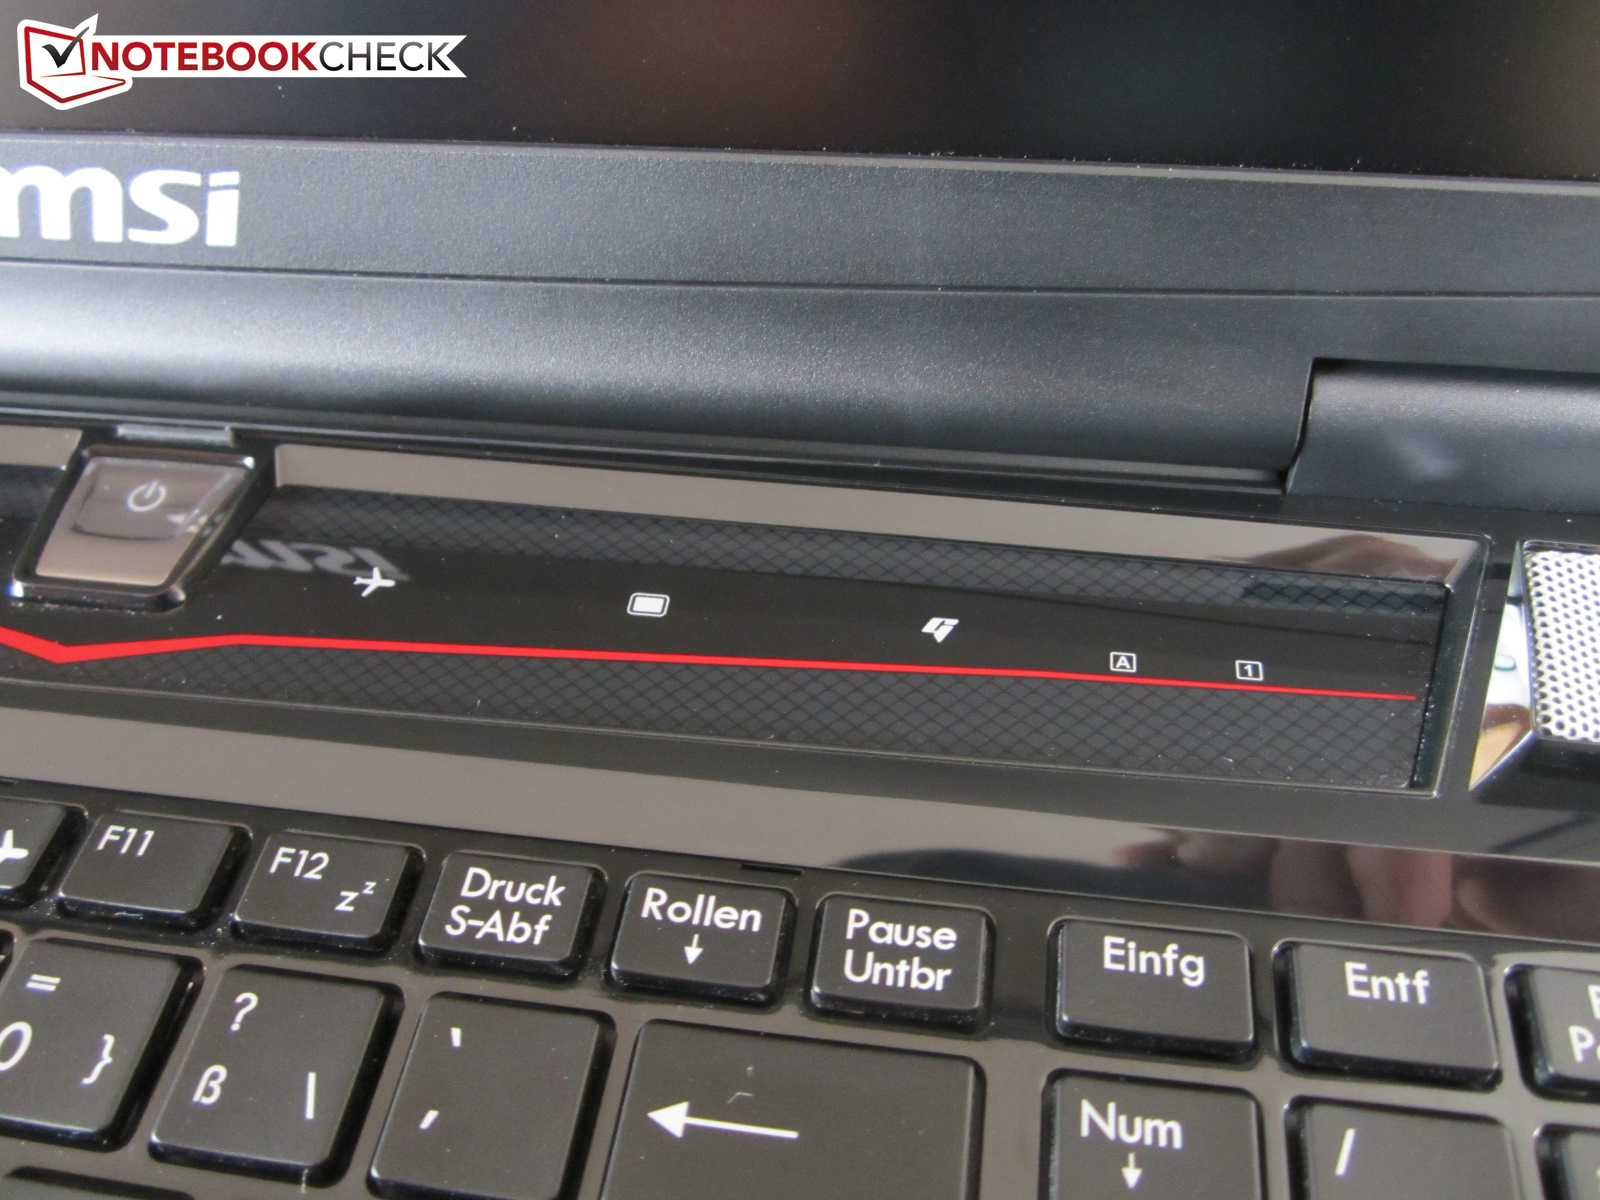
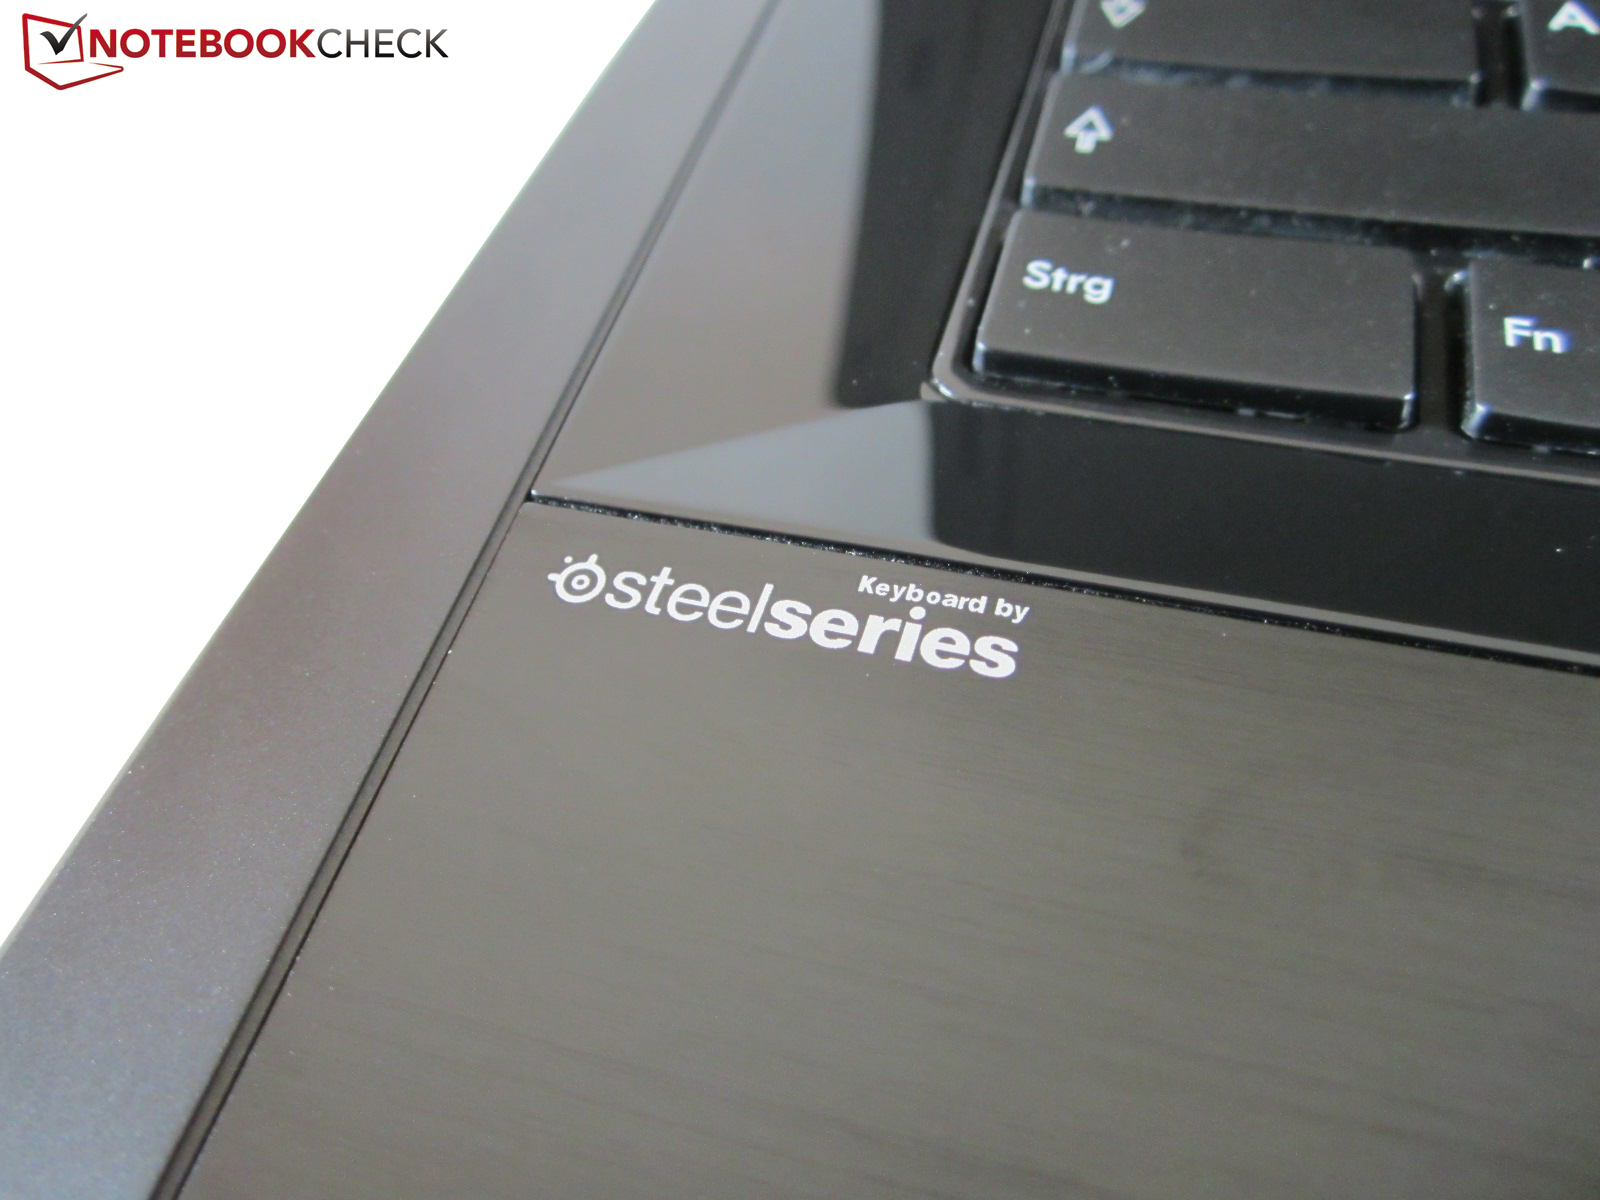
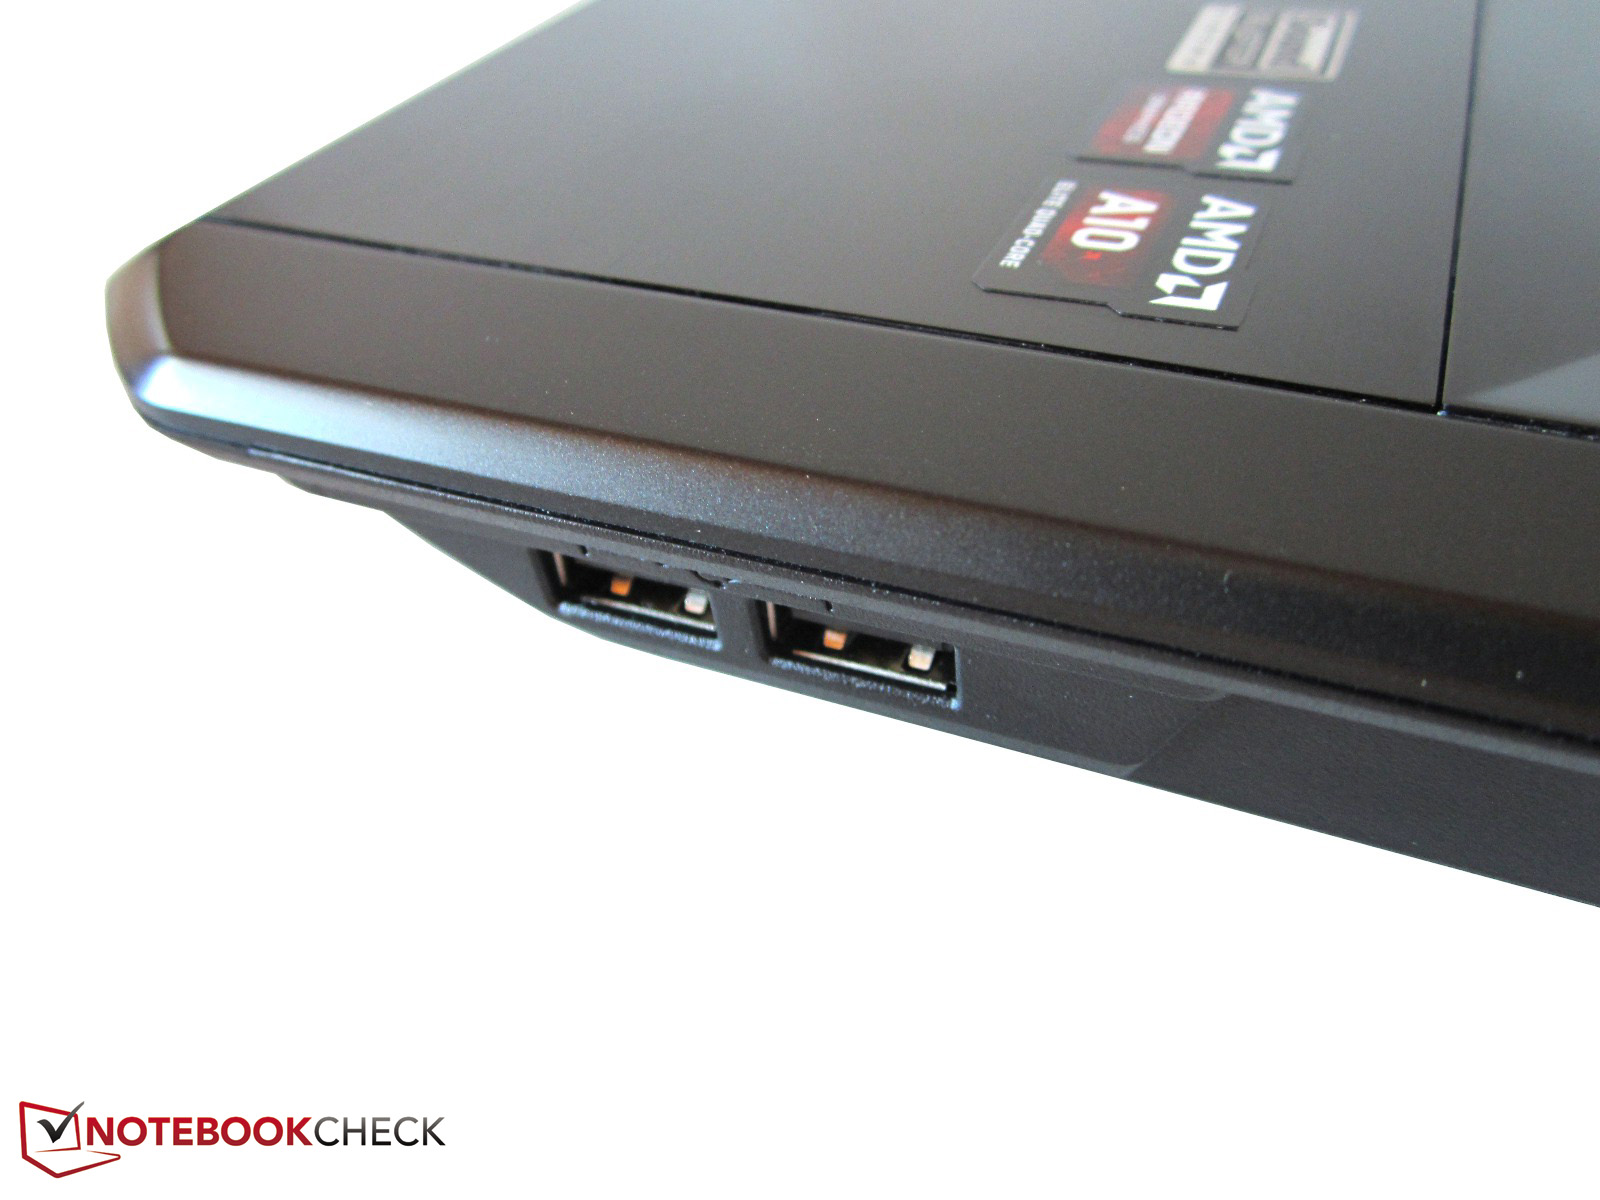
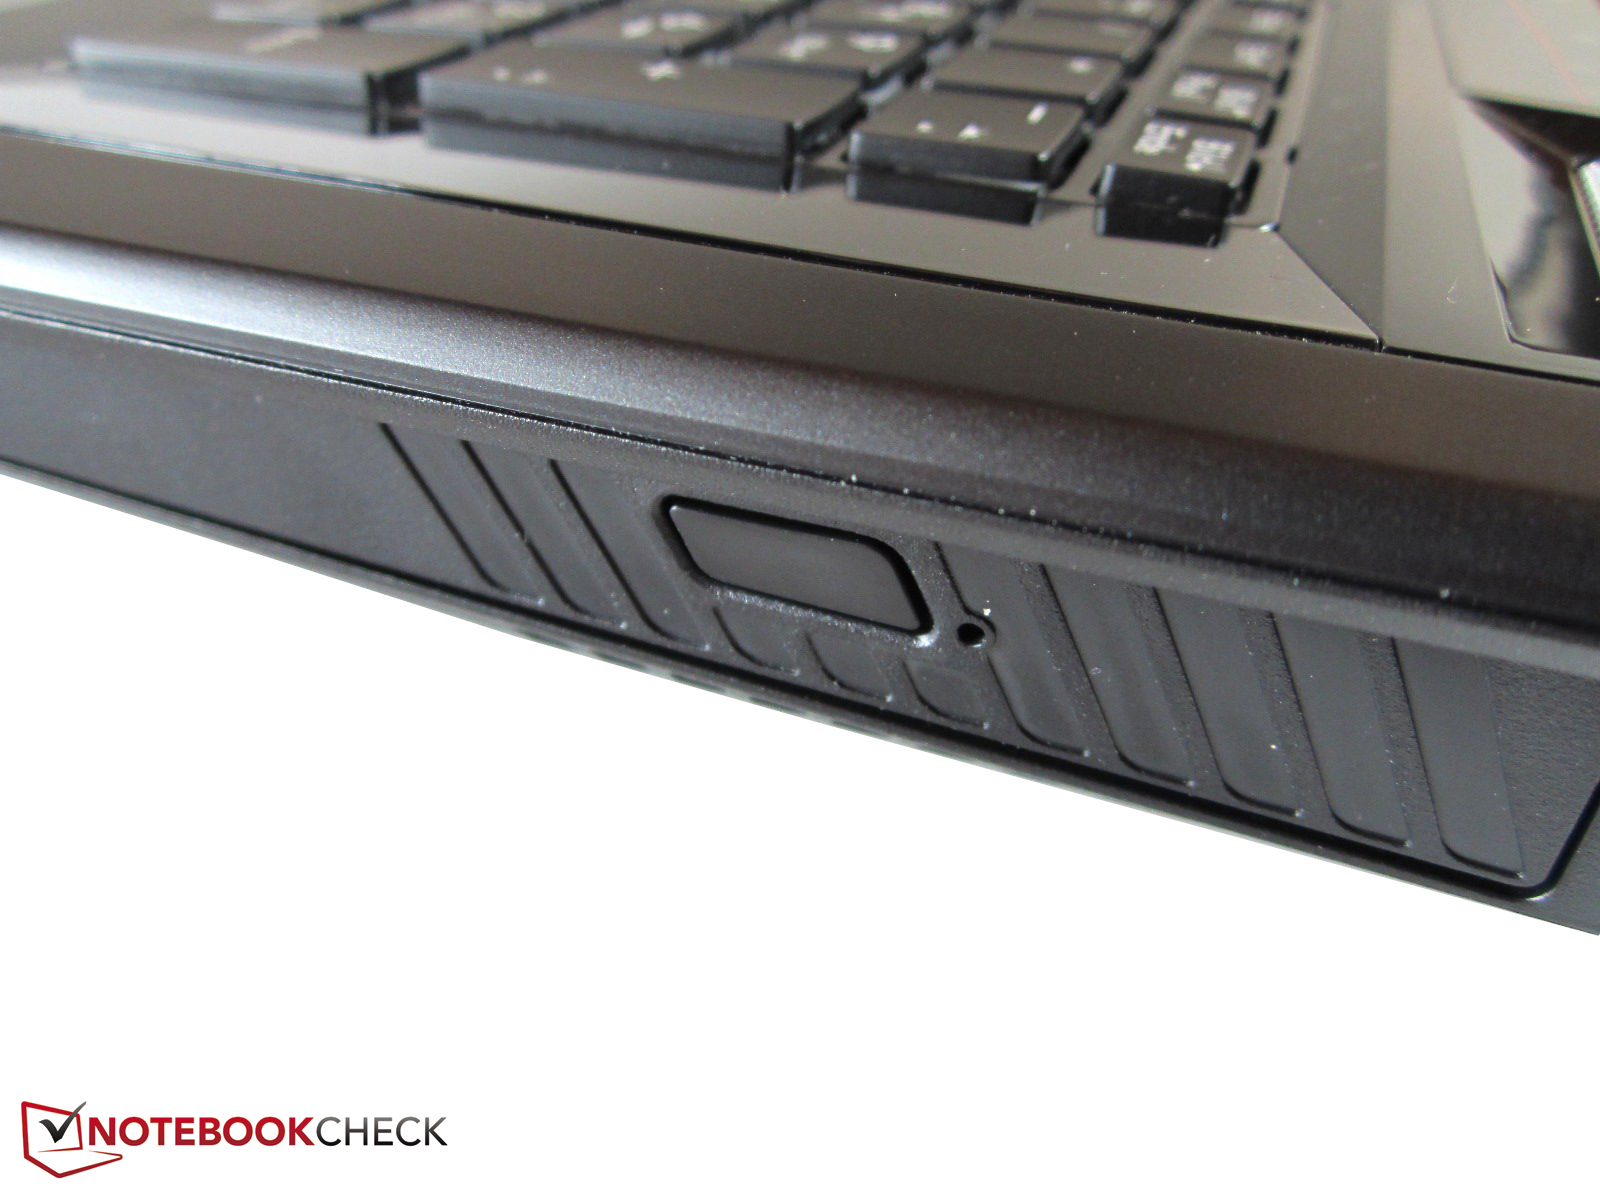
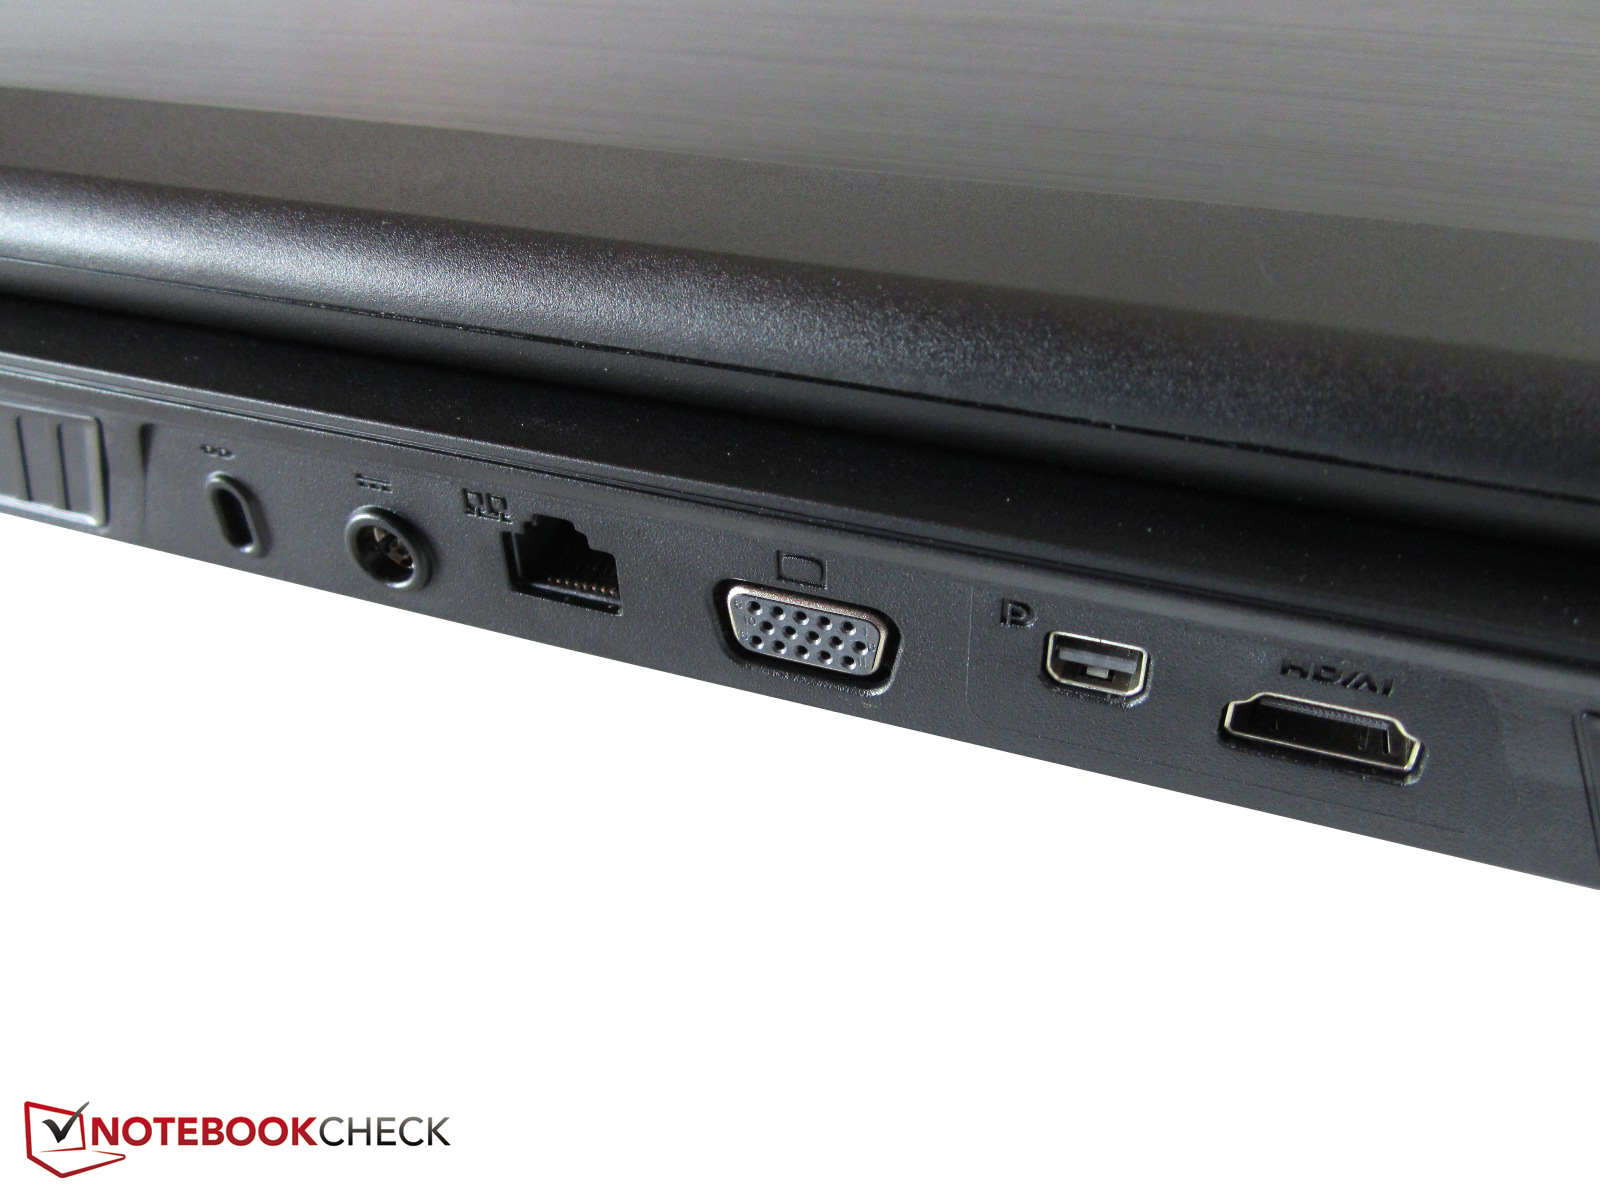
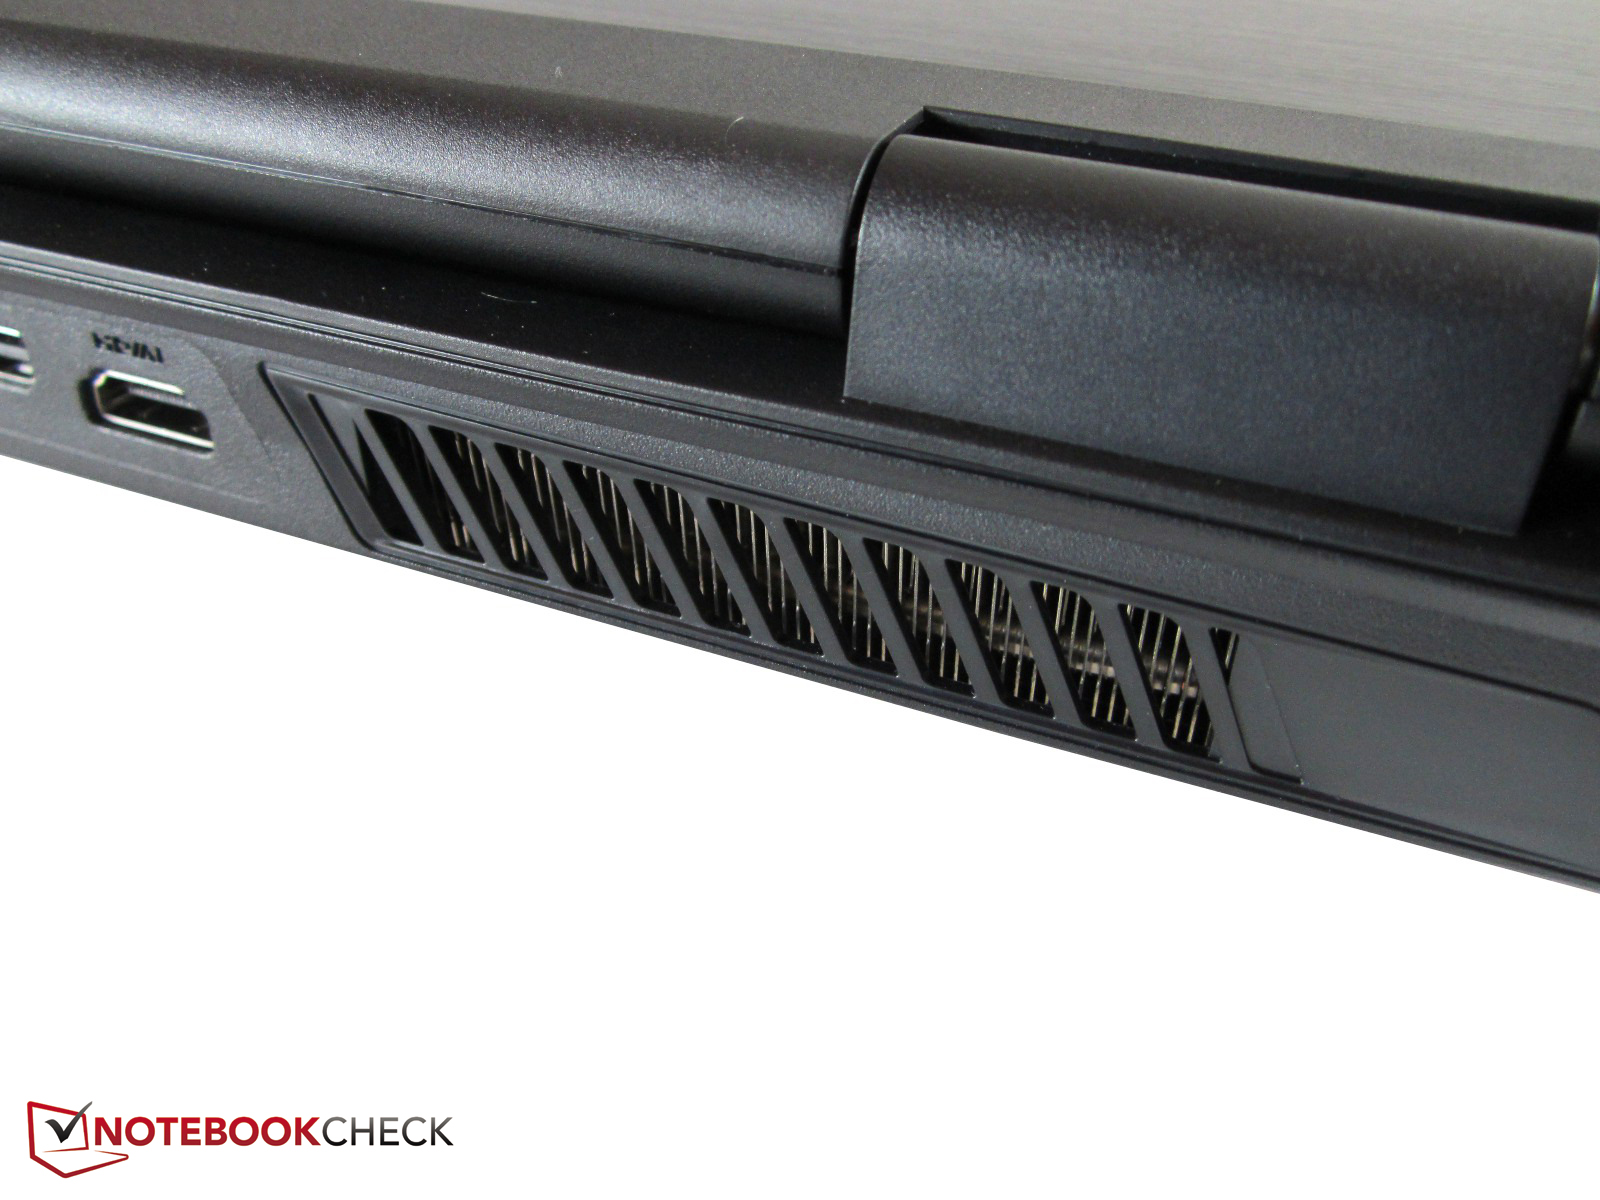
Per il resto MSI ha fatto un buon lavoro. Oltre alla dotazione di porte ed all'autonomia della batteria dobbiamo citare la buona qualità dell'immagine e del suono. Altro aspetto positivo sono l'illuminazione della tastiera, il drive Blu-ray e l'ampia capacità di archiviazione (SSD mSATA ed HDD da 1,000 GB). Lo sviluppo di calore e di rumore sono ancora ragionevoli e l'ampio case con un look elaborato è una questione di gusti.
Considerato tutto ciò, non possiamo raccomandare molto il GX70. I gamers accaniti potrebbero investire meno ed avere un GT70 o un competitor (guardate a destra sotto la voce Shortcut). Chi vuole spendere meno potrebbe essere felice con un portatile Intel ed una GeForce GTX 765M (prestazioni costanti, prezzo inferiore).
Nota: si tratta di una recensione breve, con alcune sezioni non tradotte, per la recensione integrale in inglese guardate qui.
| Company of Heroes 2 | |
| 1920x1080 Maximum / Higher / High AA:High (ordina per valore) | |
| Radeon HD 8970M (9.12.0.0) / A10-5750M | |
| GeForce GTX 765M (320.49) / Core i7-4700MQ | |
| GeForce GTX 770M (320.49) / Core i7-4700MQ | |
| Radeon HD 8970M (12.103.0.0) / Core i7-4700MQ | |
| GeForce GTX 780M (320.49) / Core i7-4700MQ | |
| 1366x768 High AA:Medium (ordina per valore) | |
| Radeon HD 8970M (9.12.0.0) / A10-5750M | |
| GeForce GTX 765M (320.49) / Core i7-4700MQ | |
| GeForce GTX 770M (320.49) / Core i7-4700MQ | |
| Radeon HD 8970M (12.103.0.0) / Core i7-4700MQ | |
| GeForce GTX 780M (320.49) / Core i7-4700MQ | |
| GRID 2 - 1920x1080 Ultra Preset AA:4xMS (ordina per valore) | |
| Radeon HD 8970M (9.12.0.0) / A10-5750M | |
| GeForce GTX 770M (320.49) / Core i7-4700MQ | |
| Radeon HD 8970M (12.103.0.0) / Core i7-4700MQ | |
| GeForce GTX 780M (320.49) / Core i7-4700MQ | |
| Metro: Last Light | |
| 1920x1080 Very High (DX11) AF:16x (ordina per valore) | |
| Radeon HD 8970M (9.12.0.0) / A10-5750M | |
| GeForce GTX 770M (320.49) / Core i7-4700MQ | |
| Radeon HD 8970M (12.103.0.0) / Core i7-4700MQ | |
| GeForce GTX 780M (320.49) / Core i7-4700MQ | |
| 1366x768 High (DX11) AF:16x (ordina per valore) | |
| Radeon HD 8970M (9.12.0.0) / A10-5750M | |
| GeForce GTX 770M (320.49) / Core i7-4700MQ | |
| Radeon HD 8970M (12.103.0.0) / Core i7-4700MQ | |
| GeForce GTX 780M (320.49) / Core i7-4700MQ | |
| BioShock Infinite - 1920x1080 Ultra Preset, DX11 (DDOF) (ordina per valore) | |
| Radeon HD 8970M (9.12.0.0) / A10-5750M | |
| GeForce GTX 765M (311.27) / Core i7-4800MQ | |
| GeForce GTX 770M (311.27) / Core i7-4800MQ | |
| Radeon HD 8970M (12.103.0.0) / Core i7-4700MQ | |
| GeForce GTX 780M (311.27) / Core i7-4700MQ | |
| Tomb Raider - 1920x1080 Ultra Preset AA:FX AF:16x (ordina per valore) | |
| Radeon HD 8970M (9.12.0.0) / A10-5750M | |
| GeForce GTX 765M (311.27) / Core i7-4800MQ | |
| GeForce GTX 770M (311.27) / Core i7-4800MQ | |
| Radeon HD 8970M (12.103.0.0) / Core i7-4700MQ | |
| GeForce GTX 780M (311.27) / Core i7-4700MQ | |
| Crysis 3 | |
| 1920x1080 Very High Preset AA:2xSM AF:16x (ordina per valore) | |
| Radeon HD 8970M (9.12.0.0) / A10-5750M | |
| GeForce GTX 765M (311.27) / Core i7-4800MQ | |
| GeForce GTX 770M (311.27) / Core i7-4800MQ | |
| Radeon HD 8970M (12.103.0.0) / Core i7-4700MQ | |
| GeForce GTX 780M (311.27) / Core i7-4700MQ | |
| 1366x768 High Preset AA:FX AF:16x (ordina per valore) | |
| Radeon HD 8970M (9.12.0.0) / A10-5750M | |
| GeForce GTX 765M (311.27) / Core i7-4800MQ | |
| GeForce GTX 770M (311.27) / Core i7-4800MQ | |
| Radeon HD 8970M (12.103.0.0) / Core i7-4700MQ | |
| Dead Space 3 - 1920x1080 Very High Preset (ordina per valore) | |
| Radeon HD 8970M (9.12.0.0) / A10-5750M | |
| GeForce GTX 765M (311.27) / Core i7-4800MQ | |
| GeForce GTX 770M (311.27) / Core i7-4800MQ | |
| Radeon HD 8970M (12.103.0.0) / Core i7-4700MQ | |
| GeForce GTX 780M (311.27) / Core i7-4700MQ | |
| Far Cry 3 | |
| 1920x1080 DX11 Ultra Preset (HDAO, Enhanced Alpha To Coverage) AA:4x MS (ordina per valore) | |
| Radeon HD 8970M (9.12.0.0) / A10-5750M | |
| GeForce GTX 765M (311.27) / Core i7-4800MQ | |
| GeForce GTX 770M (311.27) / Core i7-4800MQ | |
| Radeon HD 8970M (12.103.0.0) / Core i7-4700MQ | |
| GeForce GTX 780M (311.27) / Core i7-4700MQ | |
| 1366x768 DX11 High Preset (SSAO, Standard Alpha To Coverage) AA:2x MS (ordina per valore) | |
| Radeon HD 8970M (9.12.0.0) / A10-5750M | |
| GeForce GTX 765M (311.27) / Core i7-4800MQ | |
| GeForce GTX 770M (311.27) / Core i7-4800MQ | |
| Radeon HD 8970M (12.103.0.0) / Core i7-4700MQ | |
| Assassin´s Creed III | |
| 1920x1080 Very High (ordina per valore) | |
| Radeon HD 8970M (9.12.0.0) / A10-5750M | |
| GeForce GTX 765M (311.27) / Core i7-4800MQ | |
| GeForce GTX 770M (311.27) / Core i7-4800MQ | |
| Radeon HD 8970M (12.103.0.0) / Core i7-4700MQ | |
| GeForce GTX 780M (311.27) / Core i7-4700MQ | |
| 1366x768 High (ordina per valore) | |
| Radeon HD 8970M (9.12.0.0) / A10-5750M | |
| GeForce GTX 765M (311.27) / Core i7-4800MQ | |
| GeForce GTX 770M (311.27) / Core i7-4800MQ | |
| Radeon HD 8970M (12.103.0.0) / Core i7-4700MQ | |
| Hitman: Absolution | |
| 1920x1080 Ultra Preset AA:4xMS AF:16x (ordina per valore) | |
| Radeon HD 8970M (9.12.0.0) / A10-5750M | |
| GeForce GTX 765M (311.27) / Core i7-4800MQ | |
| GeForce GTX 770M (311.27) / Core i7-4800MQ | |
| Radeon HD 8970M (12.103.0.0) / Core i7-4700MQ | |
| GeForce GTX 780M (311.27) / Core i7-4700MQ | |
| 1366x768 High Preset AA:2xMS AF:8x (ordina per valore) | |
| Radeon HD 8970M (9.12.0.0) / A10-5750M | |
| GeForce GTX 765M (311.27) / Core i7-4800MQ | |
| GeForce GTX 770M (311.27) / Core i7-4800MQ | |
| Radeon HD 8970M (12.103.0.0) / Core i7-4700MQ | |
| Call of Duty: Black Ops 2 - 1920x1080 (Extra) High / On, FXAA AA:4xMS (ordina per valore) | |
| Radeon HD 8970M (9.12.0.0) / A10-5750M | |
| GeForce GTX 765M (311.27) / Core i7-4800MQ | |
| GeForce GTX 770M (311.27) / Core i7-4800MQ | |
| Radeon HD 8970M (12.103.0.0) / Core i7-4700MQ | |
| GeForce GTX 780M (311.27) / Core i7-4700MQ | |
| Need for Speed: Most Wanted | |
| 1920x1080 High / On (ordina per valore) | |
| Radeon HD 8970M (9.12.0.0) / A10-5750M | |
| GeForce GTX 765M (311.27) / Core i7-4800MQ | |
| GeForce GTX 770M (311.27) / Core i7-4800MQ | |
| Radeon HD 8970M (12.103.0.0) / Core i7-4700MQ | |
| GeForce GTX 780M (311.27) / Core i7-4700MQ | |
| 1366x768 High / On (ordina per valore) | |
| Radeon HD 8970M (9.12.0.0) / A10-5750M | |
| GeForce GTX 765M (311.27) / Core i7-4800MQ | |
| GeForce GTX 770M (311.27) / Core i7-4800MQ | |
| Radeon HD 8970M (12.103.0.0) / Core i7-4700MQ | |
| Dishonored - 1920x1080 High / On, FOV: 75 AA:FX (ordina per valore) | |
| Radeon HD 8970M (9.12.0.0) / A10-5750M | |
| GeForce GTX 765M (311.27) / Core i7-4800MQ | |
| GeForce GTX 770M (311.27) / Core i7-4800MQ | |
| Radeon HD 8970M (12.103.0.0) / Core i7-4700MQ | |
| GeForce GTX 780M (311.27) / Core i7-4700MQ | |
| Fifa 13 - 1920x1080 High AA:4xMS (ordina per valore) | |
| Radeon HD 8970M (9.12.0.0) / A10-5750M | |
| GeForce GTX 765M (311.27) / Core i7-4800MQ | |
| GeForce GTX 770M (311.27) / Core i7-4800MQ | |
| Radeon HD 8970M (12.103.0.0) / Core i7-4700MQ | |
| GeForce GTX 780M (311.27) / Core i7-4700MQ | |
| Borderlands 2 - 1920x1080 (Ultra) High / On (PhysX low) AA:FX AF:8x (ordina per valore) | |
| Radeon HD 8970M (9.12.0.0) / A10-5750M | |
| GeForce GTX 765M (311.27) / Core i7-4800MQ | |
| GeForce GTX 770M (311.27) / Core i7-4800MQ | |
| Radeon HD 8970M (12.103.0.0) / Core i7-4700MQ | |
| GeForce GTX 780M (311.27) / Core i7-4700MQ | |
| Guild Wars 2 | |
| 1920x1080 All Maximum / On AA:FX (ordina per valore) | |
| Radeon HD 8970M (9.12.0.0) / A10-5750M | |
| GeForce GTX 765M (311.27) / Core i7-4800MQ | |
| GeForce GTX 770M (311.27) / Core i7-4800MQ | |
| Radeon HD 8970M (12.103.0.0) / Core i7-4700MQ | |
| GeForce GTX 780M (311.27) / Core i7-4700MQ | |
| 1366x768 Best Appearance Preset AA:FX (ordina per valore) | |
| Radeon HD 8970M (9.12.0.0) / A10-5750M | |
| GeForce GTX 765M (311.27) / Core i7-4800MQ | |
| GeForce GTX 770M (311.27) / Core i7-4800MQ | |
| Radeon HD 8970M (12.103.0.0) / Core i7-4700MQ | |
| Counter-Strike: GO - 1920x1080 (Very) High, FXAA AA:4x MS AF:8x (ordina per valore) | |
| Radeon HD 8970M (9.12.0.0) / A10-5750M | |
| GeForce GTX 765M (311.27) / Core i7-4800MQ | |
| GeForce GTX 770M (311.27) / Core i7-4800MQ | |
| Radeon HD 8970M (12.103.0.0) / Core i7-4700MQ | |
| GeForce GTX 780M (311.27) / Core i7-4700MQ | |
| Sleeping Dogs | |
| 1920x1080 Extreme Preset AA:Extreme (ordina per valore) | |
| Radeon HD 8970M (9.12.0.0) / A10-5750M | |
| GeForce GTX 765M (311.27) / Core i7-4800MQ | |
| GeForce GTX 770M (311.27) / Core i7-4800MQ | |
| Radeon HD 8970M (12.103.0.0) / Core i7-4700MQ | |
| GeForce GTX 780M (311.27) / Core i7-4700MQ | |
| 1366x768 High Preset AA:High (ordina per valore) | |
| Radeon HD 8970M (9.12.0.0) / A10-5750M | |
| GeForce GTX 765M (311.27) / Core i7-4800MQ | |
| GeForce GTX 770M (311.27) / Core i7-4800MQ | |
| Radeon HD 8970M (12.103.0.0) / Core i7-4700MQ | |
| Max Payne 3 | |
| 1920x1080 Very High, DX11 AA:Very High FX AF:8x (ordina per valore) | |
| Radeon HD 8970M (9.12.0.0) / A10-5750M | |
| GeForce GTX 765M (311.27) / Core i7-4800MQ | |
| GeForce GTX 770M (311.27) / Core i7-4800MQ | |
| Radeon HD 8970M (12.103.0.0) / Core i7-4700MQ | |
| GeForce GTX 780M (311.27) / Core i7-4700MQ | |
| 1366x768 High, DX11 AA:High FX AF:4x (ordina per valore) | |
| Radeon HD 8970M (9.12.0.0) / A10-5750M | |
| GeForce GTX 765M (311.27) / Core i7-4800MQ | |
| GeForce GTX 770M (311.27) / Core i7-4800MQ | |
| Radeon HD 8970M (12.103.0.0) / Core i7-4700MQ | |
| Dirt Showdown | |
| 1920x1080 Ultra Preset AA:4xMS (ordina per valore) | |
| Radeon HD 8970M (9.12.0.0) / A10-5750M | |
| GeForce GTX 765M (311.27) / Core i7-4800MQ | |
| GeForce GTX 770M (311.27) / Core i7-4800MQ | |
| Radeon HD 8970M (12.103.0.0) / Core i7-4700MQ | |
| GeForce GTX 780M (311.27) / Core i7-4700MQ | |
| 1366x768 High Preset AA:2xMS (ordina per valore) | |
| Radeon HD 8970M (9.12.0.0) / A10-5750M | |
| GeForce GTX 765M (311.27) / Core i7-4800MQ | |
| GeForce GTX 770M (311.27) / Core i7-4800MQ | |
| Radeon HD 8970M (12.103.0.0) / Core i7-4700MQ | |
| Risen 2: Dark Waters - 1920x1080 Ultra / on AA:on AF:8x (ordina per valore) | |
| Radeon HD 8970M (9.12.0.0) / A10-5750M | |
| GeForce GTX 765M (311.27) / Core i7-4800MQ | |
| GeForce GTX 770M (311.27) / Core i7-4800MQ | |
| Radeon HD 8970M (12.103.0.0) / Core i7-4700MQ | |
| GeForce GTX 780M (311.27) / Core i7-4700MQ | |
| Alan Wake - 1920x1080 High Preset AA:4x AF:8x (ordina per valore) | |
| Radeon HD 8970M (9.12.0.0) / A10-5750M | |
| GeForce GTX 765M (311.27) / Core i7-4800MQ | |
| GeForce GTX 770M (311.27) / Core i7-4800MQ | |
| Radeon HD 8970M (12.103.0.0) / Core i7-4700MQ | |
| GeForce GTX 780M (311.27) / Core i7-4700MQ | |
| Anno 2070 - 1920x1080 Very High Preset AA:on AF:4x (ordina per valore) | |
| Radeon HD 8970M (9.12.0.0) / A10-5750M | |
| GeForce GTX 765M (311.27) / Core i7-4800MQ | |
| GeForce GTX 770M (311.27) / Core i7-4800MQ | |
| Radeon HD 8970M (12.103.0.0) / Core i7-4700MQ | |
| GeForce GTX 780M (311.27) / Core i7-4700MQ | |
| The Elder Scrolls V: Skyrim - 1920x1080 Ultra Preset AA:8x AF:16x (ordina per valore) | |
| Radeon HD 8970M (9.12.0.0) / A10-5750M | |
| GeForce GTX 765M (311.27) / Core i7-4800MQ | |
| GeForce GTX 770M (311.27) / Core i7-4800MQ | |
| Radeon HD 8970M (12.103.0.0) / Core i7-4700MQ | |
| GeForce GTX 780M (311.27) / Core i7-4700MQ | |
| Battlefield 3 | |
| 1920x1080 ultra AA:4x MS AF:16x (ordina per valore) | |
| Radeon HD 8970M (9.12.0.0) / A10-5750M | |
| GeForce GTX 765M (311.27) / Core i7-4800MQ | |
| GeForce GTX 770M (311.27) / Core i7-4800MQ | |
| Radeon HD 8970M (12.103.0.0) / Core i7-4700MQ | |
| GeForce GTX 780M (311.27) / Core i7-4700MQ | |
| 1366x768 high AA:- AF:16x (ordina per valore) | |
| Radeon HD 8970M (9.12.0.0) / A10-5750M | |
| GeForce GTX 765M (311.27) / Core i7-4800MQ | |
| GeForce GTX 770M (311.27) / Core i7-4800MQ | |
| Radeon HD 8970M (12.103.0.0) / Core i7-4700MQ | |