 Deutsch
 English
 Español
 Français
 Italiano
 Nederlands
 Polski
 Português
 Русский
 Türkçe
 Svenska
 Chinese
 Magyar
Recensione Breve del Portatile Dell Inspiron 17 5759-5118
| |||||||||||||||||||||||||
Distribuzione della luminosità: 84 %
Al centro con la batteria: 304 cd/m²
Contrasto: 822:1 (Nero: 0.37 cd/m²)
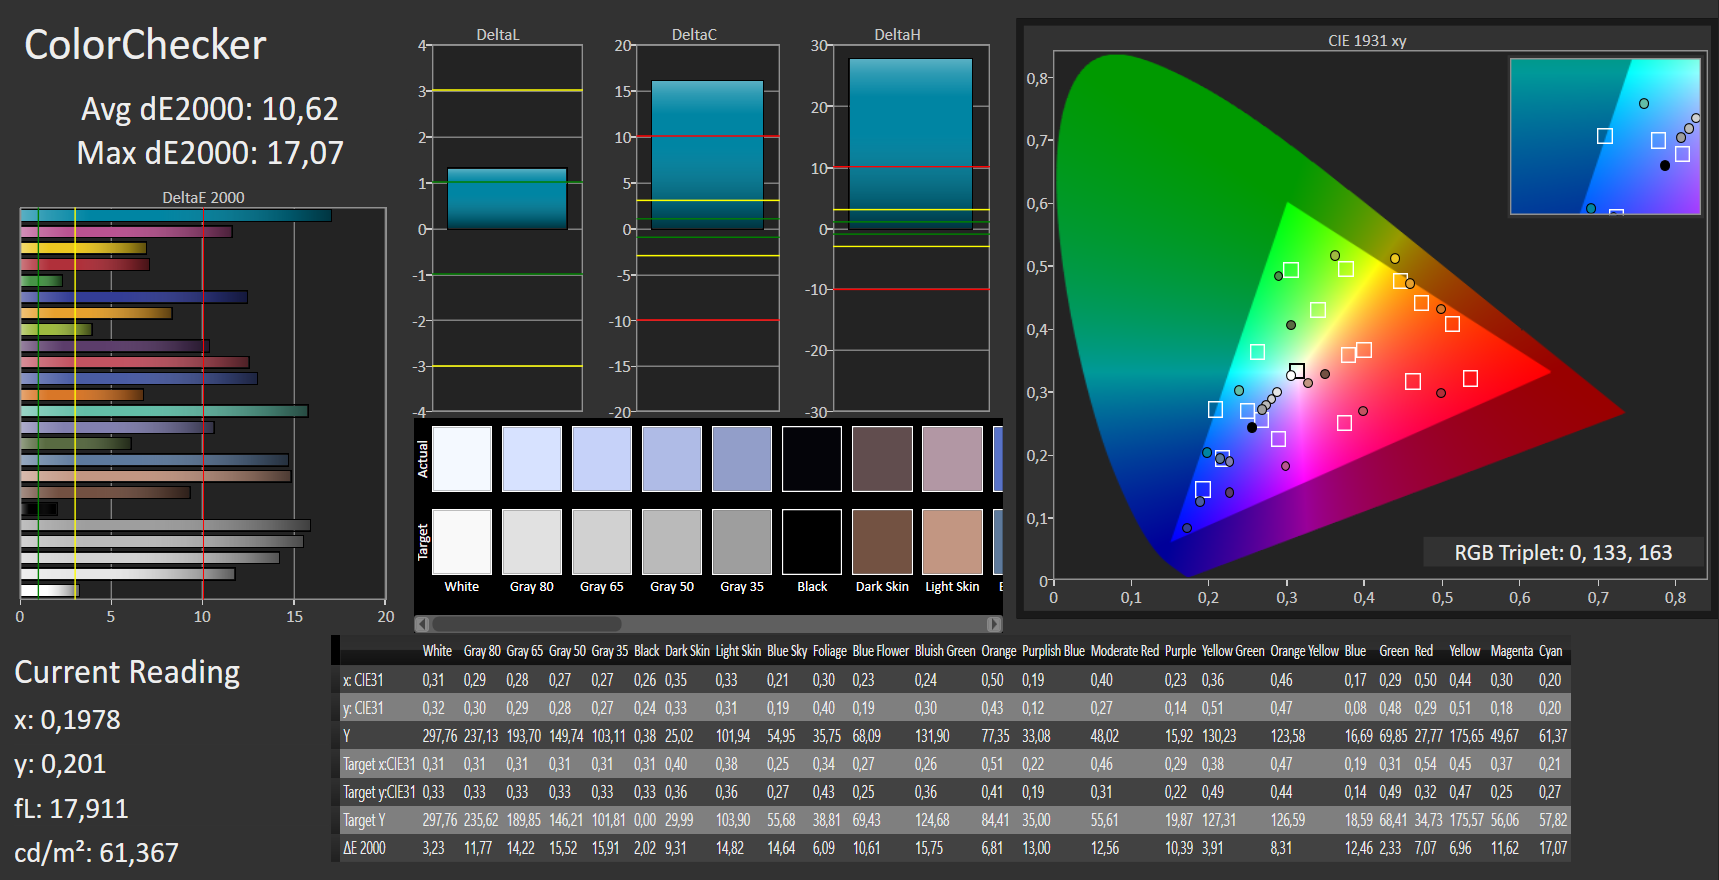
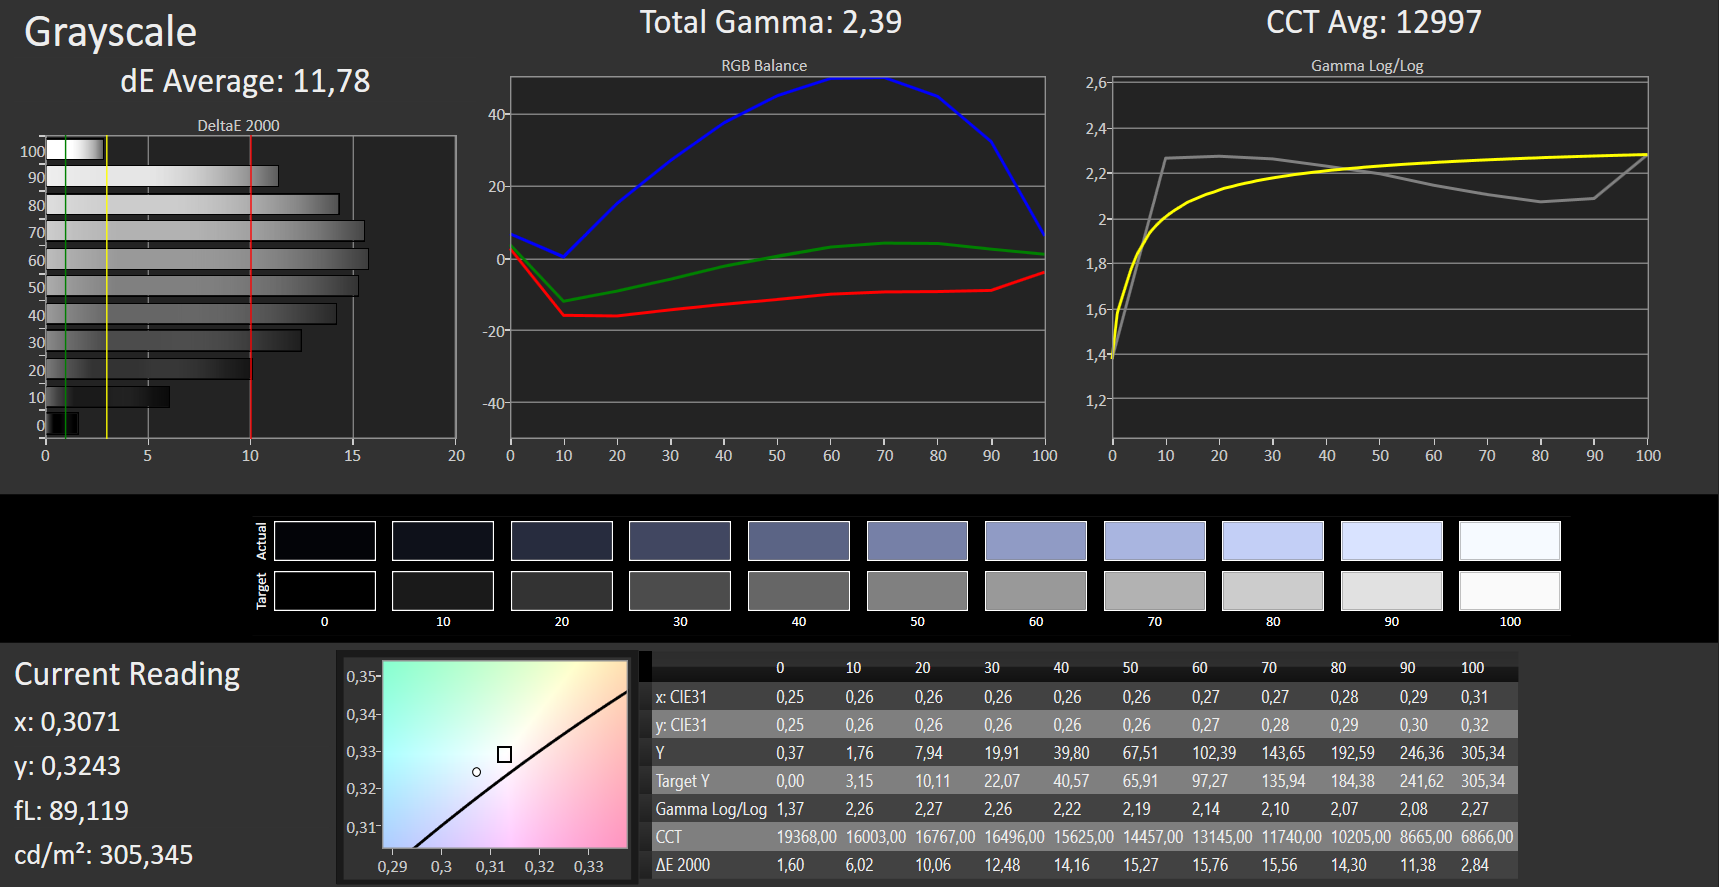
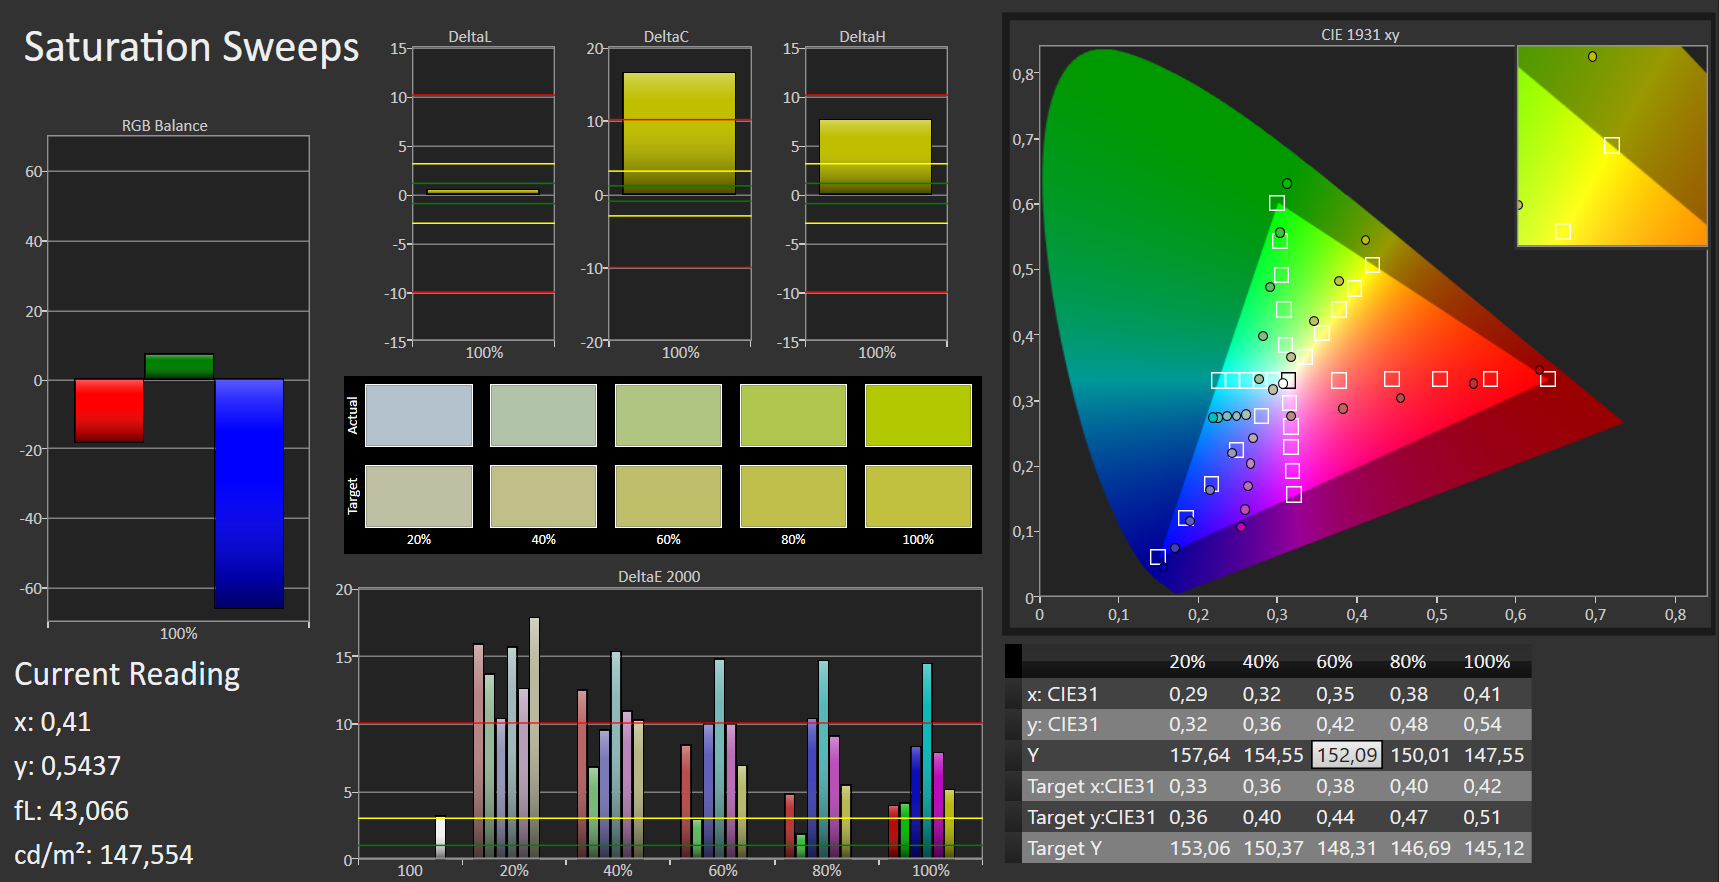
ΔE Color 10.62 | 0.5-29.43 Ø5
ΔE Greyscale 11.78 | 0.57-98 Ø5.3
90% sRGB (Argyll 1.6.3 3D)
59% AdobeRGB 1998 (Argyll 1.6.3 3D)
66.3% AdobeRGB 1998 (Argyll 2.2.0 3D)
90.6% sRGB (Argyll 2.2.0 3D)
69.3% Display P3 (Argyll 2.2.0 3D)
Gamma: 2.39
Sfarfallio dello schermo / PWM (Pulse-Width Modulation)
| flickering dello schermo / PWM rilevato | 200 Hz | ≤ 90 % settaggio luminosita' |
Il display sfarfalla a 200 Hz (Probabilmente a causa dell'uso di PWM) Flickering rilevato ad una luminosita' di 90 % o inferiore. Non dovrebbe verificarsi flickering o PWM sopra questo valore di luminosita'. La frequenza di 200 Hz è relativamente bassa, quindi gli utenti sensibili potrebbero notare il flickering ed accusare stanchezza agli occhi a questo livello di luminosità e a livelli inferiori. In confronto: 53 % di tutti i dispositivi testati non utilizza PWM per ridurre la luminosita' del display. Se è rilevato PWM, una media di 17933 (minimo: 5 - massimo: 3846000) Hz è stata rilevata. | ||
Tempi di risposta del Display
| ↔ Tempi di risposta dal Nero al Bianco | ||
|---|---|---|
| 24 ms ... aumenta ↗ e diminuisce ↘ combinato | ↗ 7 ms Incremento | 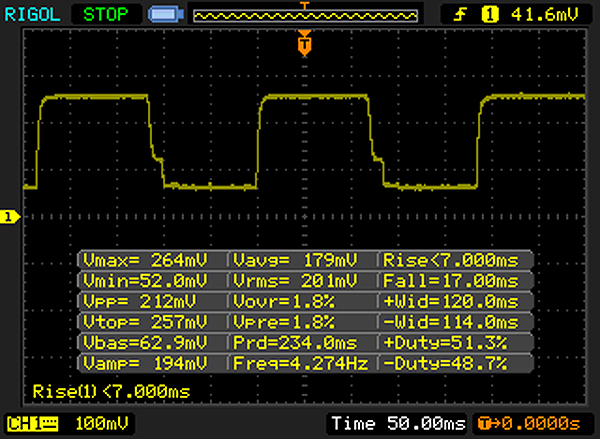 |
| ↘ 17 ms Calo | ||
| Lo schermo mostra buoni tempi di risposta durante i nostri tests, ma potrebbe essere troppo lento per i gamers competitivi. In confronto, tutti i dispositivi di test variano da 0.1 (minimo) a 240 (massimo) ms. » 48 % di tutti i dispositivi è migliore. Questo significa che i tempi di risposta rilevati sono peggiori rispetto alla media di tutti i dispositivi testati (21.5 ms). | ||
| ↔ Tempo di risposta dal 50% Grigio all'80% Grigio | ||
| 86 ms ... aumenta ↗ e diminuisce ↘ combinato | ↗ 44 ms Incremento | 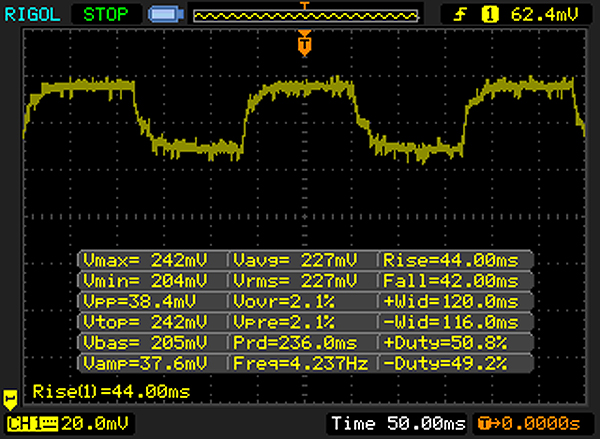 |
| ↘ 42 ms Calo | ||
| Lo schermo mostra tempi di risposta lenti nei nostri tests e sarà insoddisfacente per i gamers. In confronto, tutti i dispositivi di test variano da 0.2 (minimo) a 636 (massimo) ms. » 99 % di tutti i dispositivi è migliore. Questo significa che i tempi di risposta rilevati sono peggiori rispetto alla media di tutti i dispositivi testati (33.8 ms). | ||
| Dell Inspiron 17 5759-5118 TN LED, 1920x1080 | Dell Inspiron 17-5758 IPS, 1920x1080 | HP ProBook 470 G3 UWVA TN LED, 1920x1080 | Acer TravelMate P277-MG-7474 TN LED, 1920x1080 | Lenovo B70-80 80MR0006GE TN, 1600x900 | HP Pavilion 17-g054ng TN-Panel, 1920x1080 | Acer Aspire E5-772G-70VP TN LED, 1920x1080 | |
|---|---|---|---|---|---|---|---|
| Display | 3% | -1% | 2% | -16% | 1% | 1% | |
| Display P3 Coverage | 69.3 | 69.6 0% | 65.1 -6% | 69.9 1% | 54 -22% | 66.1 -5% | 69.4 0% |
| sRGB Coverage | 90.6 | 94.3 4% | 92 2% | 92.1 2% | 81 -11% | 96.1 6% | 91.9 1% |
| AdobeRGB 1998 Coverage | 66.3 | 69 4% | 66.5 0% | 67.3 2% | 55.5 -16% | 68.1 3% | 67.3 2% |
| Response Times | 30% | 1% | |||||
| Response Time Grey 50% / Grey 80% * | 86 ? | 35 ? 59% | 27 ? 69% | ||||
| Response Time Black / White * | 24 ? | 24 ? -0% | 28 ? -17% | ||||
| PWM Frequency | 200 ? | 100 -50% | |||||
| Screen | -1% | 20% | 3% | -19% | 17% | -12% | |
| Brightness middle | 304 | 276 -9% | 314 3% | 336 11% | 252 -17% | 294 -3% | 243 -20% |
| Brightness | 292 | 258 -12% | 291 0% | 319 9% | 236 -19% | 270 -8% | 284 -3% |
| Brightness Distribution | 84 | 87 4% | 88 5% | 84 0% | 90 7% | 86 2% | 79 -6% |
| Black Level * | 0.37 | 0.38 -3% | 0.32 14% | 0.43 -16% | 0.51 -38% | 0.31 16% | 0.45 -22% |
| Contrast | 822 | 726 -12% | 981 19% | 781 -5% | 494 -40% | 948 15% | 540 -34% |
| Colorchecker dE 2000 * | 10.62 | 9.38 12% | 3.43 68% | 9.26 13% | 12.66 -19% | 3.72 65% | 12.04 -13% |
| Greyscale dE 2000 * | 11.78 | 11.81 -0% | 3.72 68% | 10.09 14% | 13.37 -13% | 5.23 56% | 13.25 -12% |
| Gamma | 2.39 92% | 2.03 108% | 2.39 92% | 2.57 86% | 1.93 114% | 2.4 92% | 2.6 85% |
| CCT | 12997 50% | 8966 72% | 6764 96% | 12421 52% | 6491 100% | 7270 89% | 14950 43% |
| Color Space (Percent of AdobeRGB 1998) | 59 | 61 3% | 59.8 1% | 60 2% | 52 -12% | 61.9 5% | 60 2% |
| Color Space (Percent of sRGB) | 90 | 94 4% | 92 2% | 92 2% | 76 -16% | 95.9 7% | 92 2% |
| Media totale (Programma / Settaggio) | 1% /
-0% | 16% /
17% | 2% /
2% | -18% /
-18% | 9% /
13% | -6% /
-9% |
* ... Meglio usare valori piccoli
| Geekbench 3 | |
| 32 Bit Single-Core Score (ordina per valore) | |
| Dell Inspiron 17 5759-5118 | |
| HP ProBook 470 G3 | |
| HP Pavilion 17-g054ng | |
| Asus F751LB-T4030H | |
| HP Pavilion 17-f217ng | |
| 32 Bit Multi-Core Score (ordina per valore) | |
| Dell Inspiron 17 5759-5118 | |
| HP ProBook 470 G3 | |
| HP Pavilion 17-g054ng | |
| Asus F751LB-T4030H | |
| HP Pavilion 17-f217ng | |
| JetStream 1.1 - Total Score (ordina per valore) | |
| Dell Inspiron 17 5759-5118 | |
| HP ProBook 470 G3 | |
| Peacekeeper - --- (ordina per valore) | |
| Dell Inspiron 17 5759-5118 | |
| HP ProBook 470 G3 | |
| HP Pavilion 17-g054ng | |
| Asus F751LB-T4030H | |
| HP Pavilion 17-f217ng | |
* ... Meglio usare valori piccoli
| PCMark 7 Score | 2843 punti | |
| PCMark 8 Home Score Accelerated v2 | 3232 punti | |
| PCMark 8 Creative Score Accelerated v2 | 3873 punti | |
| PCMark 8 Work Score Accelerated v2 | 4234 punti | |
Aiuto | ||

| 3DMark 05 Standard | 10717 punti | |
| 3DMark 06 Standard Score | 5921 punti | |
| 3DMark Vantage P Result | 4772 punti | |
| 3DMark 11 Performance | 1889 punti | |
| 3DMark Ice Storm Standard Score | 40597 punti | |
| 3DMark Cloud Gate Standard Score | 4167 punti | |
| 3DMark Fire Strike Score | 824 punti | |
| 3DMark Fire Strike Extreme Score | 411 punti | |
Aiuto | ||
| 3DMark 06 - 1280x1024 Standard Score AA:0x AF:0x (ordina per valore) | |
| Dell Inspiron 17 5759-5118 | |
| HP ProBook 470 G3 | |
| HP Pavilion 17-g054ng | |
| Asus Asuspro Essential P751JF-T2007G | |
| basso | medio | alto | ultra | |
| Diablo III (2012) | 66.7 | 41.8 | 32.4 | 20.4 |
| Counter-Strike: GO (2012) | 108.7 | 68.1 | 48.3 | 26.4 |
| Tomb Raider (2013) | 57.8 | 29.1 | 22.3 | 11.6 |
| BioShock Infinite (2013) | 44.9 | 25.6 | 21.4 | 7.8 |
| Thief (2014) | 20 | 12.8 | 10.4 | 5.2 |
| Wolfenstein: The New Order (2014) | 33.9 | 30.2 | 12.4 | |
| GRID: Autosport (2014) | 132 | 46.1 | 21.6 | 12.6 |
| Sims 4 (2014) | 145.9 | 41.8 | 17.7 | 14.7 |
| Middle-earth: Shadow of Mordor (2014) | 21.5 | 14.5 | 8.1 | 6.3 |
| Alien: Isolation (2014) | 31.6 | 22.1 | 12.1 | 8.3 |
| F1 2014 (2014) | 83 | 56 | 31 | 12.5 |
| Dragon Age: Inquisition (2014) | 34.1 | 22.1 | 7.3 | 4.9 |
| Evolve (2015) | 22.2 | 14.5 | 8.5 | 5.2 |
| Battlefield Hardline (2015) | 47.6 | 33.2 | 10.2 | 6.3 |
| Dirt Rally (2015) | 114.2 | 29.4 | 15.6 | 12.5 |
| The Witcher 3 (2015) | 17.2 | 11.3 | 6.4 | 2.9 |
| Batman: Arkham Knight (2015) | 17 | 14 | 7 | 3 |
| Metal Gear Solid V (2015) | 40.2 | 26.4 | 9.9 | 7.1 |
| World of Warships (2015) | 49.6 | 34.6 | 17.5 | 12.3 |
| FIFA 16 (2015) | 58.3 | 39.7 | 18.4 | |
| Anno 2205 (2015) | 28.9 | 15.8 | 6.8 | 3.1 |
| Call of Duty: Black Ops 3 (2015) | 34.8 | 19.8 | 9.6 | 6.1 |
| Star Wars Battlefront (2015) | 33.7 | 20.6 | 9.3 | 6.1 |
| Rainbow Six Siege (2015) | 39.4 | 24.8 | 12.4 | 9.9 |
| Just Cause 3 (2015) | 23.1 | 19 | 9.2 | 6.3 |
| Tomb Raider | |
| 1024x768 Low Preset (ordina per valore) | |
| Dell Inspiron 17 5759-5118 | |
| HP ProBook 470 G3 | |
| Acer Aspire E17 E5-752G-T7WY | |
| Lenovo B70-80 80MR0006GE | |
| HP Pavilion 17-g054ng | |
| Asus F751LB-T4030H | |
| HP Pavilion 17-f217ng | |
| HP ProBook 430 G3 P5T00ES | |
| HP ProBook 430 G3 P5T00ES | |
| 1366x768 Normal Preset AA:FX AF:4x (ordina per valore) | |
| Dell Inspiron 17 5759-5118 | |
| HP ProBook 470 G3 | |
| Lenovo B70-80 80MR0006GE | |
| HP Pavilion 17-g054ng | |
| Asus Asuspro Essential P751JF-T2007G | |
| Asus F751LB-T4030H | |
| HP Pavilion 17-f217ng | |
| HP ProBook 430 G3 P5T00ES | |
| HP ProBook 430 G3 P5T00ES | |
| Wolfenstein: The New Order - 1280x720 Low Preset (ordina per valore) | |
| Dell Inspiron 17 5759-5118 | |
| Dell Inspiron 17-5758 | |
| Asus F751LB-T4030H | |
| GRID: Autosport | |
| 1024x768 Ultra Low Preset (ordina per valore) | |
| Dell Inspiron 17 5759-5118 | |
| HP ProBook 470 G3 | |
| Lenovo B70-80 80MR0006GE | |
| HP Pavilion 17-g054ng | |
| HP ProBook 430 G3 P5T00ES | |
| HP ProBook 430 G3 P5T00ES | |
| 1366x768 Medium Preset (ordina per valore) | |
| Dell Inspiron 17 5759-5118 | |
| HP ProBook 470 G3 | |
| Lenovo B70-80 80MR0006GE | |
| HP Pavilion 17-g054ng | |
| Acer Aspire E5-772G-70VP | |
| Asus Asuspro Essential P751JF-T2007G | |
| HP ProBook 430 G3 P5T00ES | |
| HP ProBook 430 G3 P5T00ES | |
| Dirt Rally | |
| 1024x768 Ultra Low Preset (ordina per valore) | |
| Dell Inspiron 17 5759-5118 | |
| Dell Inspiron 17-5758 | |
| HP ProBook 470 G3 | |
| Acer TravelMate P277-MG-7474 | |
| HP Pavilion 17-g054ng | |
| Asus F751LB-T4030H | |
| HP ProBook 430 G3 P5T00ES | |
| HP ProBook 430 G3 P5T00ES | |
| 1366x768 Medium Preset (ordina per valore) | |
| Dell Inspiron 17 5759-5118 | |
| Dell Inspiron 17-5758 | |
| HP ProBook 470 G3 | |
| Acer TravelMate P277-MG-7474 | |
| HP Pavilion 17-g054ng | |
| Asus Asuspro Essential P751JF-T2007G | |
| Asus F751LB-T4030H | |
| HP ProBook 430 G3 P5T00ES | |
| HP ProBook 430 G3 P5T00ES | |
| Diablo III | |
| 1366x768 Medium / low (ordina per valore) | |
| Dell Inspiron 17 5759-5118 | |
| Dell Inspiron 17-5758 | |
| HP ProBook 470 G3 | |
| HP Pavilion 17-g054ng | |
| HP Pavilion 17-f217ng | |
| HP ProBook 430 G3 P5T00ES | |
| HP ProBook 430 G3 P5T00ES | |
| 1366x768 High AA:on (ordina per valore) | |
| Dell Inspiron 17 5759-5118 | |
| Dell Inspiron 17-5758 | |
| HP ProBook 470 G3 | |
| HP Pavilion 17-g054ng | |
| HP Pavilion 17-f217ng | |
| HP ProBook 430 G3 P5T00ES | |
| HP ProBook 430 G3 P5T00ES | |
| Sims 4 - 1366x768 Medium Preset (ordina per valore) | |
| Dell Inspiron 17 5759-5118 | |
| Dell Inspiron 17-5758 | |
| HP ProBook 470 G3 | |
| Lenovo B70-80 80MR0006GE | |
| HP Pavilion 17-g054ng | |
| HP ProBook 430 G3 P5T00ES | |
| HP ProBook 430 G3 P5T00ES | |
| Battlefield Hardline - 1024x768 Low Graphics Quality (DX11) (ordina per valore) | |
| Dell Inspiron 17 5759-5118 | |
| Dell Inspiron 17-5758 | |
| HP ProBook 470 G3 | |
| HP Pavilion 17-g054ng | |
| Asus Asuspro Essential P751JF-T2007G | |
| Asus F751LB-T4030H | |
| HP Pavilion 17-f217ng | |
| HP ProBook 430 G3 P5T00ES | |
| HP ProBook 430 G3 P5T00ES | |
| Star Wars Battlefront - 1024x768 Low Preset (ordina per valore) | |
| Dell Inspiron 17 5759-5118 | |
| HP ProBook 470 G3 | |
| FIFA 16 | |
| 1280x720 Low Preset (ordina per valore) | |
| Dell Inspiron 17 5759-5118 | |
| HP ProBook 470 G3 | |
| HP ProBook 430 G3 P5T00ES | |
| HP ProBook 430 G3 P5T00ES | |
| 1366x768 High Preset AA:2x MS (ordina per valore) | |
| Dell Inspiron 17 5759-5118 | |
| HP ProBook 470 G3 | |
| HP ProBook 430 G3 P5T00ES | |
| HP ProBook 430 G3 P5T00ES | |
| World of Warships | |
| 1366x768 Low Preset AF:Trilinear (ordina per valore) | |
| Dell Inspiron 17 5759-5118 | |
| HP ProBook 470 G3 | |
| HP ProBook 430 G3 P5T00ES | |
| HP ProBook 430 G3 P5T00ES | |
| 1366x768 Medium Preset AF:Trilinear (ordina per valore) | |
| Dell Inspiron 17 5759-5118 | |
| HP ProBook 470 G3 | |
| HP ProBook 430 G3 P5T00ES | |
| HP ProBook 430 G3 P5T00ES | |
Rumorosità
| Idle |
| 33.9 / 33.9 / 33.9 dB(A) |
| HDD |
| 33.9 dB(A) |
| DVD |
| 37.1 / dB(A) |
| Sotto carico |
| 43.8 / 44.2 dB(A) |
 | ||
30 dB silenzioso 40 dB(A) udibile 50 dB(A) rumoroso |
||
min: | ||
| Dell Inspiron 17 5759-5118 6200U, Radeon R5 M335 | Dell Inspiron 17-5758 5500U, GeForce 920M | HP ProBook 470 G3 6500U, Radeon R7 M340 | Acer TravelMate P277-MG-7474 5500U, GeForce 940M | Lenovo B70-80 80MR0006GE 5200U, GeForce 920M | HP Pavilion 17-g054ng A10-8700P, Radeon R8 M365DX | Acer Aspire E5-772G-70VP 5500U, GeForce 940M | |
|---|---|---|---|---|---|---|---|
| Noise | 2% | 14% | 1% | 6% | 8% | 5% | |
| Idle Minimum * | 33.9 | 31.6 7% | 30 12% | 33.5 1% | 33 3% | 30.8 9% | 32 6% |
| Idle Average * | 33.9 | 31.6 7% | 30 12% | 33.5 1% | 33.5 1% | 30.8 9% | 32.3 5% |
| Idle Maximum * | 33.9 | 32.9 3% | 30 12% | 33.6 1% | 34.1 -1% | 31.2 8% | 32.6 4% |
| Load Average * | 43.8 | 45.4 -4% | 35.1 20% | 43.3 1% | 35.8 18% | 37.8 14% | 41.2 6% |
| Load Maximum * | 44.2 | 45.6 -3% | 38.9 12% | 43.6 1% | 40.7 8% | 43.4 2% | 41.6 6% |
* ... Meglio usare valori piccoli
(+) La temperatura massima sul lato superiore è di 38.7 °C / 102 F, rispetto alla media di 36.9 °C / 98 F, che varia da 21.1 a 71 °C per questa classe Multimedia.
(-) Il lato inferiore si riscalda fino ad un massimo di 46.6 °C / 116 F, rispetto alla media di 39.1 °C / 102 F
(+) In idle, la temperatura media del lato superiore è di 24.2 °C / 76 F, rispetto alla media deld ispositivo di 31.2 °C / 88 F.
(+) I poggiapolsi e il touchpad sono piu' freddi della temperatura della pelle con un massimo di 31.9 °C / 89.4 F e sono quindi freddi al tatto.
(-) La temperatura media della zona del palmo della mano di dispositivi simili e'stata di 28.8 °C / 83.8 F (-3.1 °C / -5.6 F).
| Dell Inspiron 17 5759-5118 6200U, Radeon R5 M335 | Dell Inspiron 17-5758 5500U, GeForce 920M | HP ProBook 470 G3 6500U, Radeon R7 M340 | Acer TravelMate P277-MG-7474 5500U, GeForce 940M | Lenovo B70-80 80MR0006GE 5200U, GeForce 920M | HP Pavilion 17-g054ng A10-8700P, Radeon R8 M365DX | Acer Aspire E5-772G-70VP 5500U, GeForce 940M | |
|---|---|---|---|---|---|---|---|
| Heat | -21% | -17% | 2% | -6% | -1% | -20% | |
| Maximum Upper Side * | 38.7 | 54.1 -40% | 43 -11% | 36.2 6% | 40.2 -4% | 38.2 1% | 46.9 -21% |
| Maximum Bottom * | 46.6 | 43 8% | 45.8 2% | 47.4 -2% | 41.7 11% | 34.2 27% | 54.7 -17% |
| Idle Upper Side * | 25.2 | 33.3 -32% | 32.5 -29% | 25.7 -2% | 30.8 -22% | 30.8 -22% | 32.6 -29% |
| Idle Bottom * | 27.9 | 32.8 -18% | 35.6 -28% | 26.1 6% | 30.4 -9% | 30.5 -9% | 31.3 -12% |
* ... Meglio usare valori piccoli
| Off / Standby | |
| Idle | |
| Sotto carico |
|
Leggenda:
min: Attualmente utilizziamo il Metrahit Energy, un multimetro digitale professionale per la misurazione della qualità della potenza e dell'energia monofase, per le nostre misurazioni. | |
| Dell Inspiron 17 5759-5118 6200U, Radeon R5 M335 | Dell Inspiron 17-5758 5500U, GeForce 920M | HP ProBook 470 G3 6500U, Radeon R7 M340 | Acer TravelMate P277-MG-7474 5500U, GeForce 940M | Lenovo B70-80 80MR0006GE 5200U, GeForce 920M | HP Pavilion 17-g054ng A10-8700P, Radeon R8 M365DX | Acer Aspire E5-772G-70VP 5500U, GeForce 940M | |
|---|---|---|---|---|---|---|---|
| Power Consumption | 19% | -7% | -16% | 23% | -3% | -21% | |
| Idle Minimum * | 6.2 | 4 35% | 5.7 8% | 5.4 13% | 4.4 29% | 4.1 34% | 6 3% |
| Idle Average * | 11.6 | 9.2 21% | 11.3 3% | 12.6 -9% | 7.7 34% | 9.6 17% | 12.2 -5% |
| Idle Maximum * | 12.3 | 9.4 24% | 12.2 1% | 14.3 -16% | 7.9 36% | 11 11% | 14.5 -18% |
| Load Average * | 36 | 40.4 -12% | 44.8 -24% | 52.1 -45% | 33.6 7% | 57.6 -60% | 54 -50% |
| Load Maximum * | 55 | 40.8 26% | 66.3 -21% | 67.5 -23% | 49.8 9% | 65.7 -19% | 73.7 -34% |
* ... Meglio usare valori piccoli
| Dell Inspiron 17 5759-5118 40 Wh | Dell Inspiron 17-5758 40 Wh | HP ProBook 470 G3 44 Wh | Acer TravelMate P277-MG-7474 37 Wh | Lenovo B70-80 80MR0006GE 41 Wh | HP Pavilion 17-g054ng 41 Wh | Acer Aspire E5-772G-70VP 37 Wh | |
|---|---|---|---|---|---|---|---|
| Autonomia della batteria | 3% | -2% | -15% | 9% | -21% | -11% | |
| Reader / Idle | 578 | 448 -22% | 490 -15% | 482 -17% | 437 -24% | 473 -18% | 454 -21% |
| H.264 | 265 | 270 2% | 228 -14% | ||||
| WiFi v1.3 | 301 | 243 -19% | 277 -8% | 247 -18% | 335 11% | 216 -28% | 259 -14% |
| Load | 71 | 107 51% | 81 14% | 64 -10% | 100 41% | 53 -25% | 72 1% |
Pro
Contro
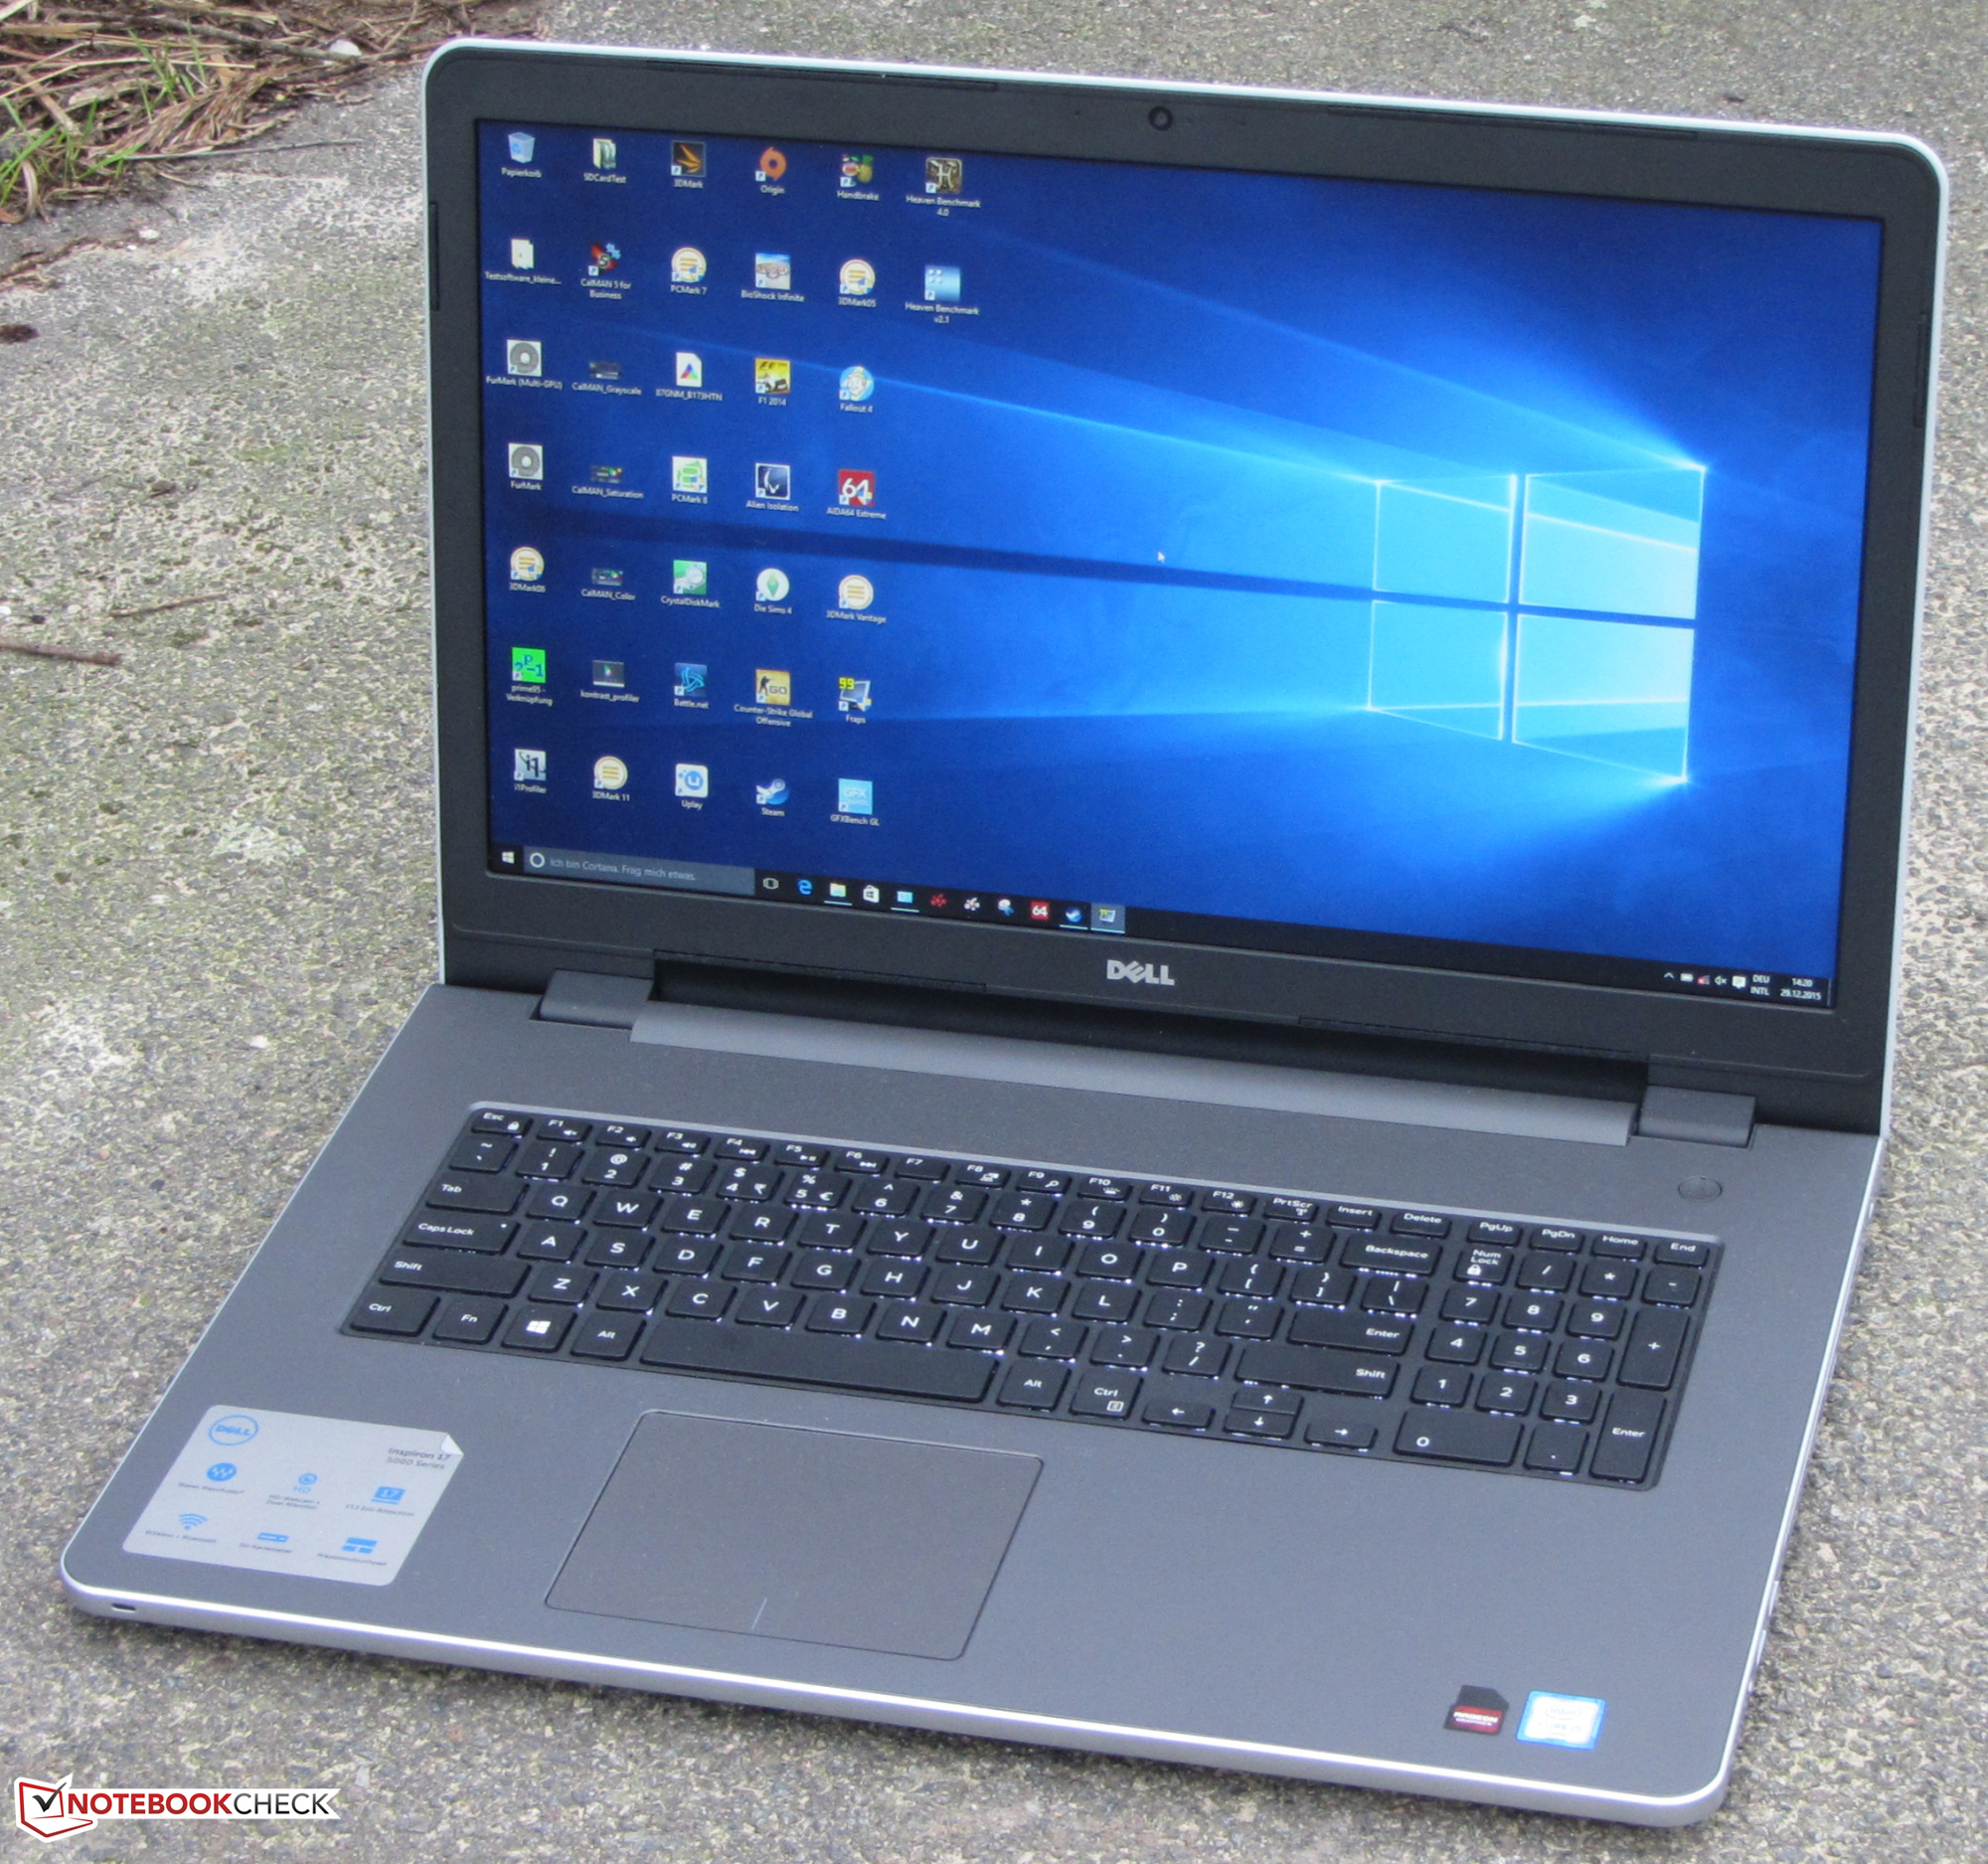
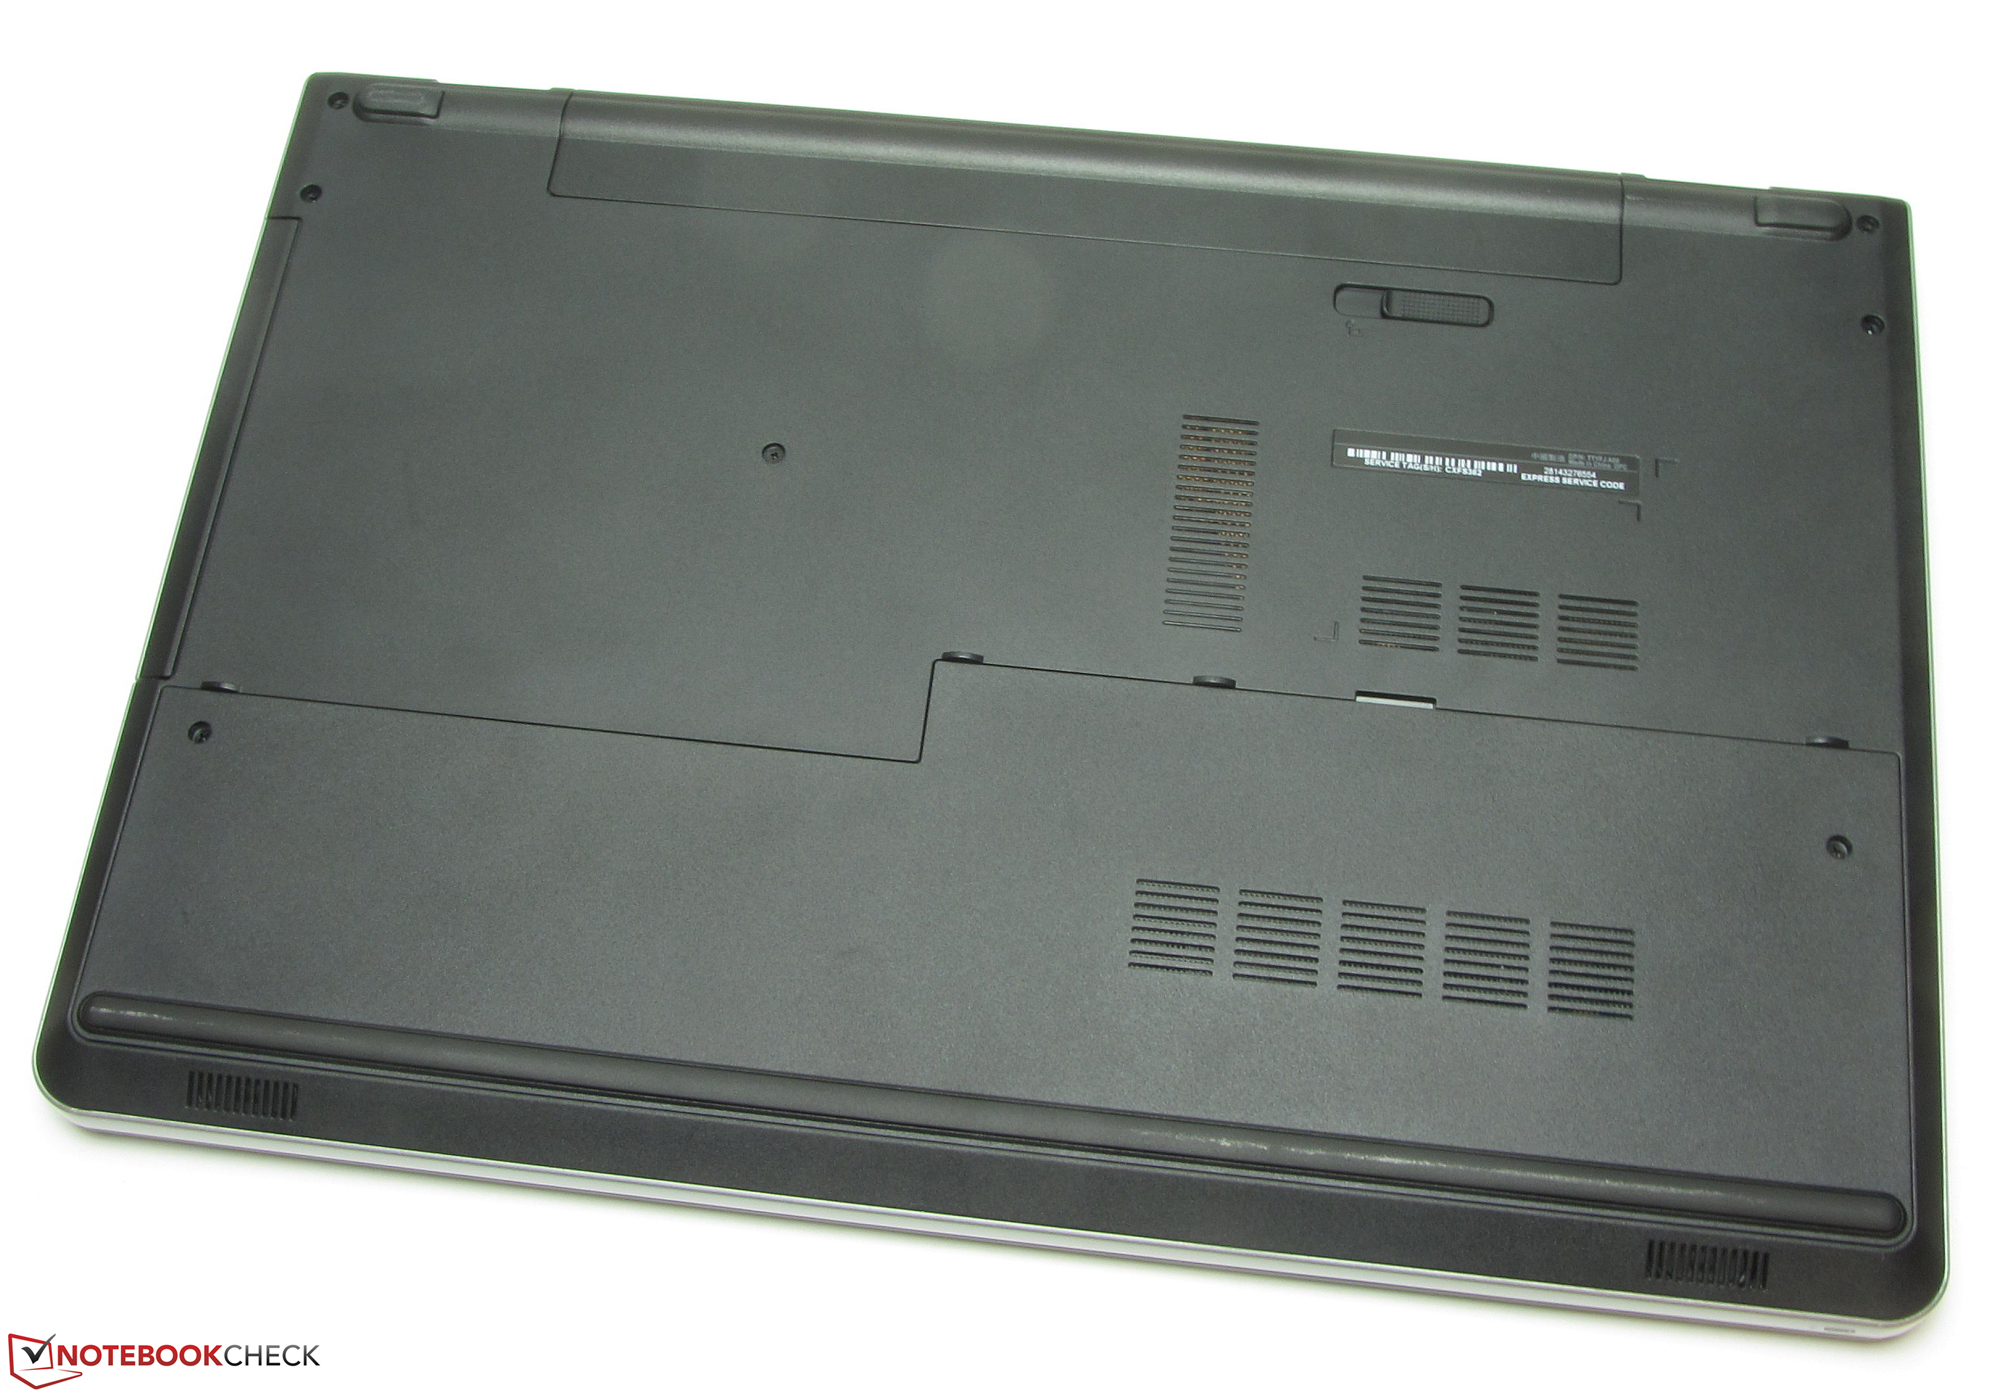
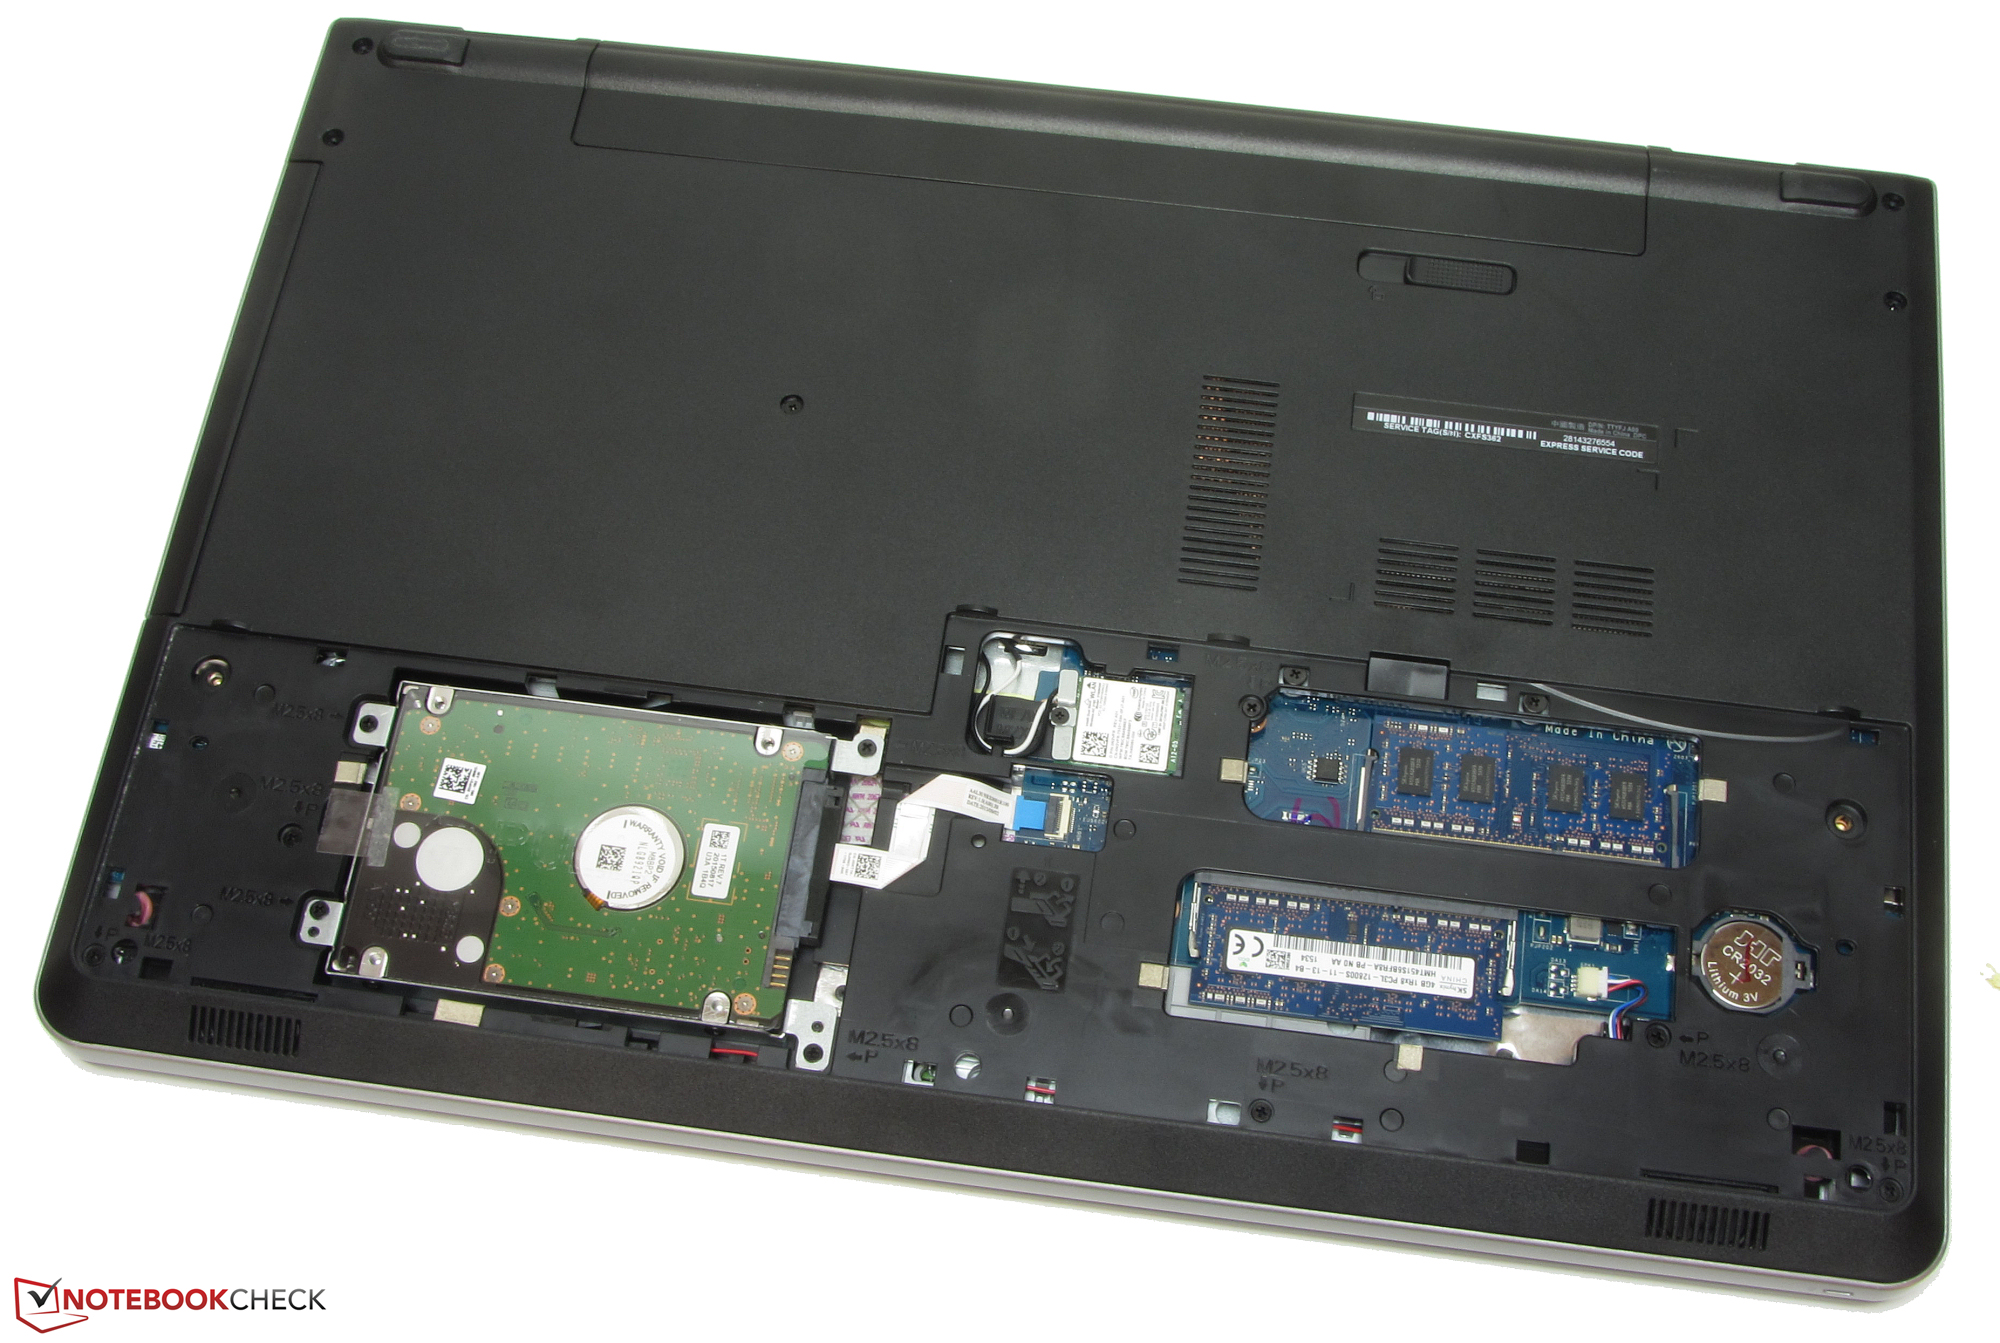
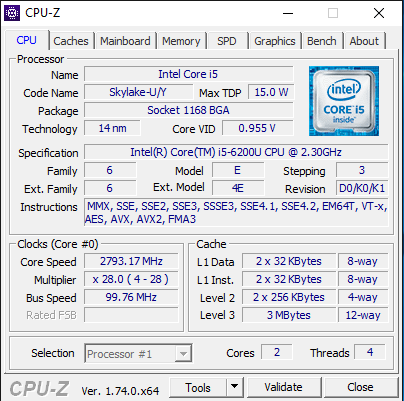
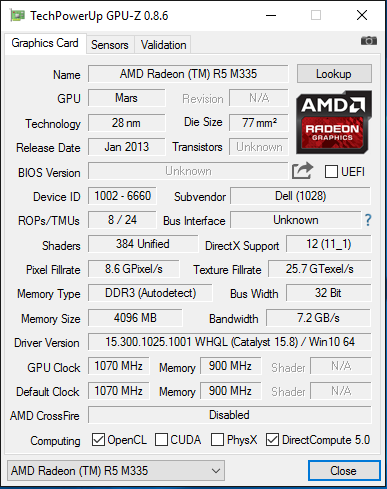
Il nuovo modello Inspiron 17 monta un processore Skylake. Questo consente migliori prestazioni. Tuttavia, c'è un downgrades Dell delle prestazioni grafiche. Nel complesso, la Radeon R5 M335 è meno potente della GeForce 920M del predecessore. Pertanto, le prestazioni gaming sono ridotte. Il portatile lavora in modo silenzioso e non si scalda. Ha anche molto spazio di archiviazione. Monta un hdd da 1 TB. Grazie alla cover di manutenzione, è facile da sostituire. L'autonomia della batteria nel complesso è soddisfacente. La tastiera non vince alcun premio. Sebbene sia la stessa del predecessore, la tastiera oscilla notevolmente a causa dell'assenza di un supporto interno.
Il pannello matto Full HD ha luminosità e contrasto elevati. Tuttavia è uno schermo TN con angoli di visuale limitati, ma è uno dei modelli migliori. Infatti sono più ampi di quanto abbiamo rilevato su altri modelli TN. Sfortunatamente, lo schermo mostra flickering PWM con luminosità del 90% ed inferiore (200 Hz).
Dell ha in fondo realizzato un decente tuttofare. Tuttavia, la debole Radeon non si adatta alla situazione. Difficilmente offre più del core grafico integrato in modalità dual-channel in termini di prestazioni gaming. L'utente farebbe meglio a scegliere un modello Inspiron più economico senza GPU dedicata.
Da notare che i modelli più economici montano pannelli HD+ (1600x900 pixels). Chi punta a uno schermo Full HD deve dare uno sguardo al nostro modello.
Nota: si tratta di una recensione breve, con alcune sezioni non tradotte, per la versione integrale in inglese guardate qui.
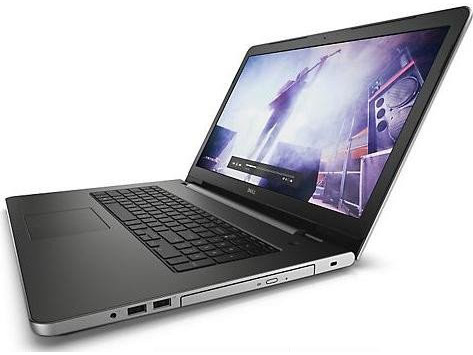
Dell Inspiron 17 5759-5118
-
12/31/2015 v4(old)
Sascha Mölck