 Deutsch
 English
 Español
 Français
 Italiano
 Nederlands
 Polski
 Português
 Русский
 Türkçe
 Svenska
 Chinese
 Magyar
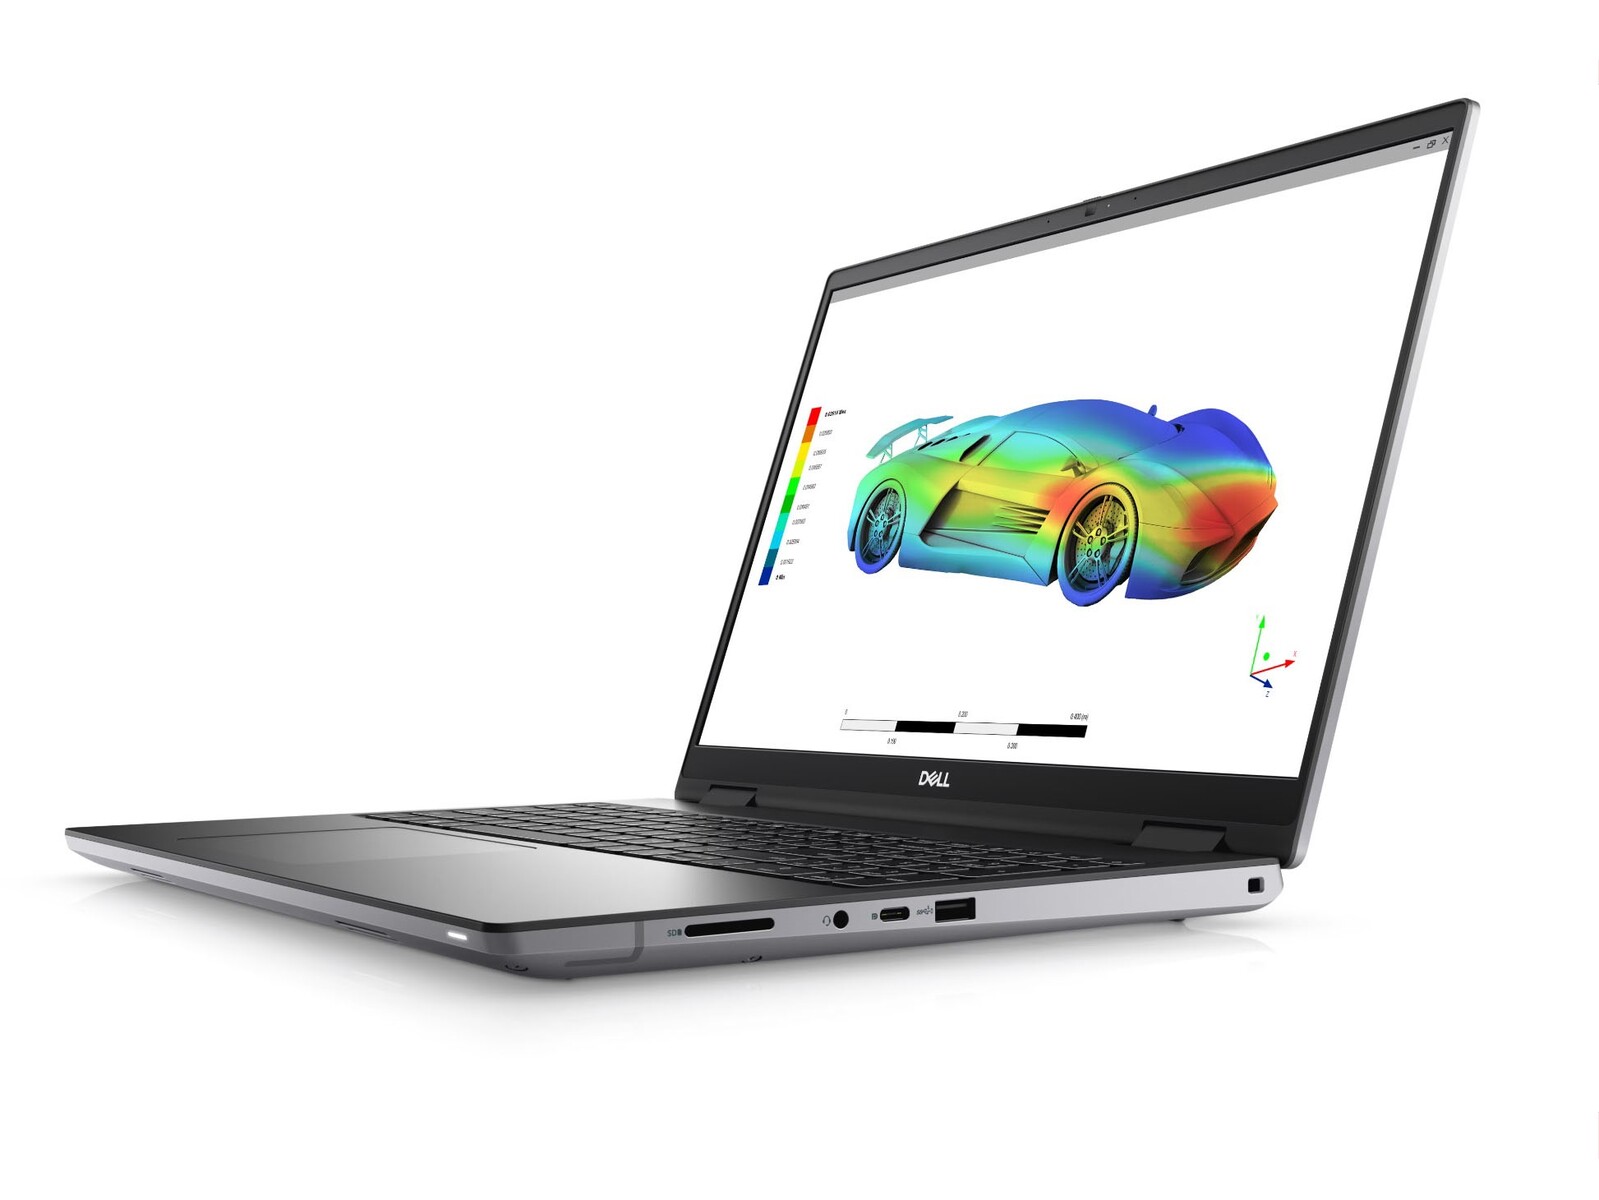
Recensione della workstation Dell Precision 7670 Performance: debutto della Nvidia RTX A5500
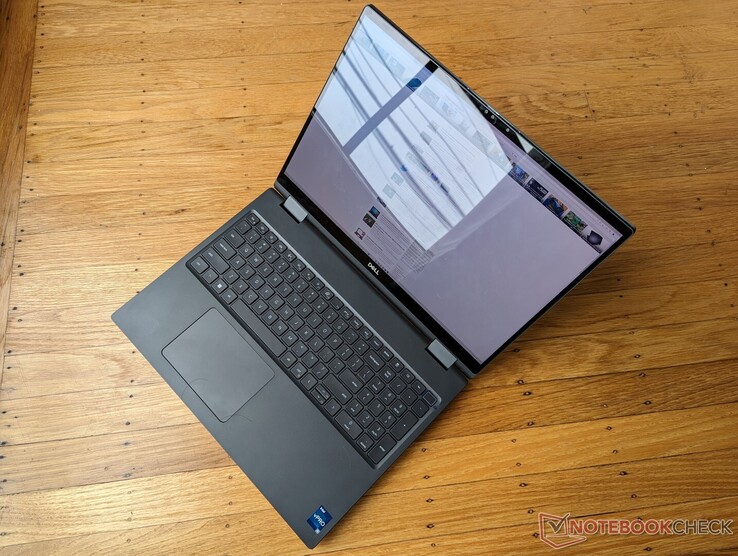
Dell sta correndo molti rischi con la nuova serie Precision 7670. Non solo è il primo portatile primo portatile di produzione a utilizzare CAMMma la serie stessa è composta da un modello più sottile e da un modello più potente e spesso (chiamato "Performance" o "Ultimate") a seconda della configurazione. Il mese scorso abbiamo recensito il modello più sottile e ora daremo un'occhiata al modello più spesso.
A parte le leggere differenze nell'altezza Z, i due modelli condividono esattamente lo stesso design del telaio e le stesse caratteristiche. Consigliamo di consultare la nostra recensione sul modello più sottile Precision 7670 per saperne di più sulle caratteristiche fisiche della serie.
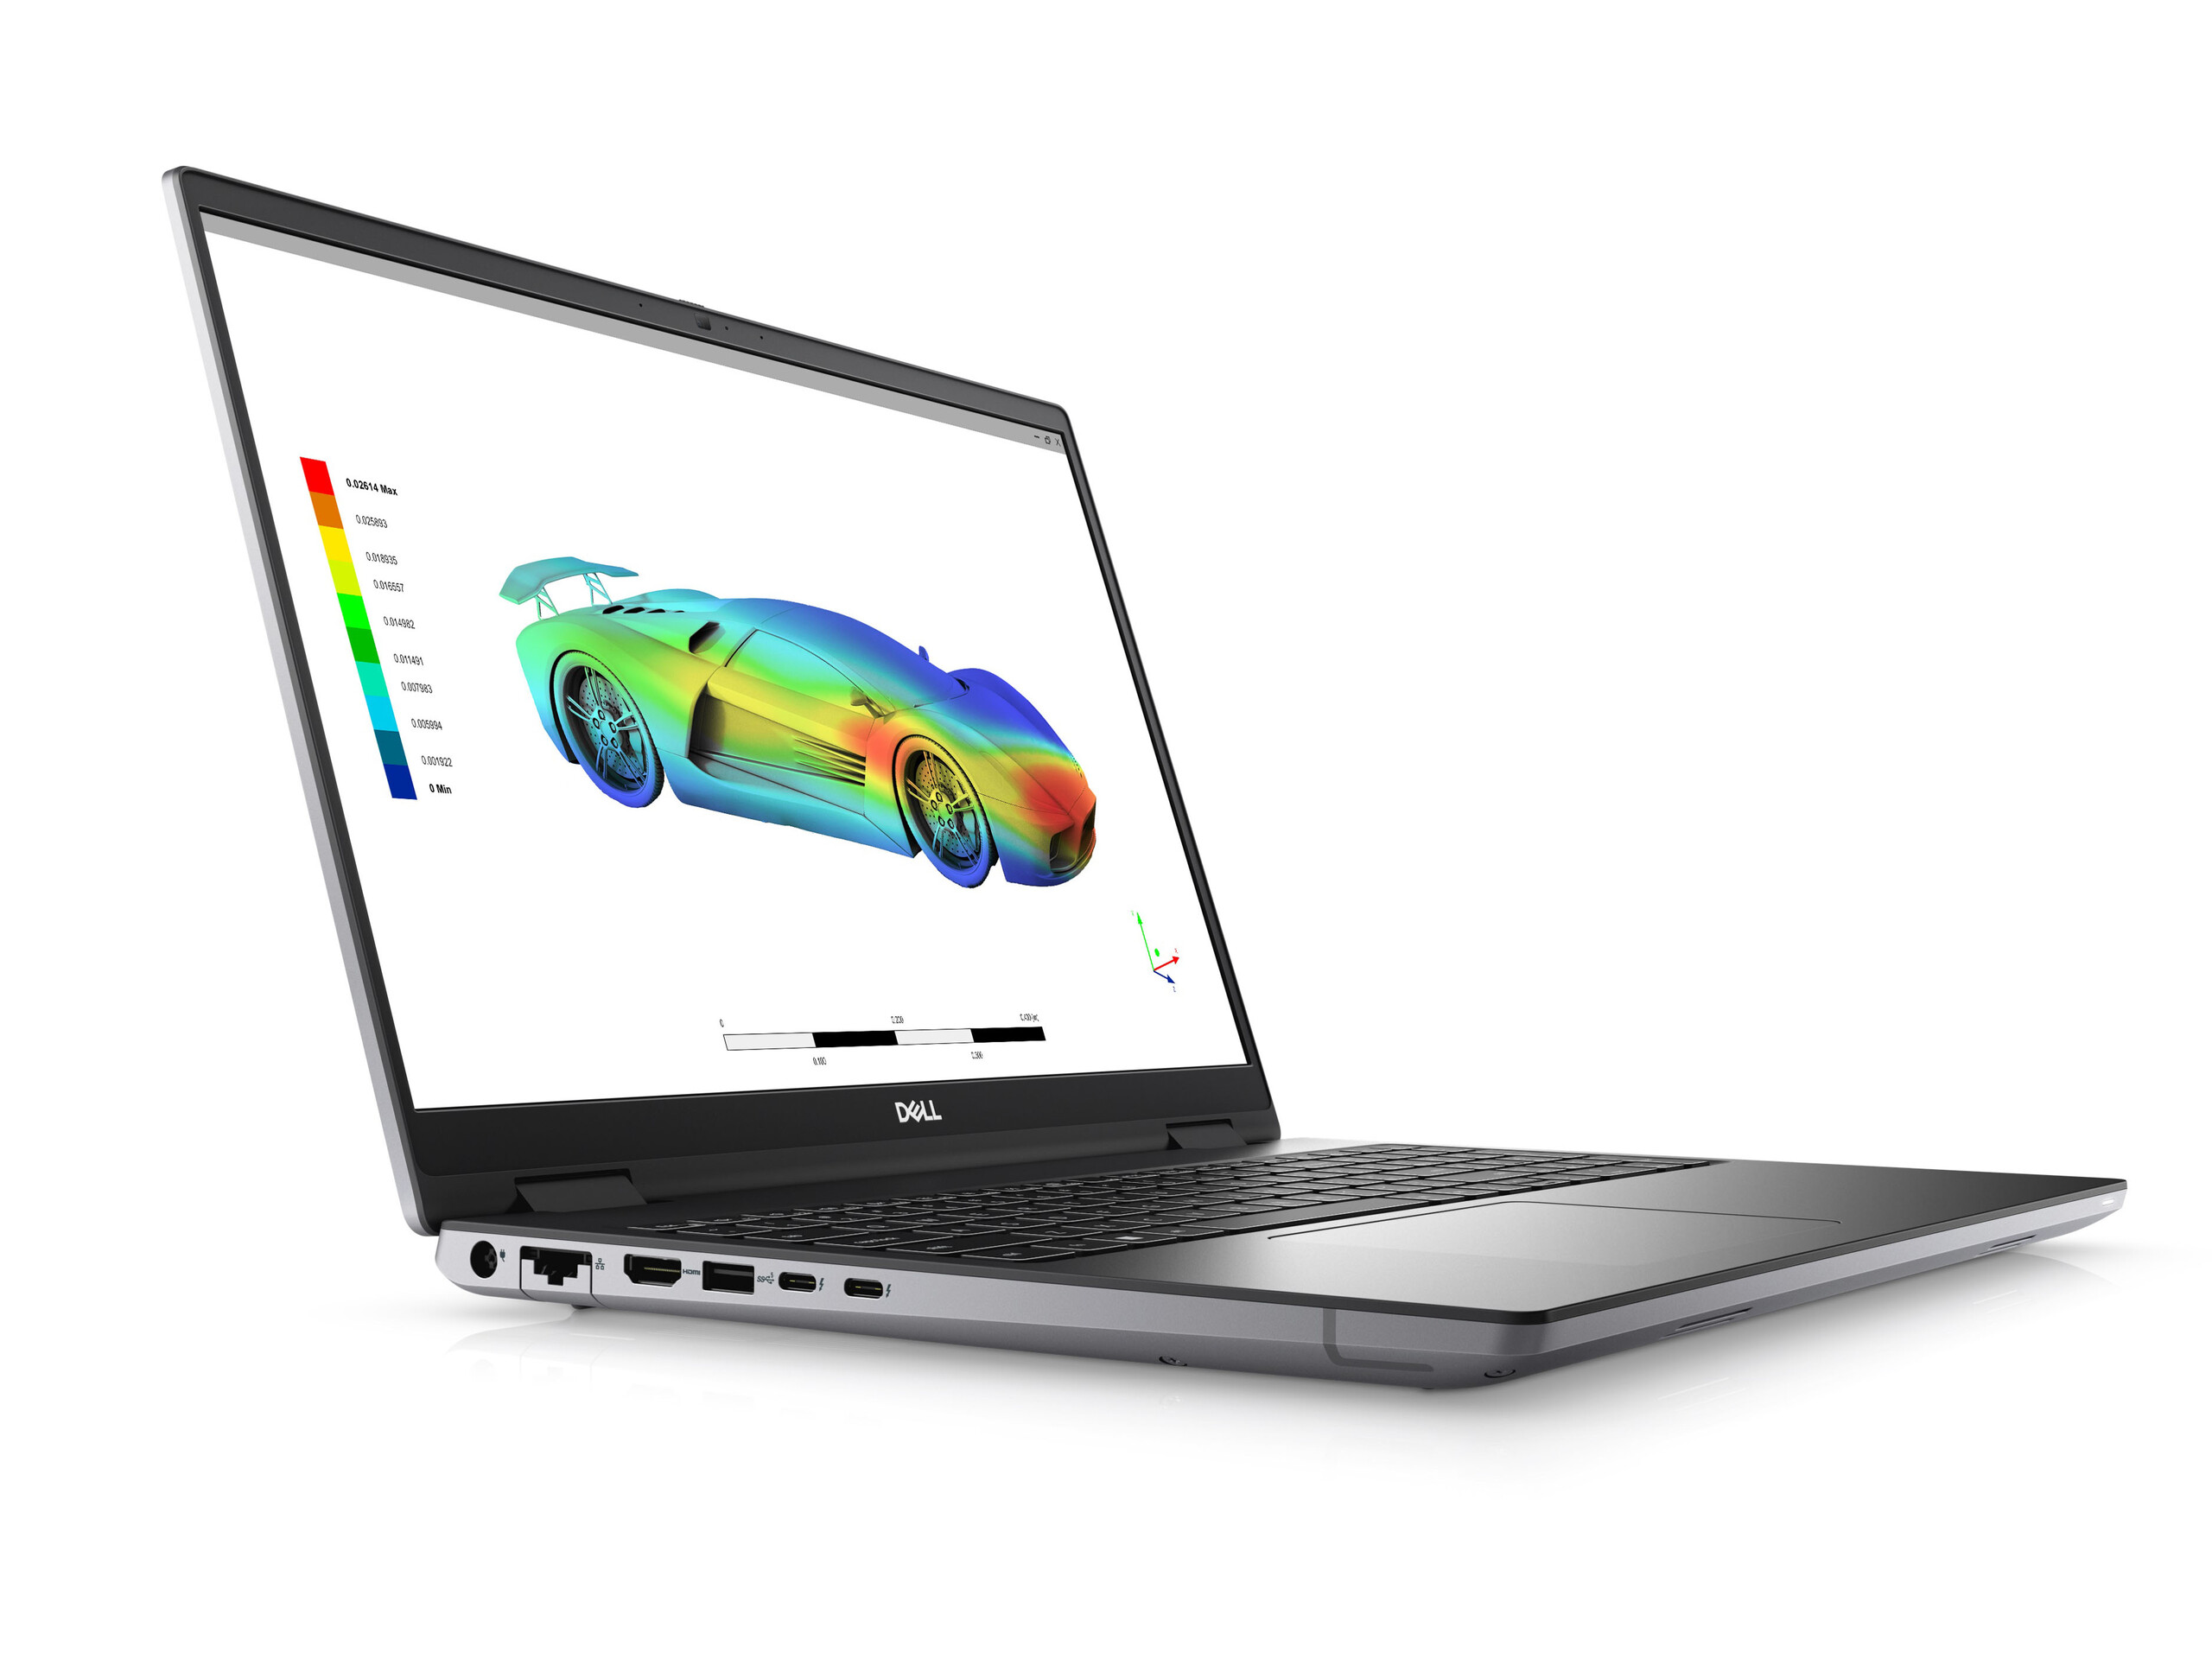
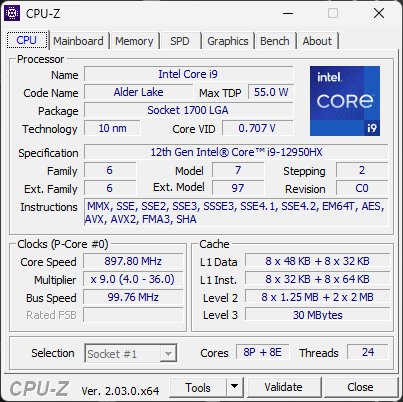
La nostra specifica unità di recensione è la configurazione di fascia più alta con CPU Core i9-12950HX, GPU RTX A5500 e schermo touchscreen OLED 16:10 a 2400p per circa 7000 dollari. Le SKU inferiori scendono a Core i7-12850HX o RTX A4500, ma tutte le opzioni sono dotate dello stesso touchscreen IPS a 2400p. Al contrario, il più sottile Precision 7670 può arrivare solo alla GPU RTX A2000.
I concorrenti in questo spazio includono altre workstation mobili da 16 pollici come il modelloMSI CreatorPro Z16P,HP ZBook Studio 16oLenovo ThinkPad P1 G4.
Altre recensioni Dell:
Potenziali concorrenti a confronto
Punteggio | Data | Modello | Peso | Altezza | Dimensione | Risoluzione | Miglior Prezzo |
|---|---|---|---|---|---|---|---|
| 89.1 % | 12/2022 | Dell Precision 7000 7670 Performance i9-12950HX, RTX A5500 Laptop GPU | 2.8 kg | 25.95 mm | 16.00" | 3840x2400 | |
| 84.3 % | 11/2022 | MSI CreatorPro Z16P B12UKST i7-12700H, RTX A3000 Laptop GPU | 2.4 kg | 19 mm | 16.00" | 2560x1600 | |
| 90.1 % | 11/2022 | HP ZBook Studio 16 G9 62U04EA i7-12800H, RTX A2000 Laptop GPU | 1.8 kg | 19 mm | 16.00" | 3840x2400 | |
| 82.9 % | 10/2022 | HP ZBook Firefly 16 G9-6B897EA i7-1265U, T550 Laptop GPU | 2 kg | 19.2 mm | 16.00" | 1920x1200 | |
| 89.3 % | Lenovo ThinkPad P1 G4-20Y4Z9DVUS i7-11800H, T1200 Laptop GPU | 1.8 kg | 17.7 mm | 16.00" | 2560x1600 | ||
| 88.4 % | 10/2022 | Dell Precision 7670 i7-12850HX, RTX A2000 Laptop GPU | 2.7 kg | 24.7 mm | 16.00" | 3840x2400 |
Caso
La lunghezza e la larghezza sono identiche a quelle del modello Precision 7670, mentre lo spessore e il peso sono stati aumentati rispettivamente di 1,3 mm e di 100 grammi. È difficile notare le differenze nella pratica, poiché il normale Precision 7670 è già una delle workstation mobili più spesse e pesanti.
Lettore di schede SD
| SD Card Reader | |
| average JPG Copy Test (av. of 3 runs) | |
| Lenovo ThinkPad P1 G4-20Y4Z9DVUS (Angelbird AV Pro V60) | |
| Dell Precision 7670 (Toshiba Exceria Pro SDXC 64 GB UHS-II) | |
| Dell Precision 7000 7670 Performance (Toshiba Exceria Pro SDXC 64 GB UHS-II) | |
| MSI CreatorPro Z16P B12UKST (AV Pro V60) | |
| HP ZBook Studio 16 G9 62U04EA (Angelbird AV PRO V60) | |
| maximum AS SSD Seq Read Test (1GB) | |
| Dell Precision 7670 (Toshiba Exceria Pro SDXC 64 GB UHS-II) | |
| Dell Precision 7000 7670 Performance (Toshiba Exceria Pro SDXC 64 GB UHS-II) | |
| Lenovo ThinkPad P1 G4-20Y4Z9DVUS (Angelbird AV Pro V60) | |
| MSI CreatorPro Z16P B12UKST (AV Pro V60) | |
| HP ZBook Studio 16 G9 62U04EA (Angelbird AV PRO V60) | |
Comunicazione
Sebbene l'Intel AX211 sia presente su tutte le SKU Precision 7670, le prestazioni sono più lente del previsto sulla nostra unità di test specifica. La velocità media di trasmissione è di soli 891 Mbps quando è accoppiato alla nostra rete a 6 Ghz, rispetto a quasi il doppio di quella dell'MSI CreatorPro Z16P o dell'HP ZBook Firefly 16 G9 HP ZBook Firefly 16 G9 ciascuno con lo stesso modulo AX211. Abbiamo ripetuto questo test sei volte in due giorni diversi per essere sicuri, ma i risultati non sono migliorati.
| Networking | |
| iperf3 transmit AX12 | |
| Lenovo ThinkPad P1 G4-20Y4Z9DVUS | |
| iperf3 receive AX12 | |
| Lenovo ThinkPad P1 G4-20Y4Z9DVUS | |
| iperf3 receive AXE11000 6GHz | |
| MSI CreatorPro Z16P B12UKST | |
| HP ZBook Studio 16 G9 62U04EA | |
| HP ZBook Firefly 16 G9-6B897EA | |
| Dell Precision 7000 7670 Performance | |
| Dell Precision 7670 | |
| iperf3 receive AXE11000 | |
| Dell Precision 7000 7670 Performance | |
| iperf3 transmit AXE11000 | |
| Dell Precision 7000 7670 Performance | |
| iperf3 transmit AXE11000 6GHz | |
| MSI CreatorPro Z16P B12UKST | |
| HP ZBook Firefly 16 G9-6B897EA | |
| HP ZBook Studio 16 G9 62U04EA | |
| Dell Precision 7670 | |
| Dell Precision 7000 7670 Performance | |
Webcam


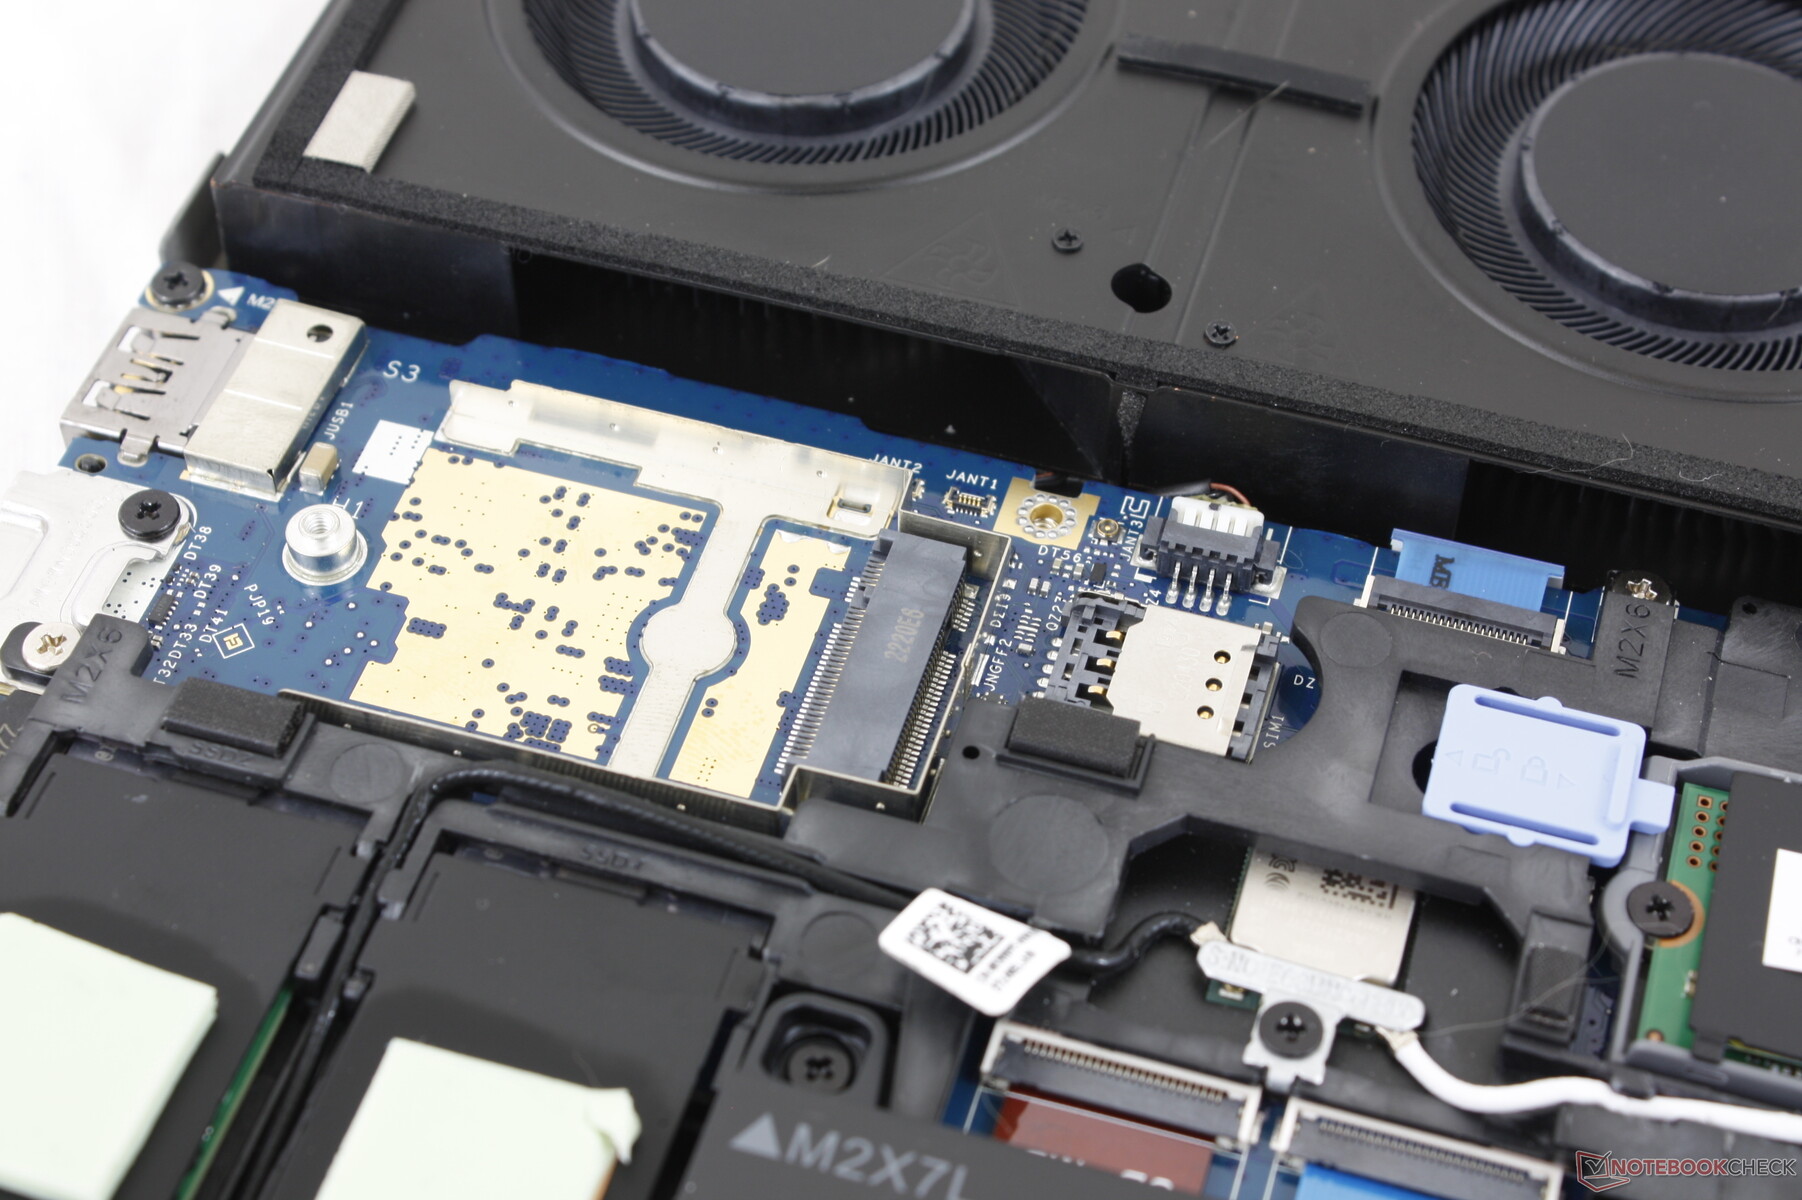
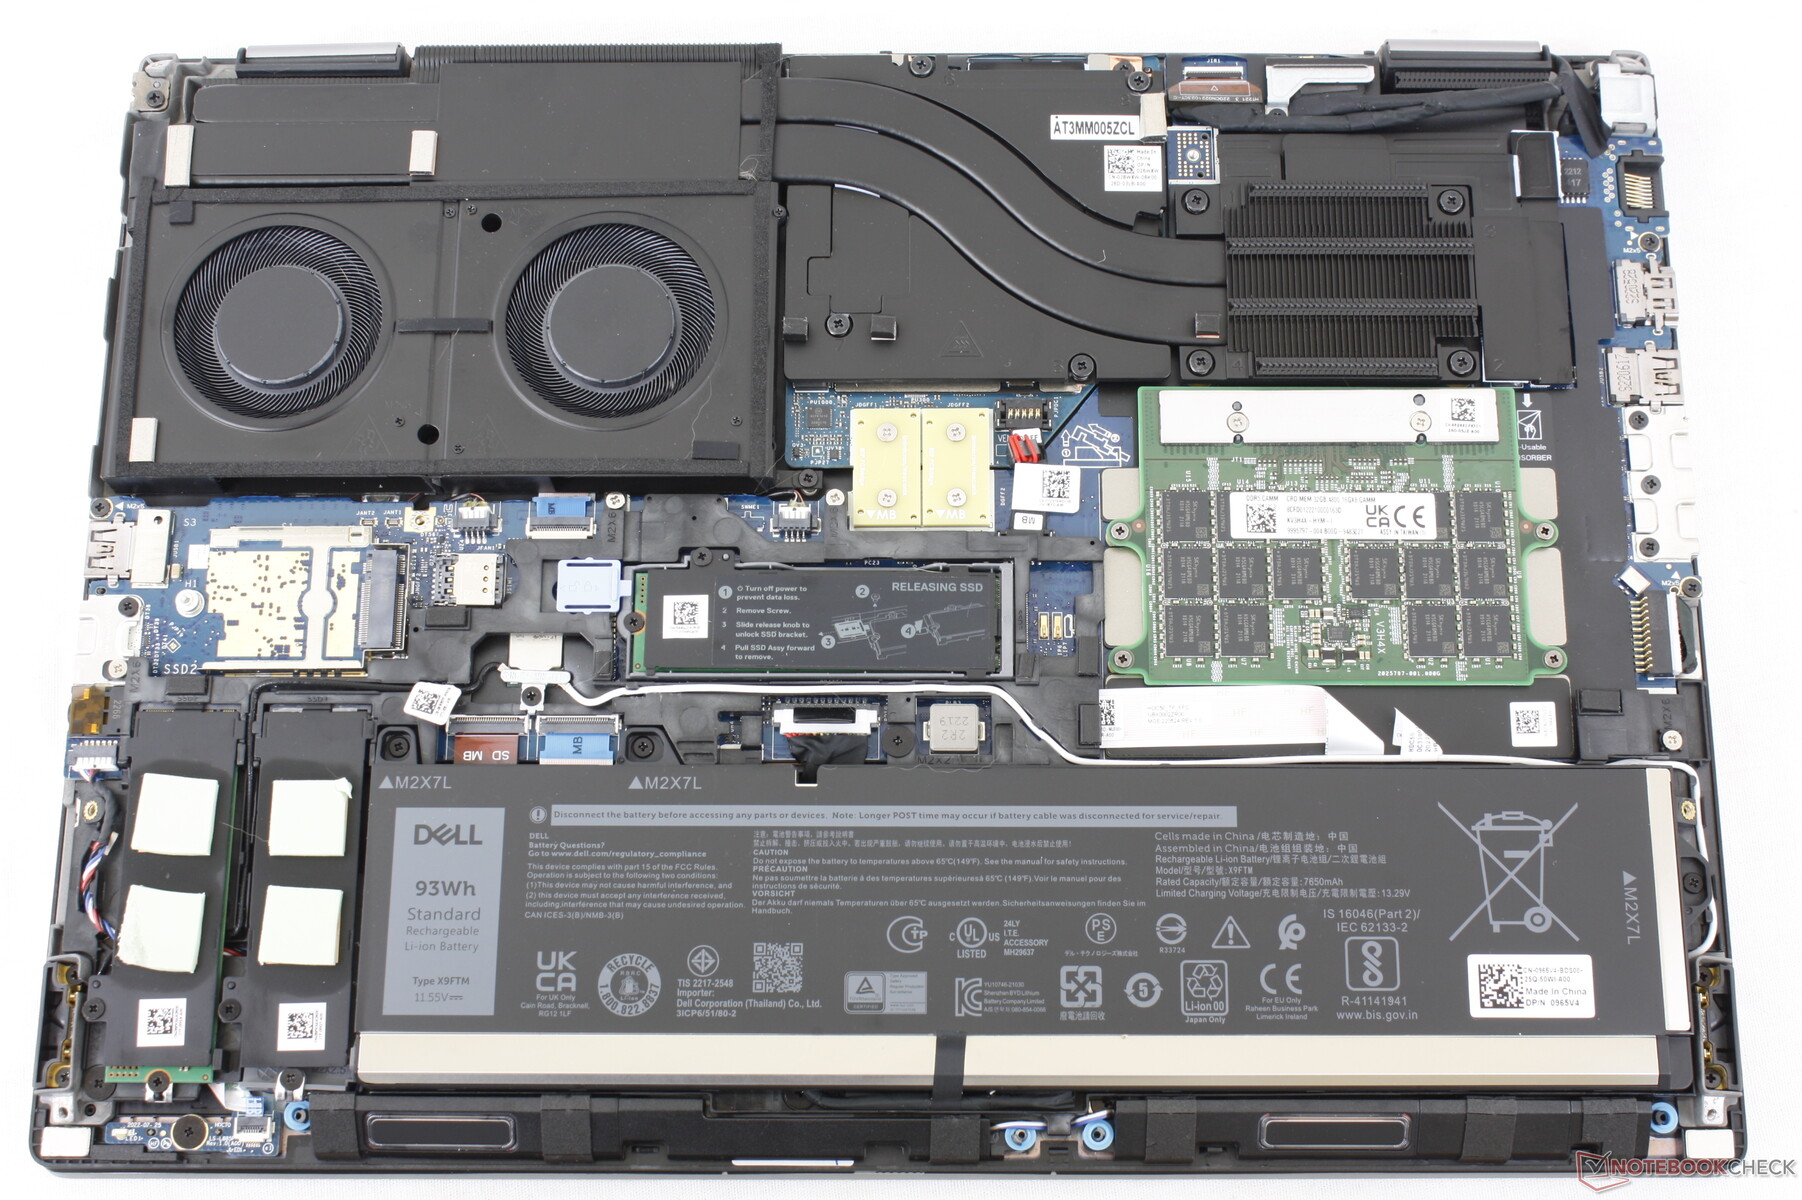
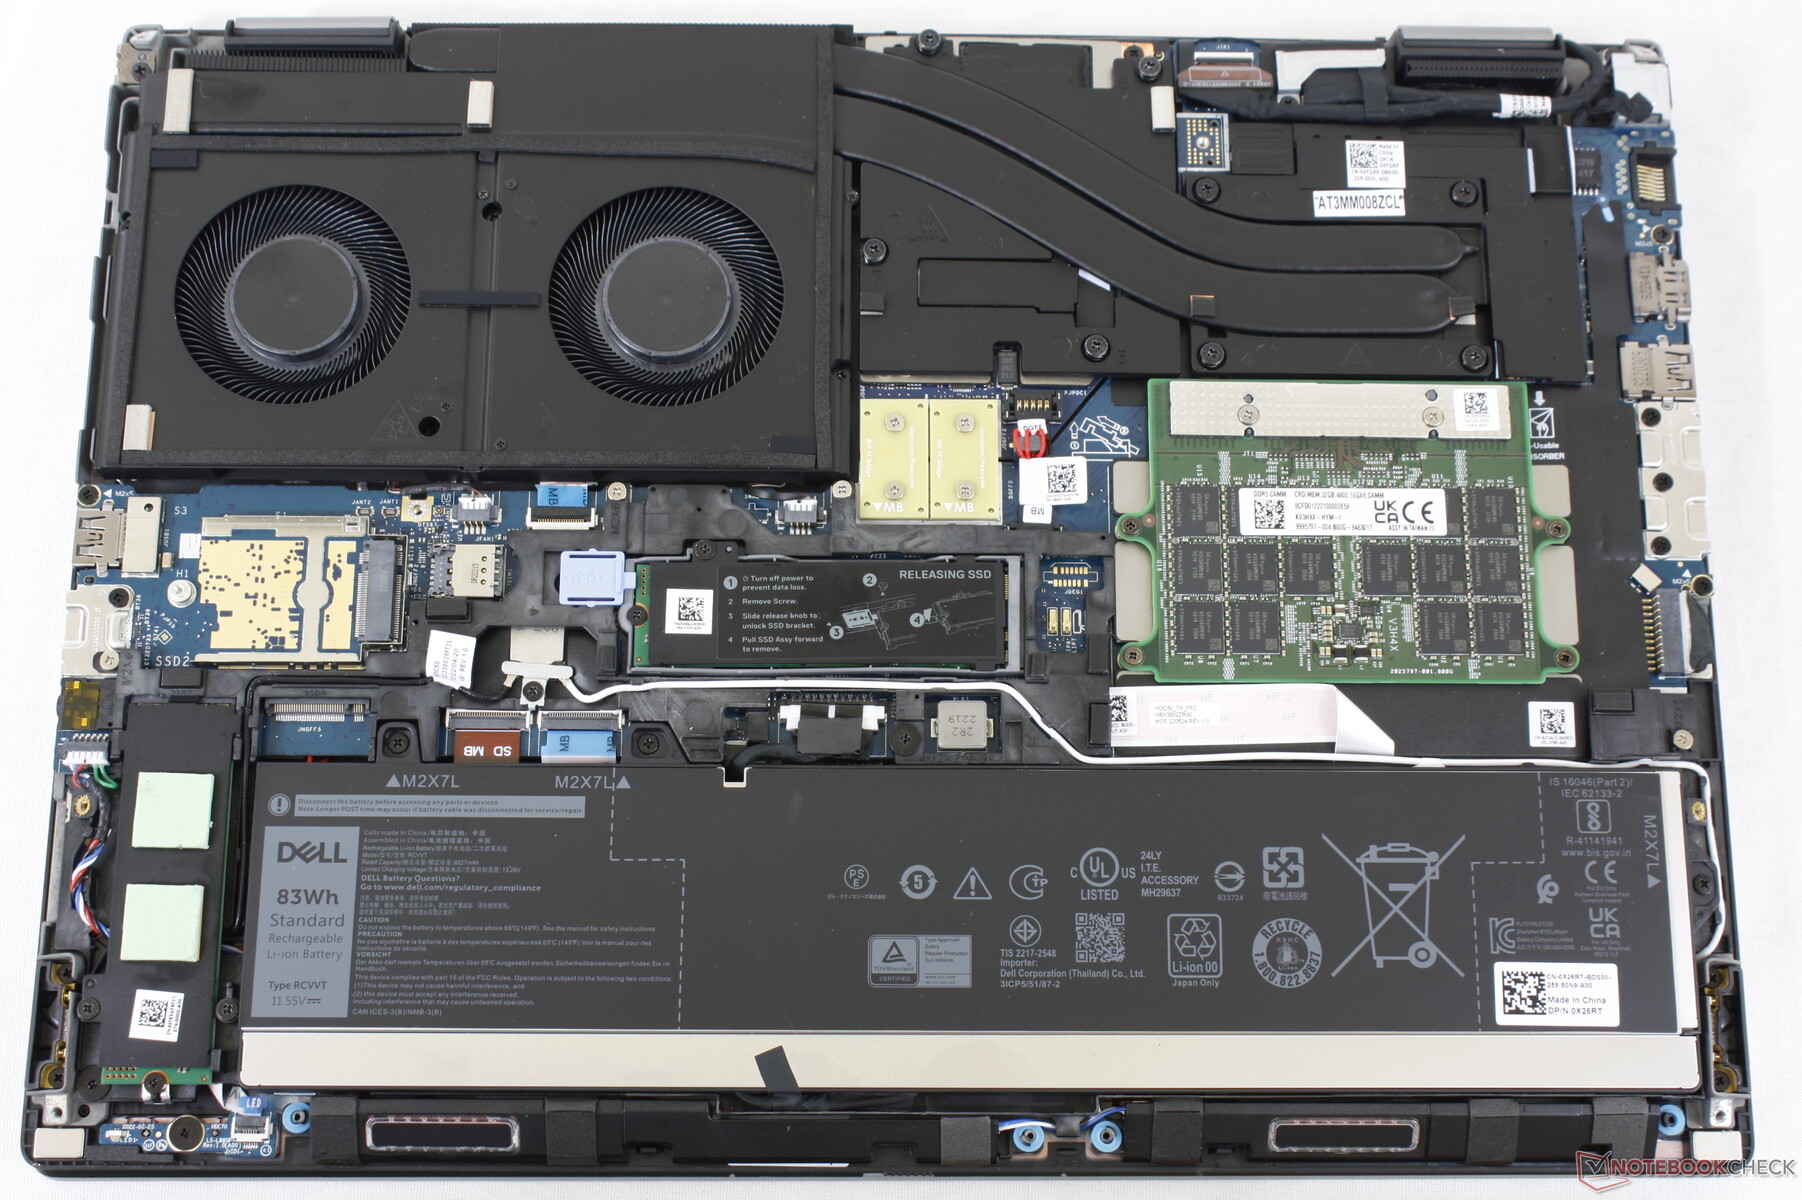
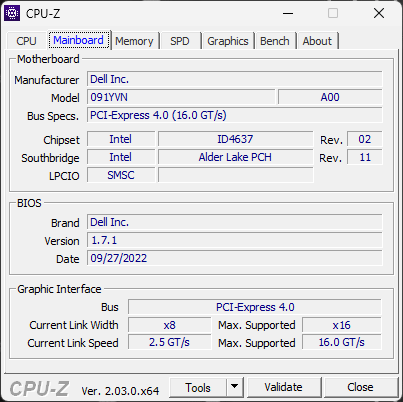
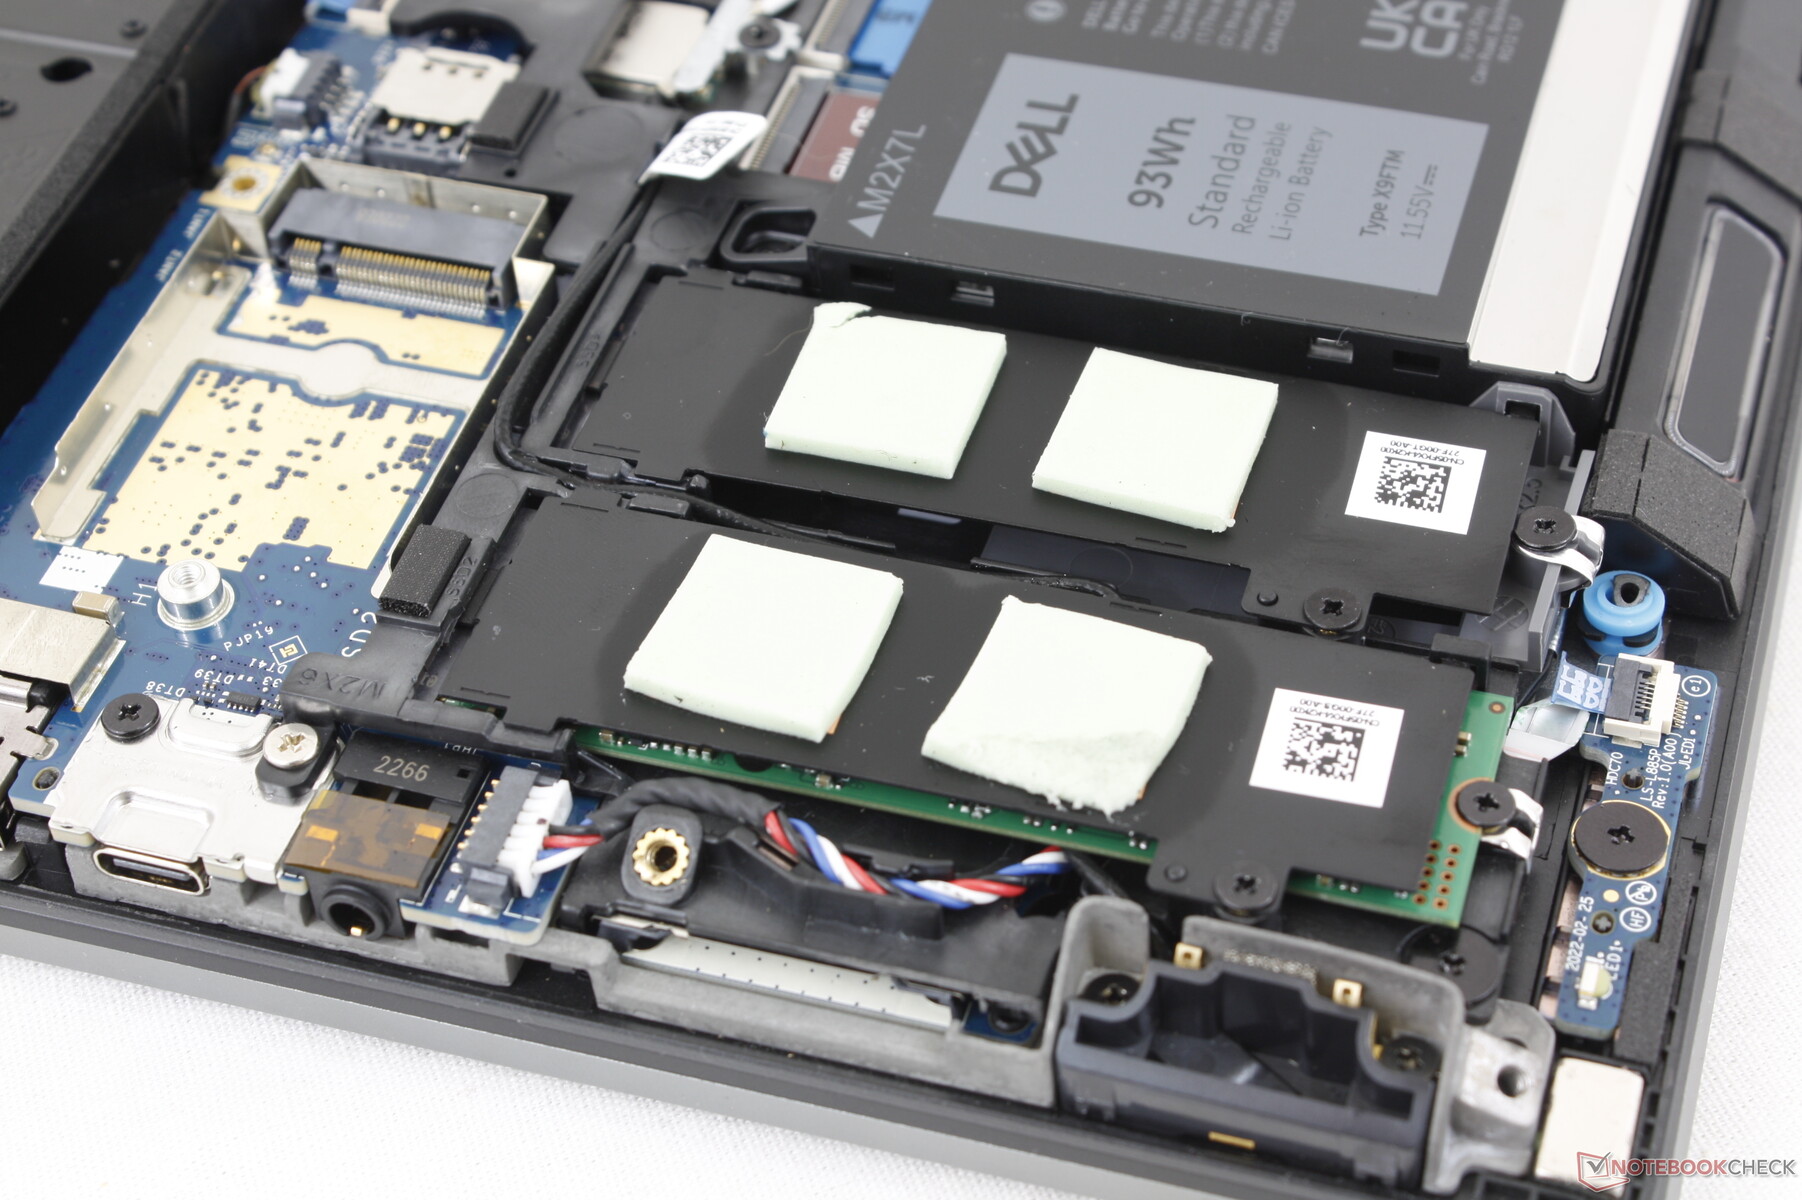
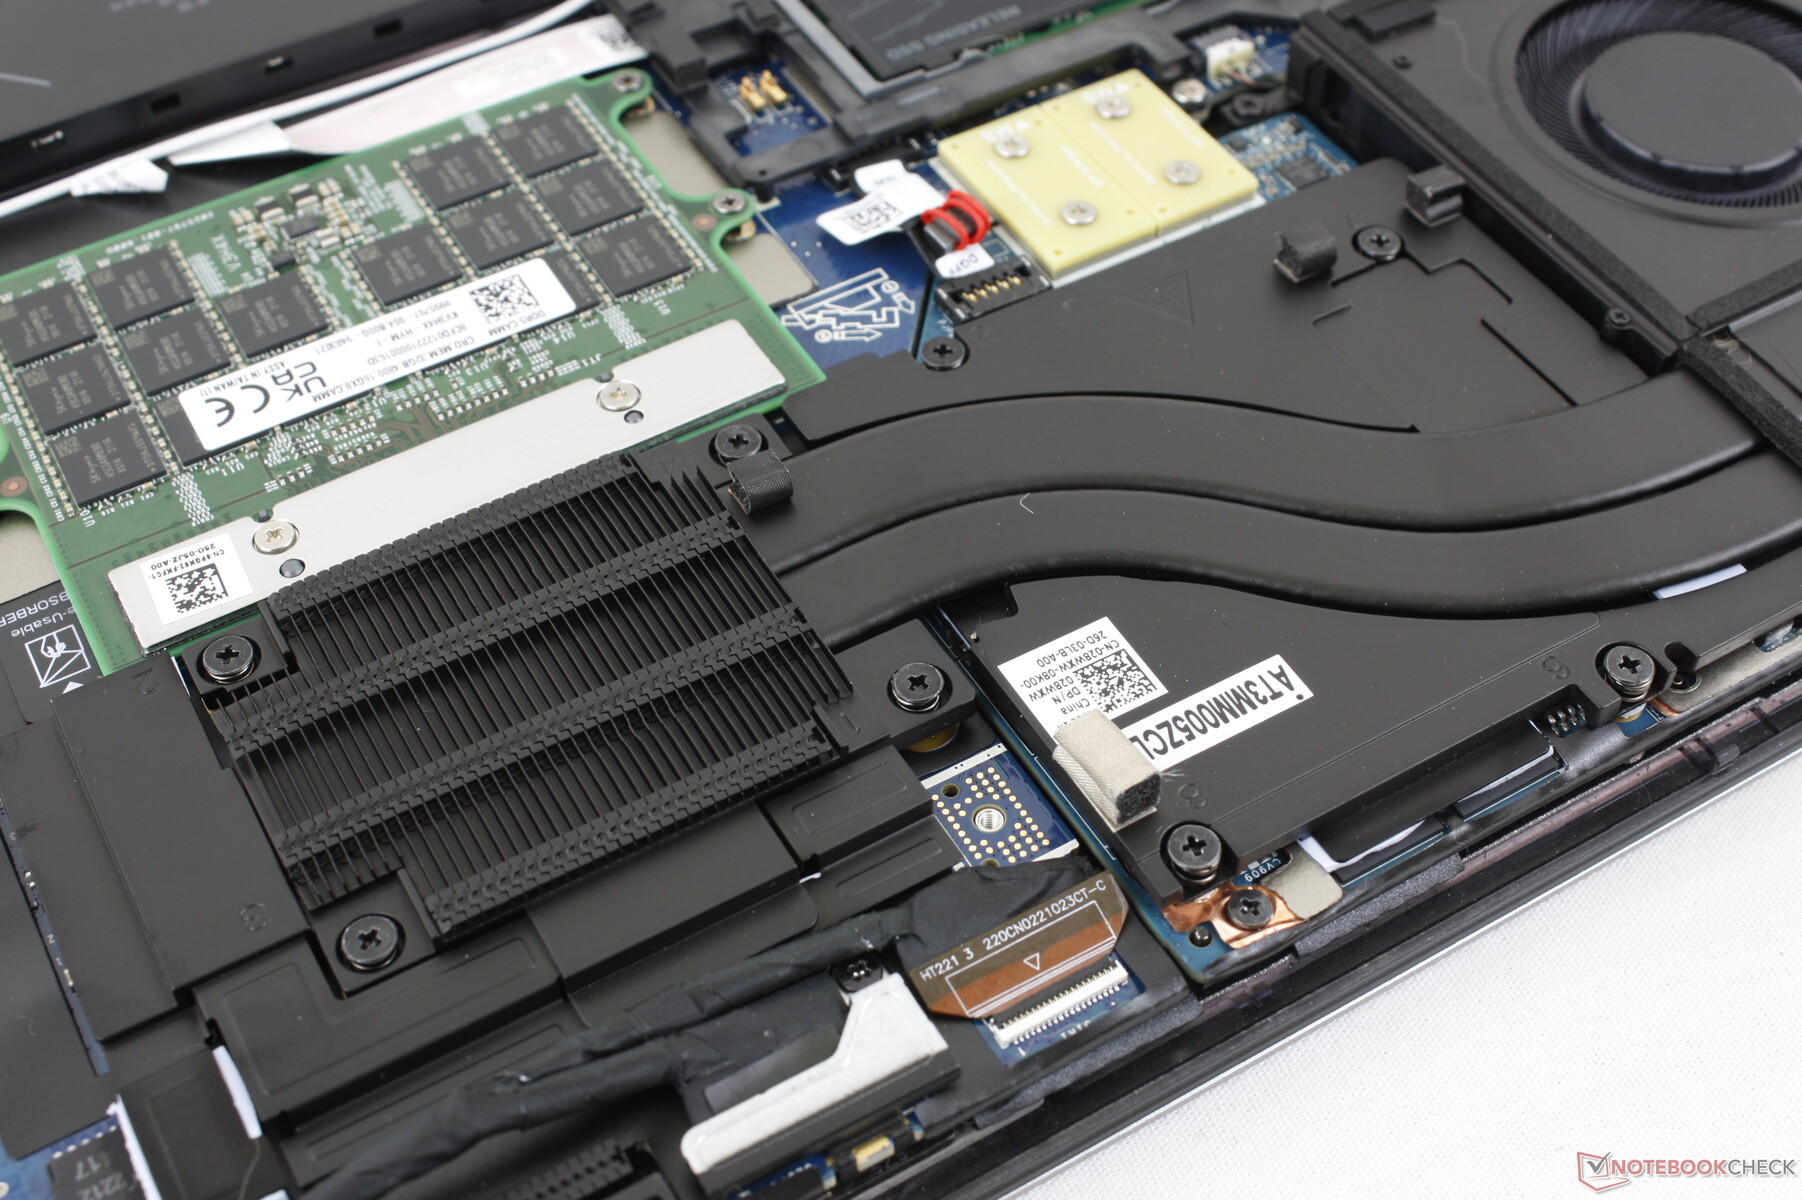
Manutenzione
Il pannello inferiore è fissato da sei viti Philips per facilitare la manutenzione. L'interno è simile a quello del più sottile Precision 7670, a parte le differenze nella capacità della batteria, nel numero di alloggiamenti disponibili e nella presenza di un piccolo dissipatore di calore.
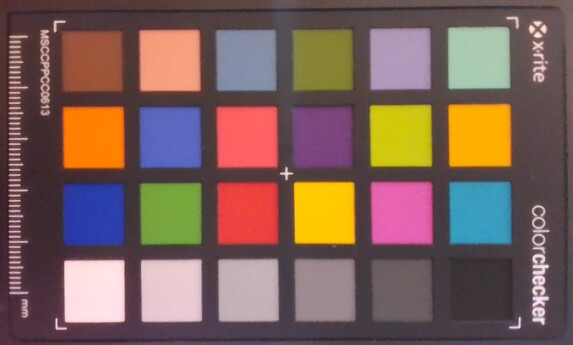
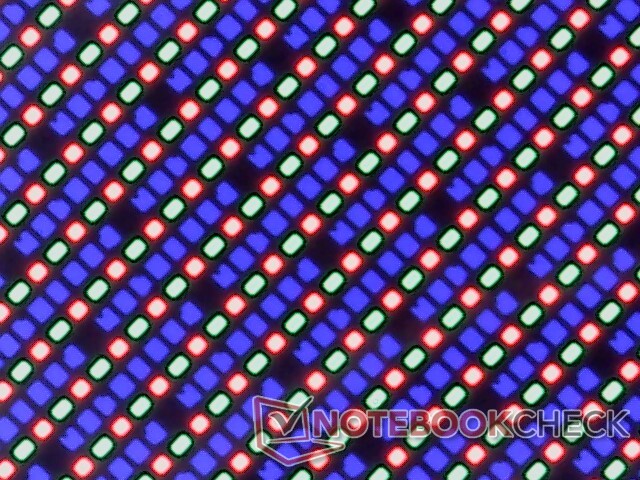
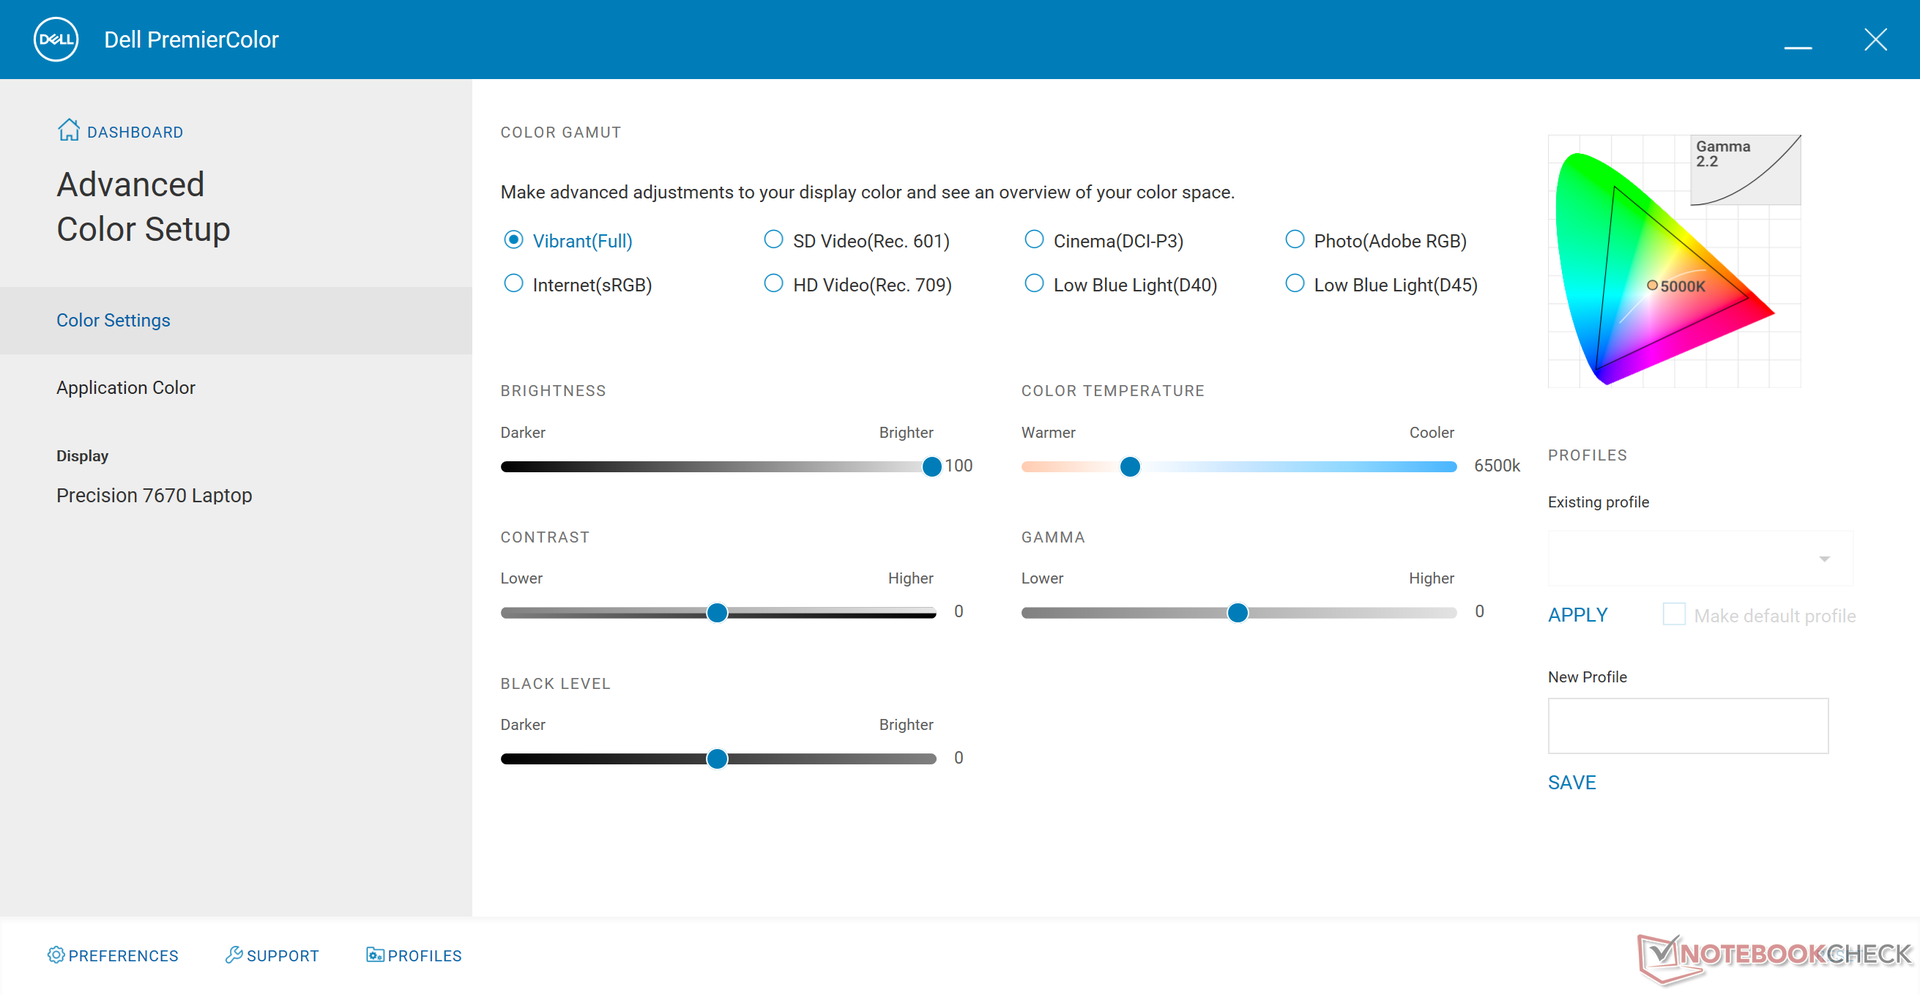
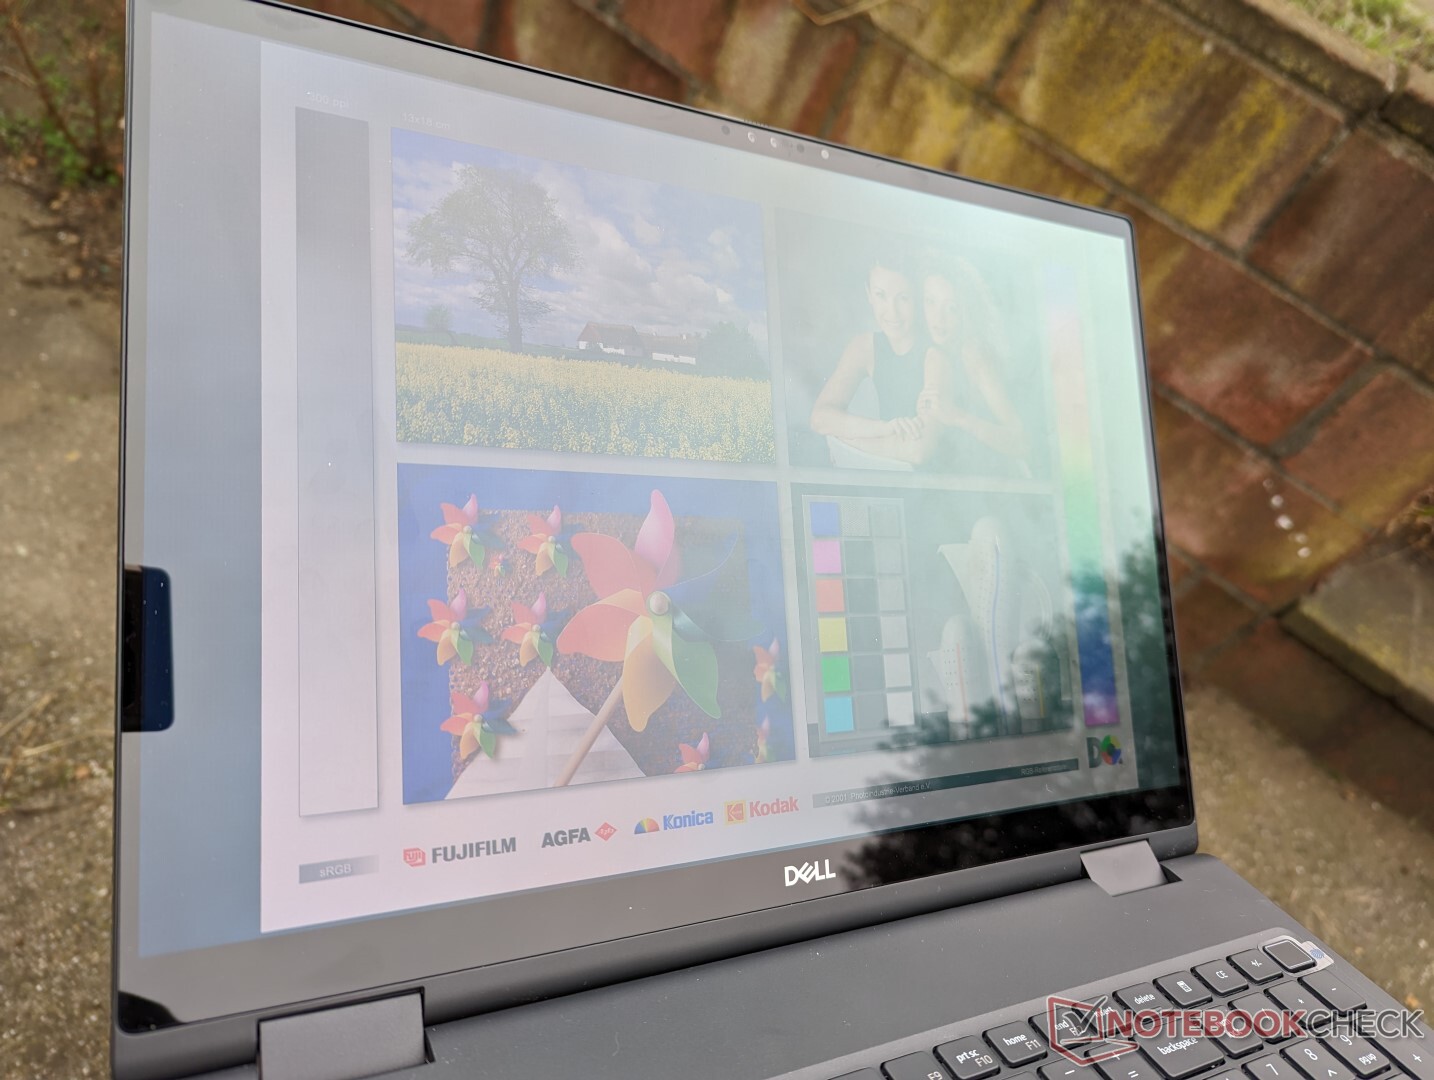
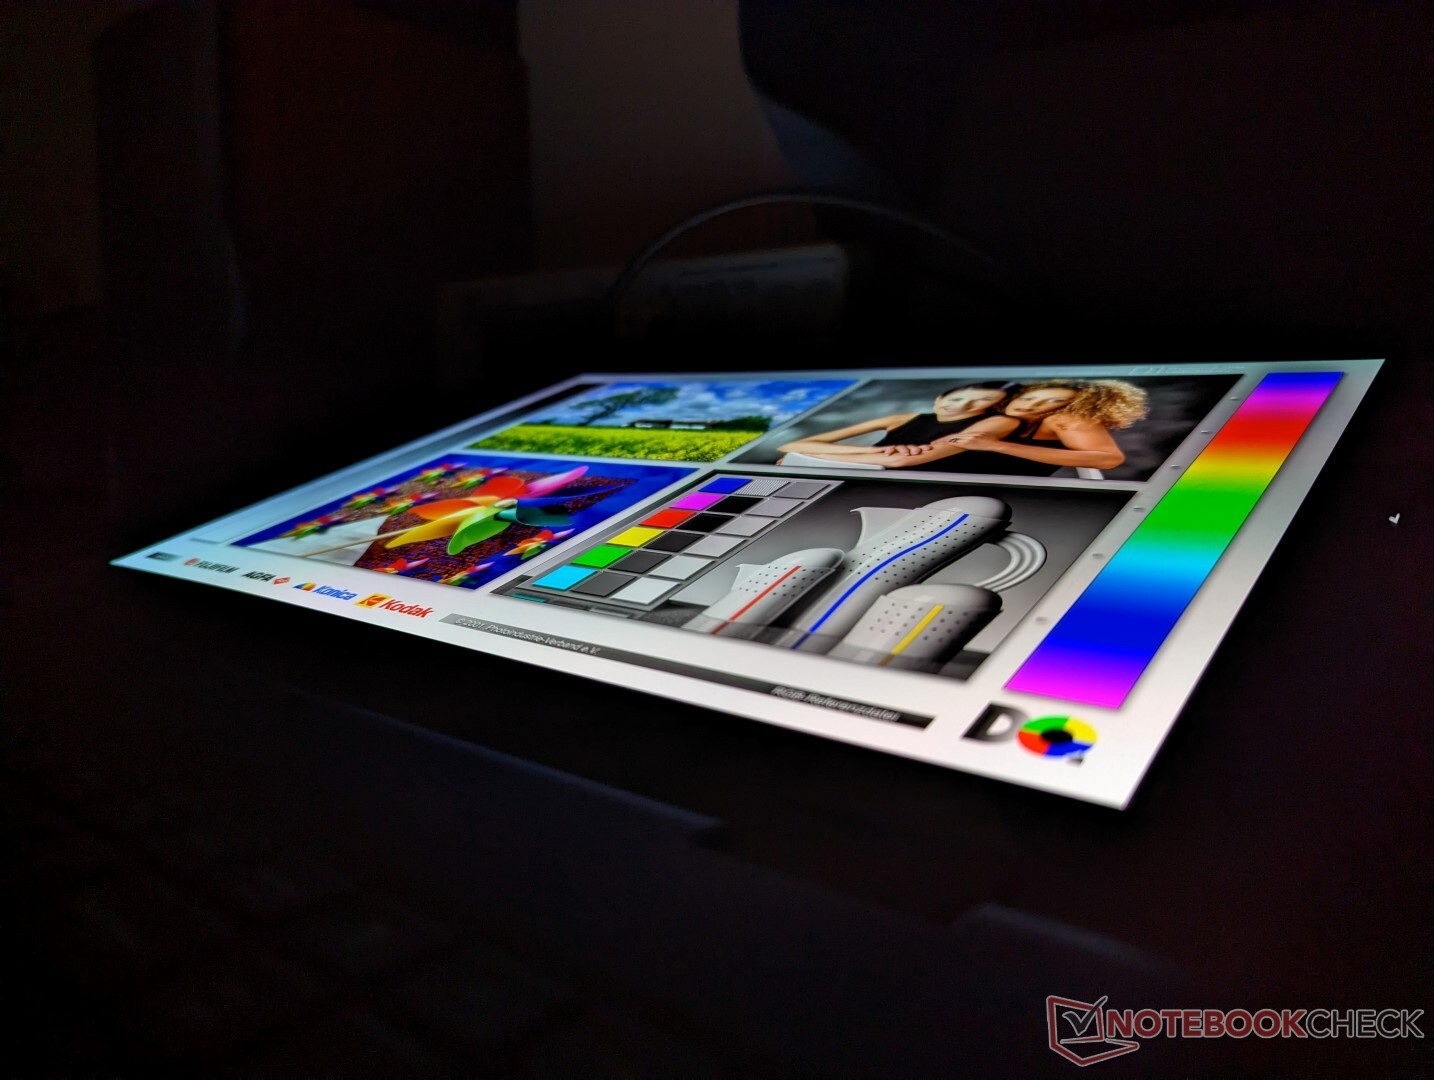
Display
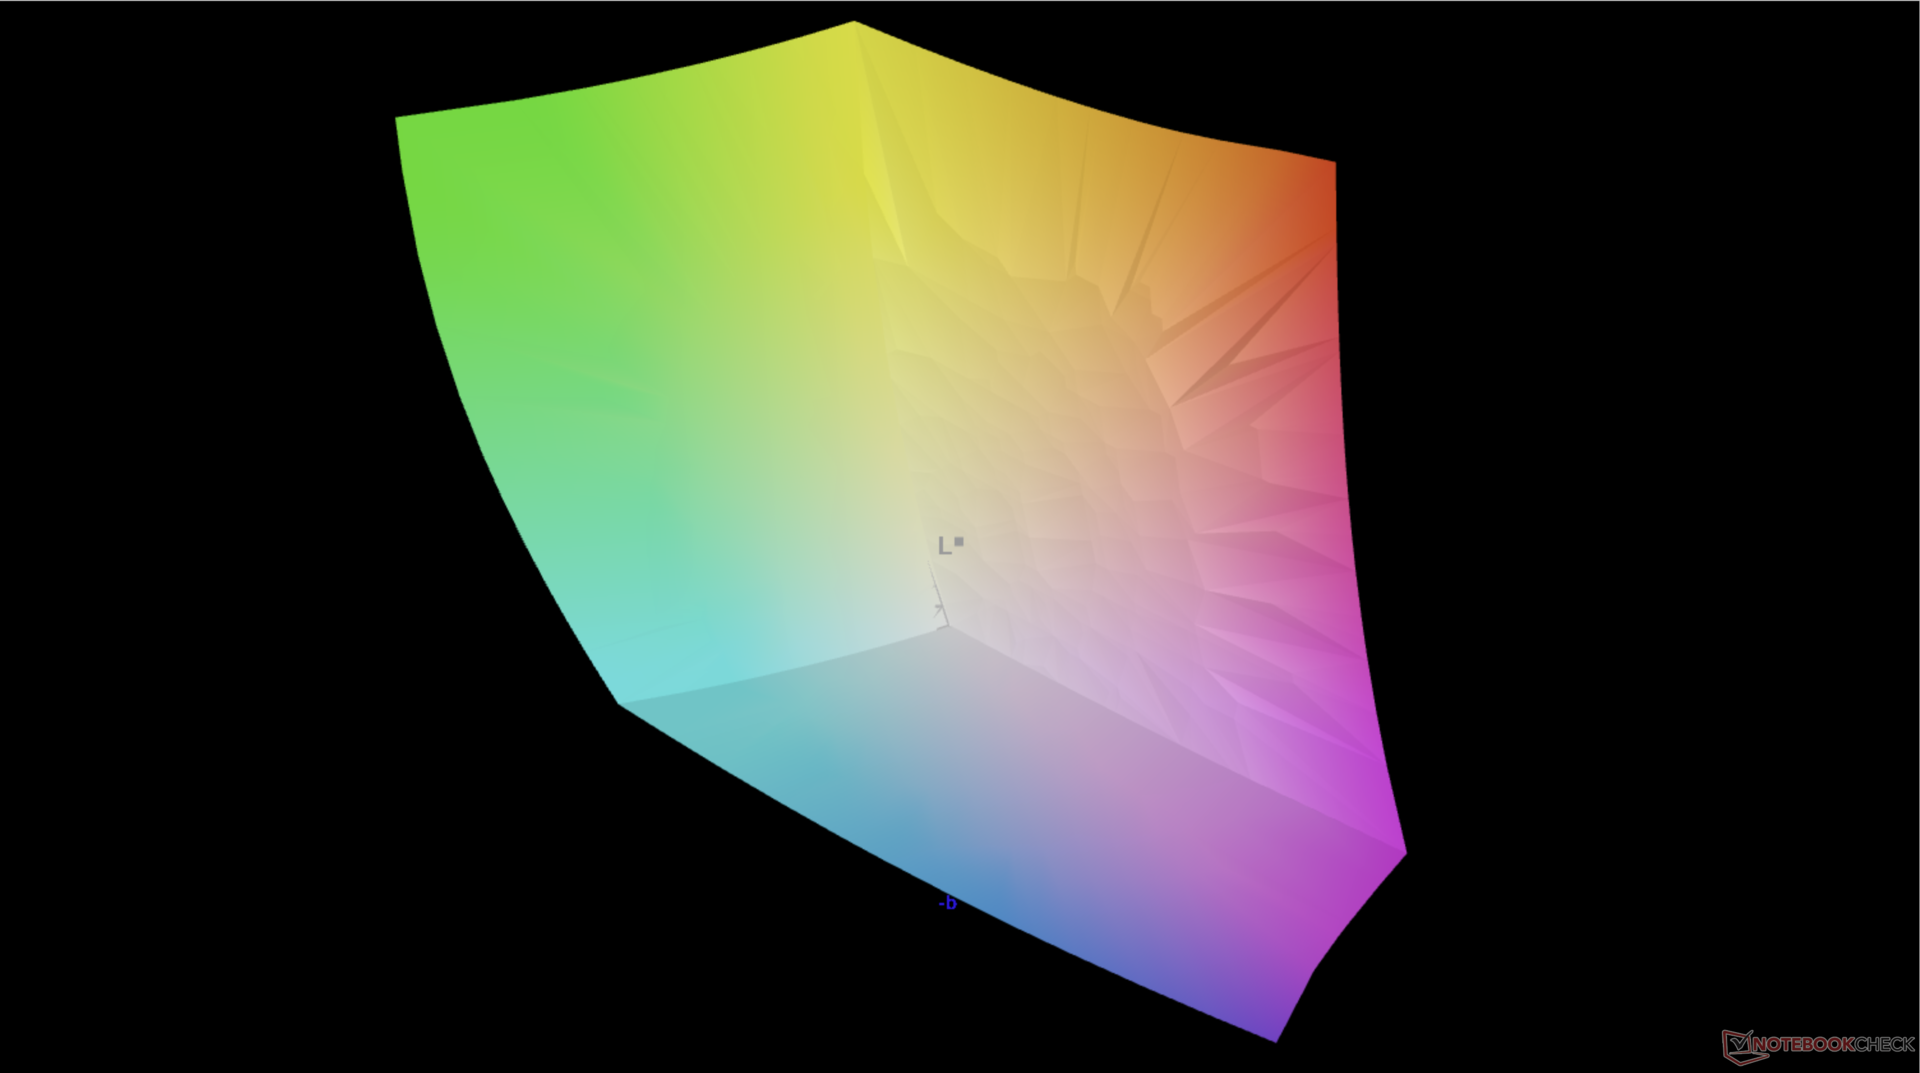
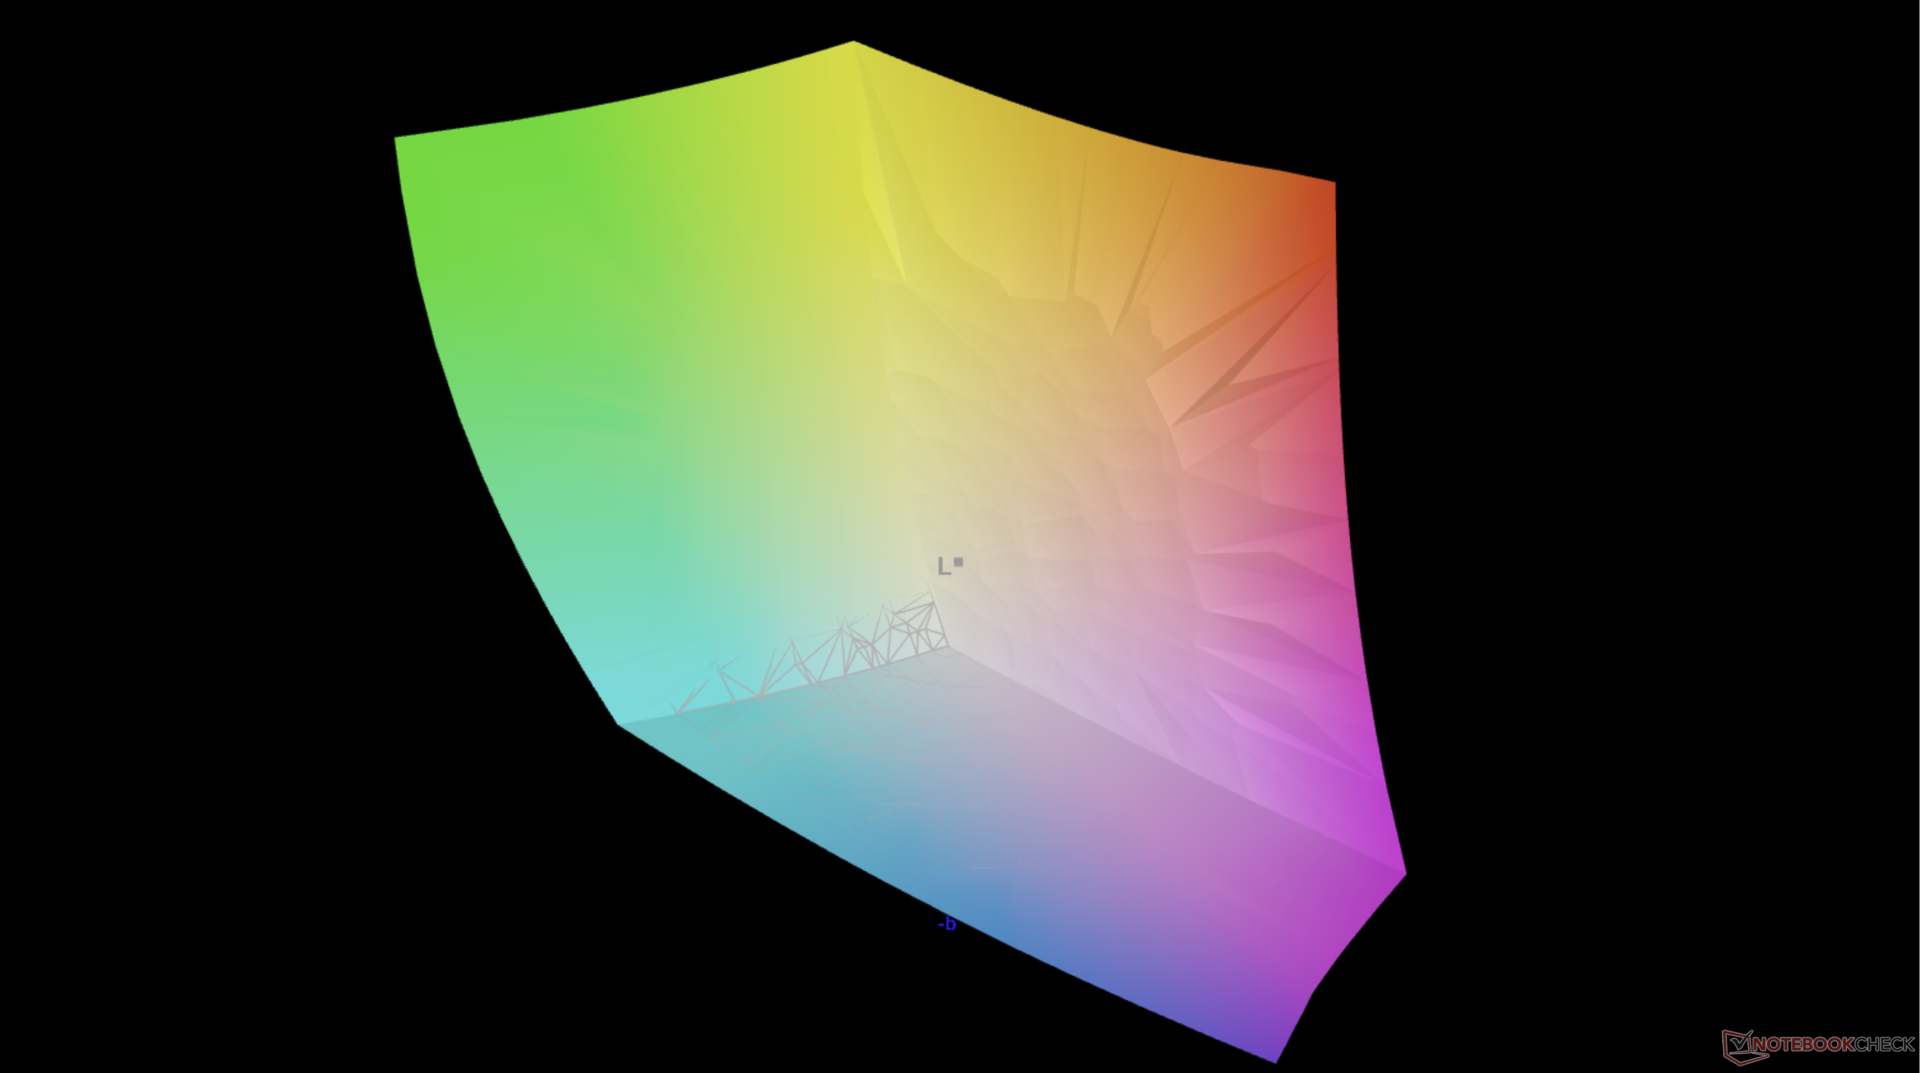
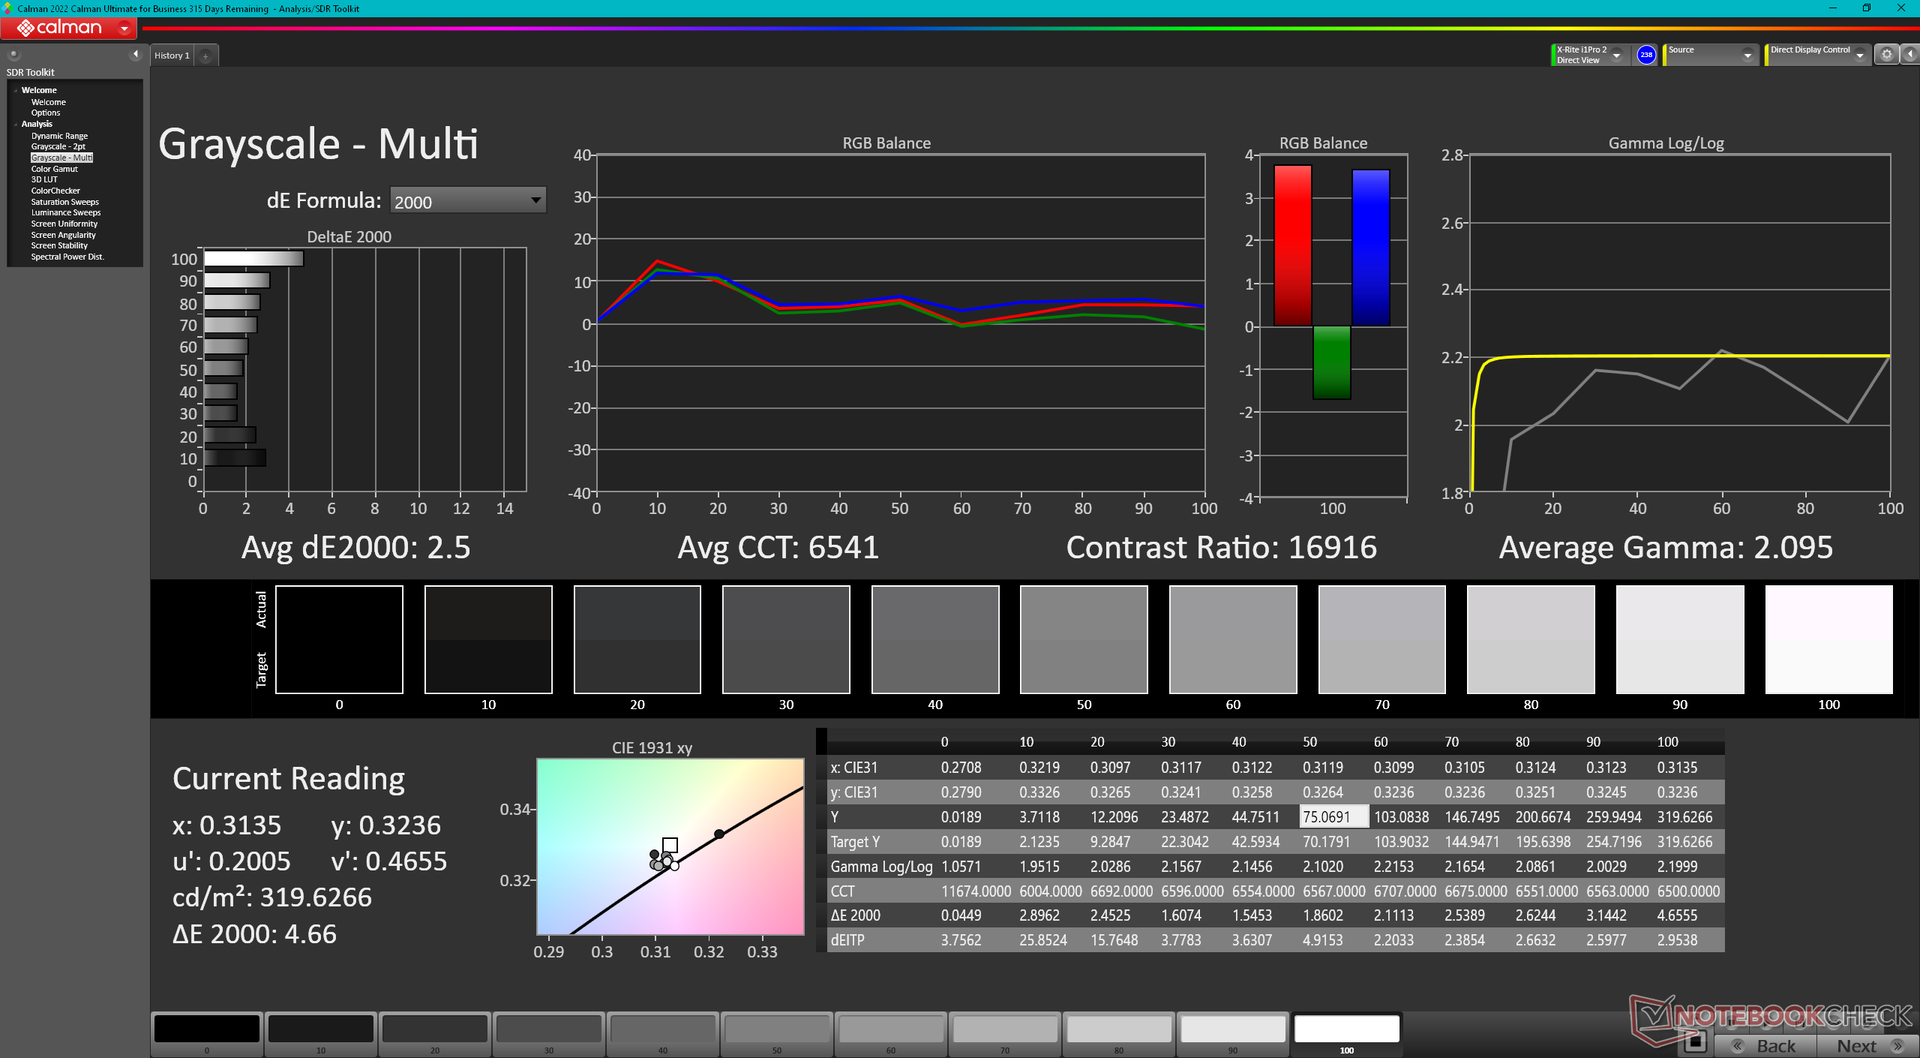
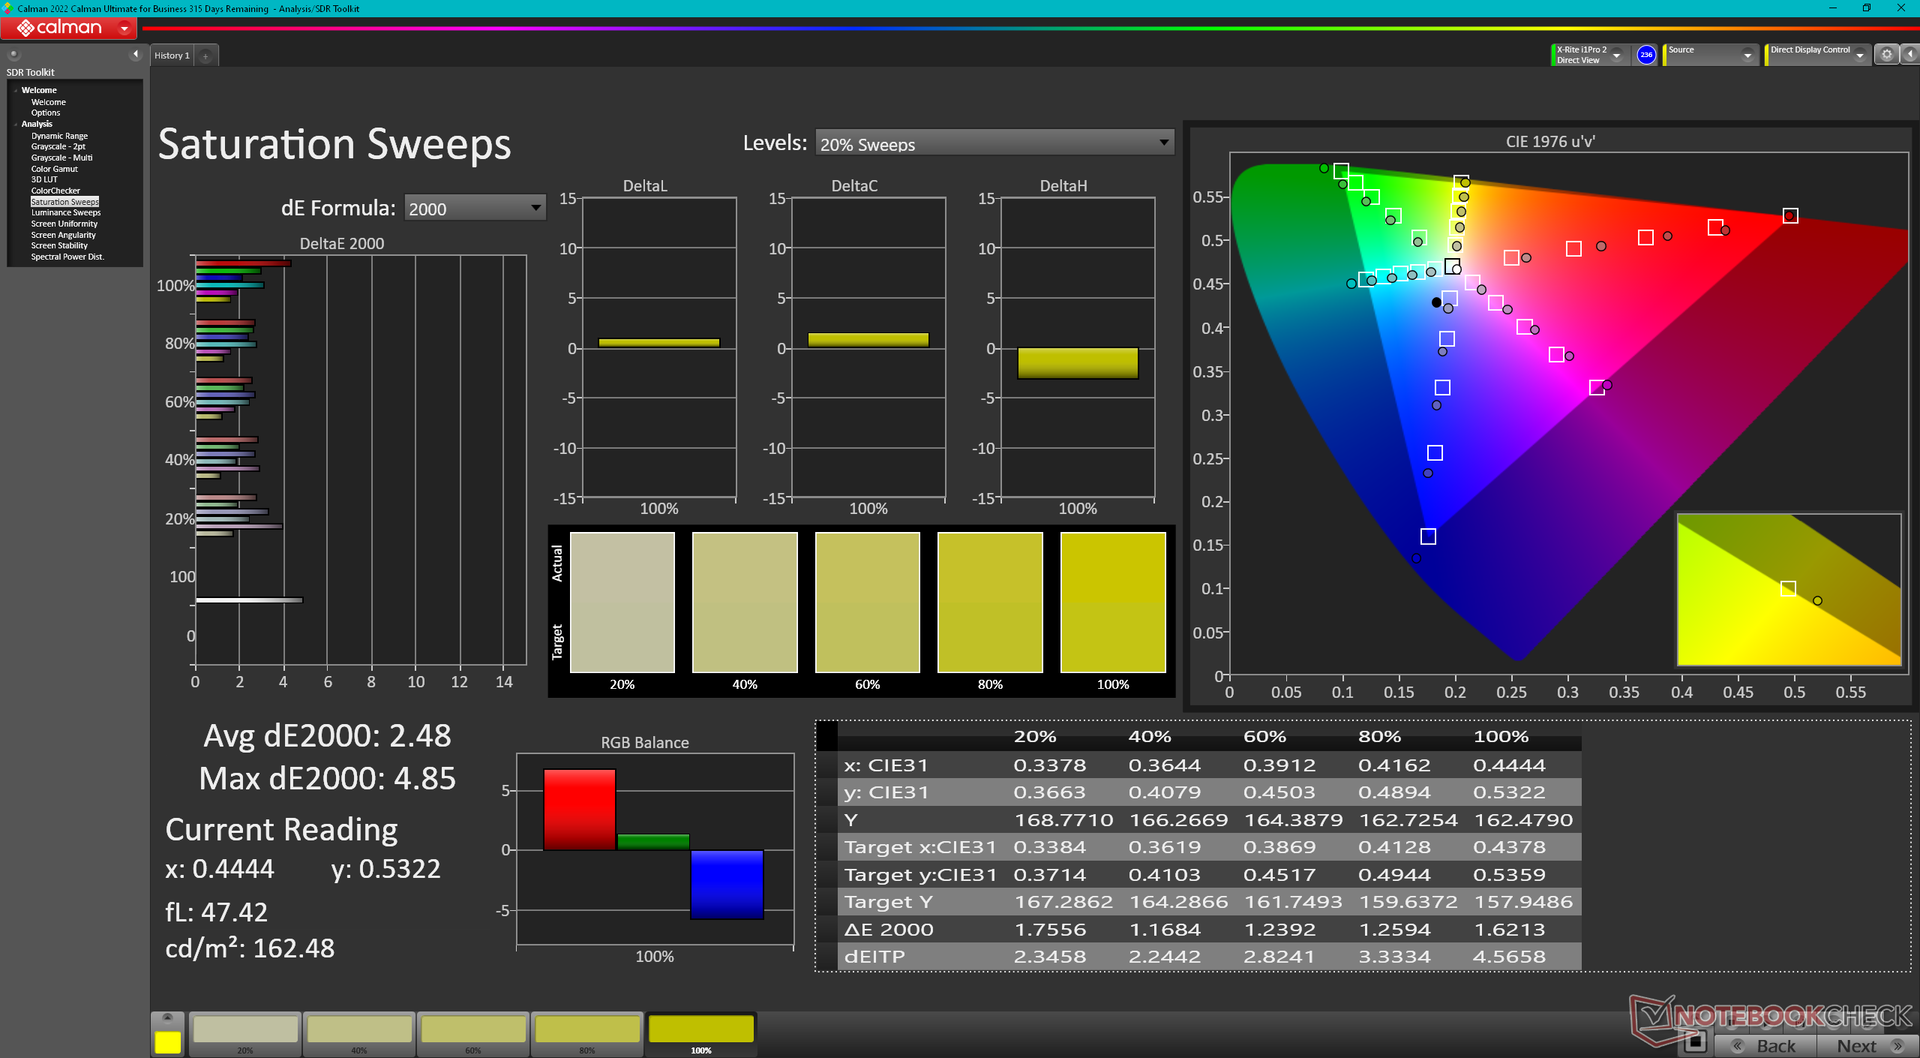
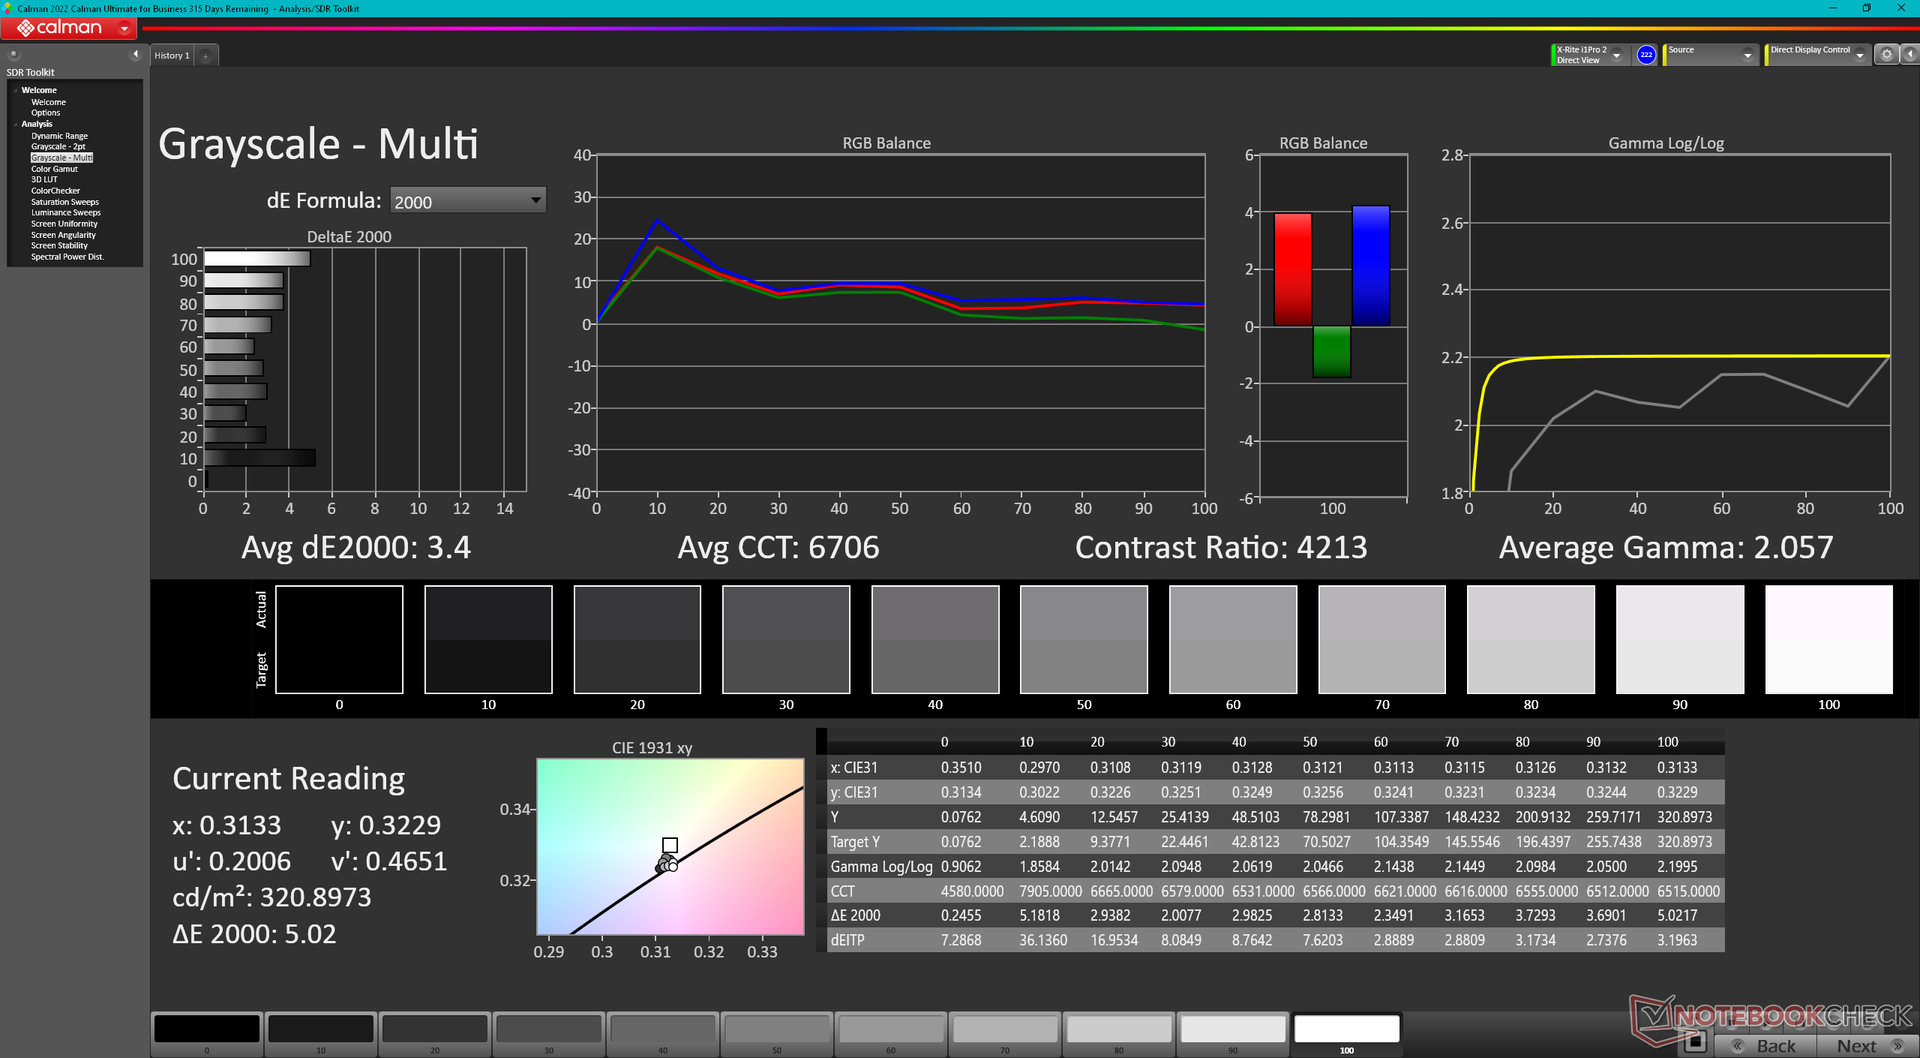
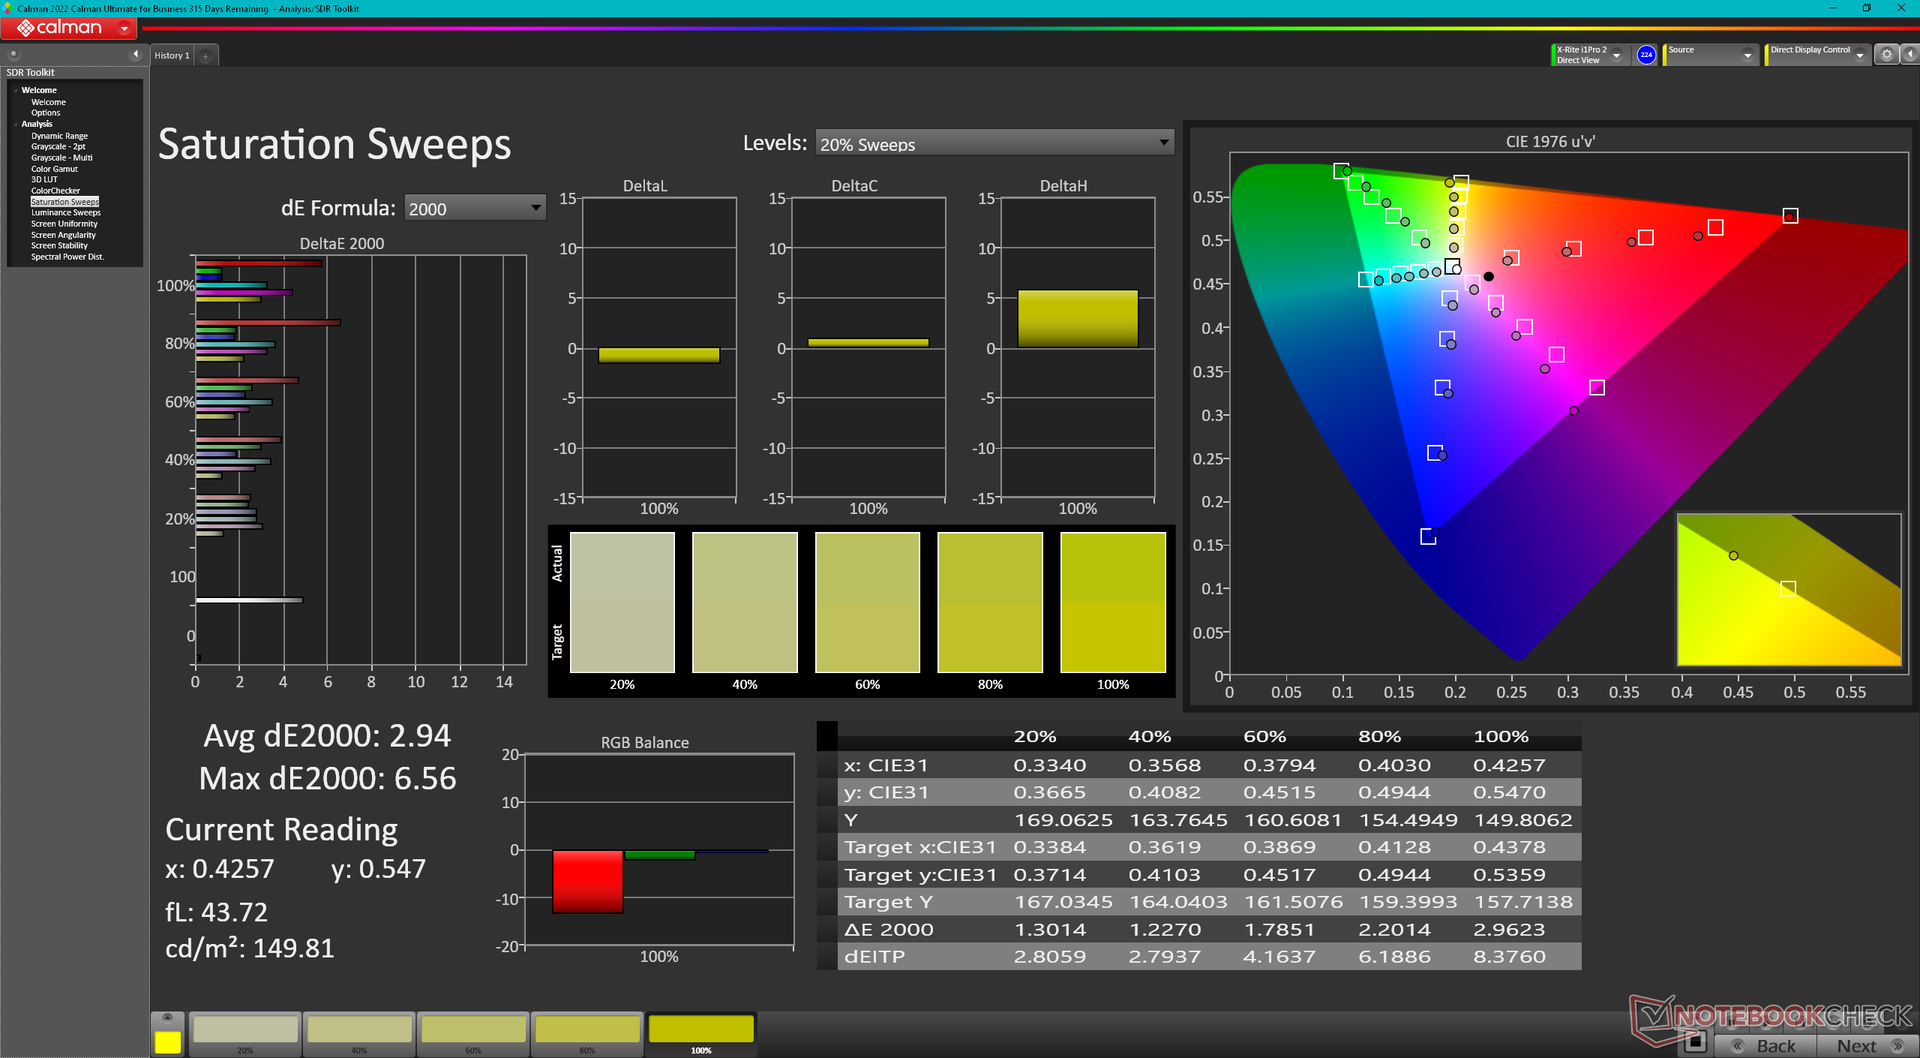
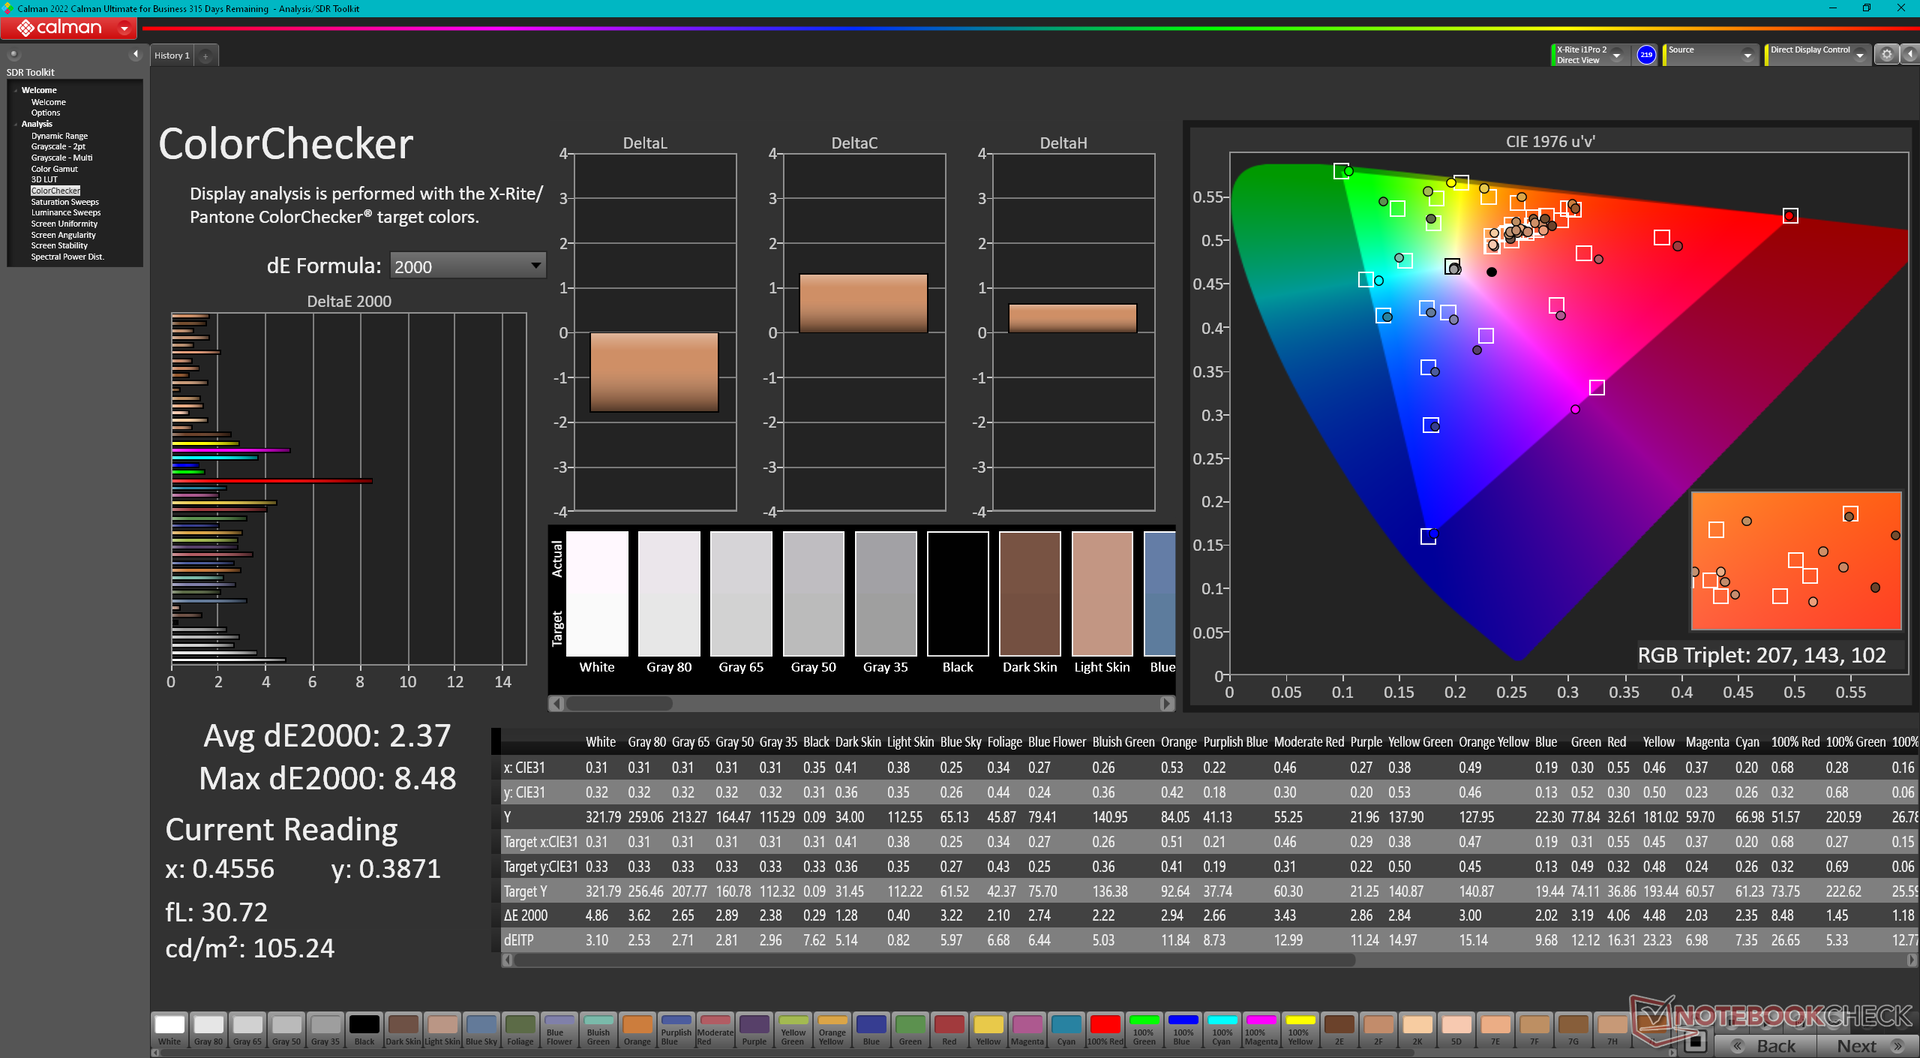
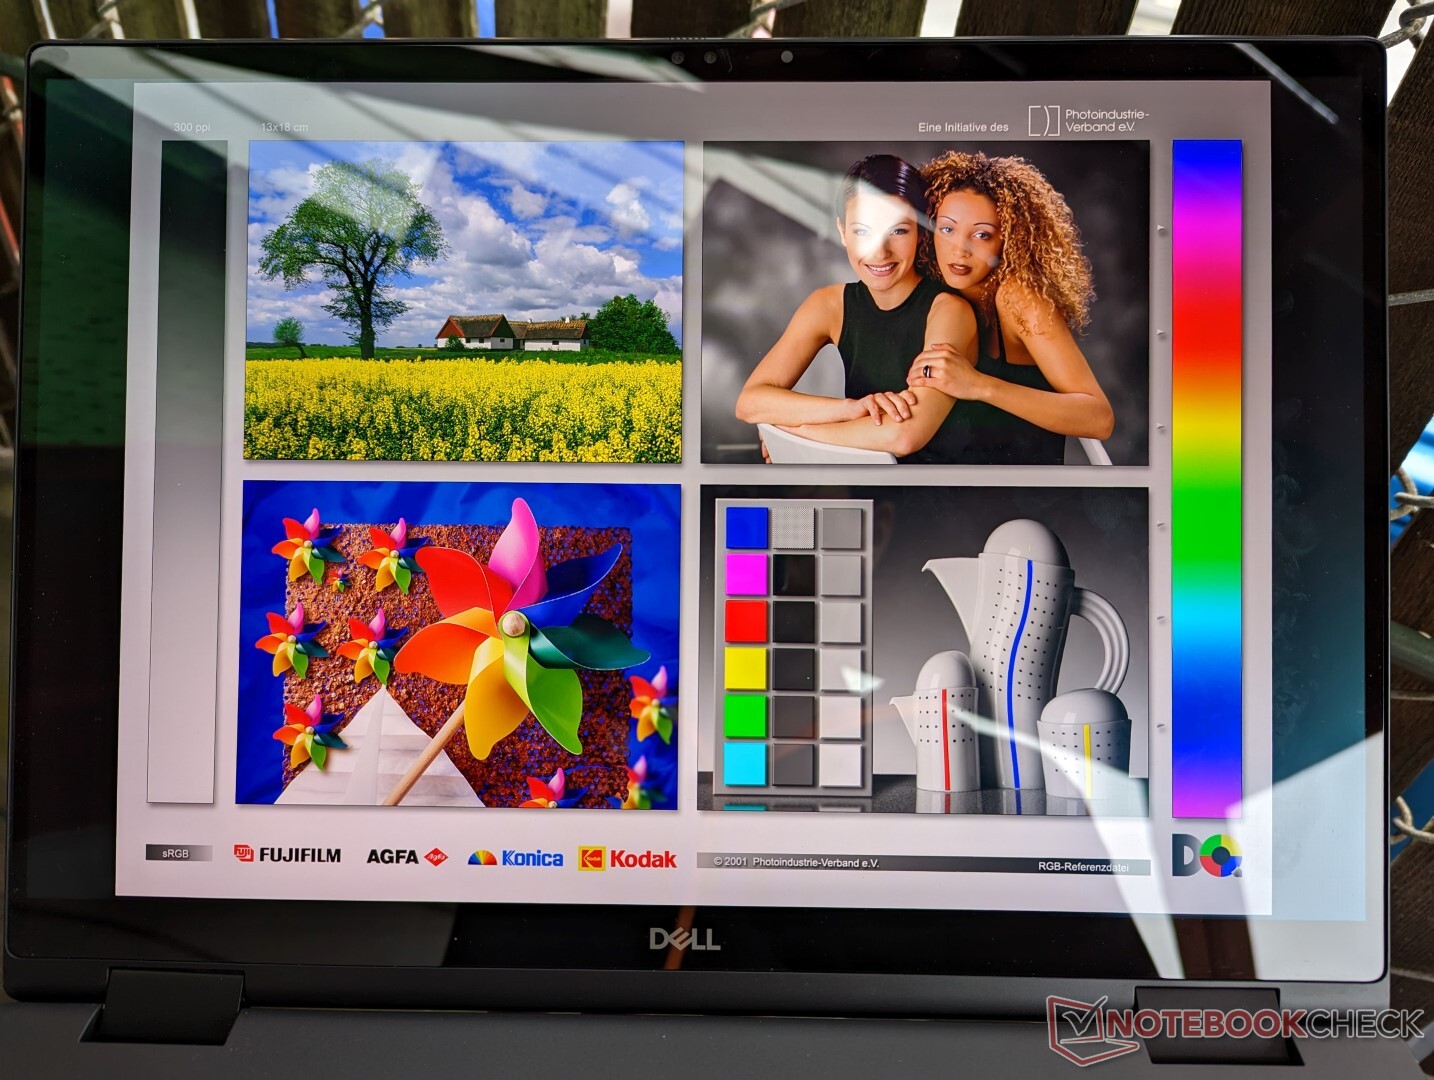
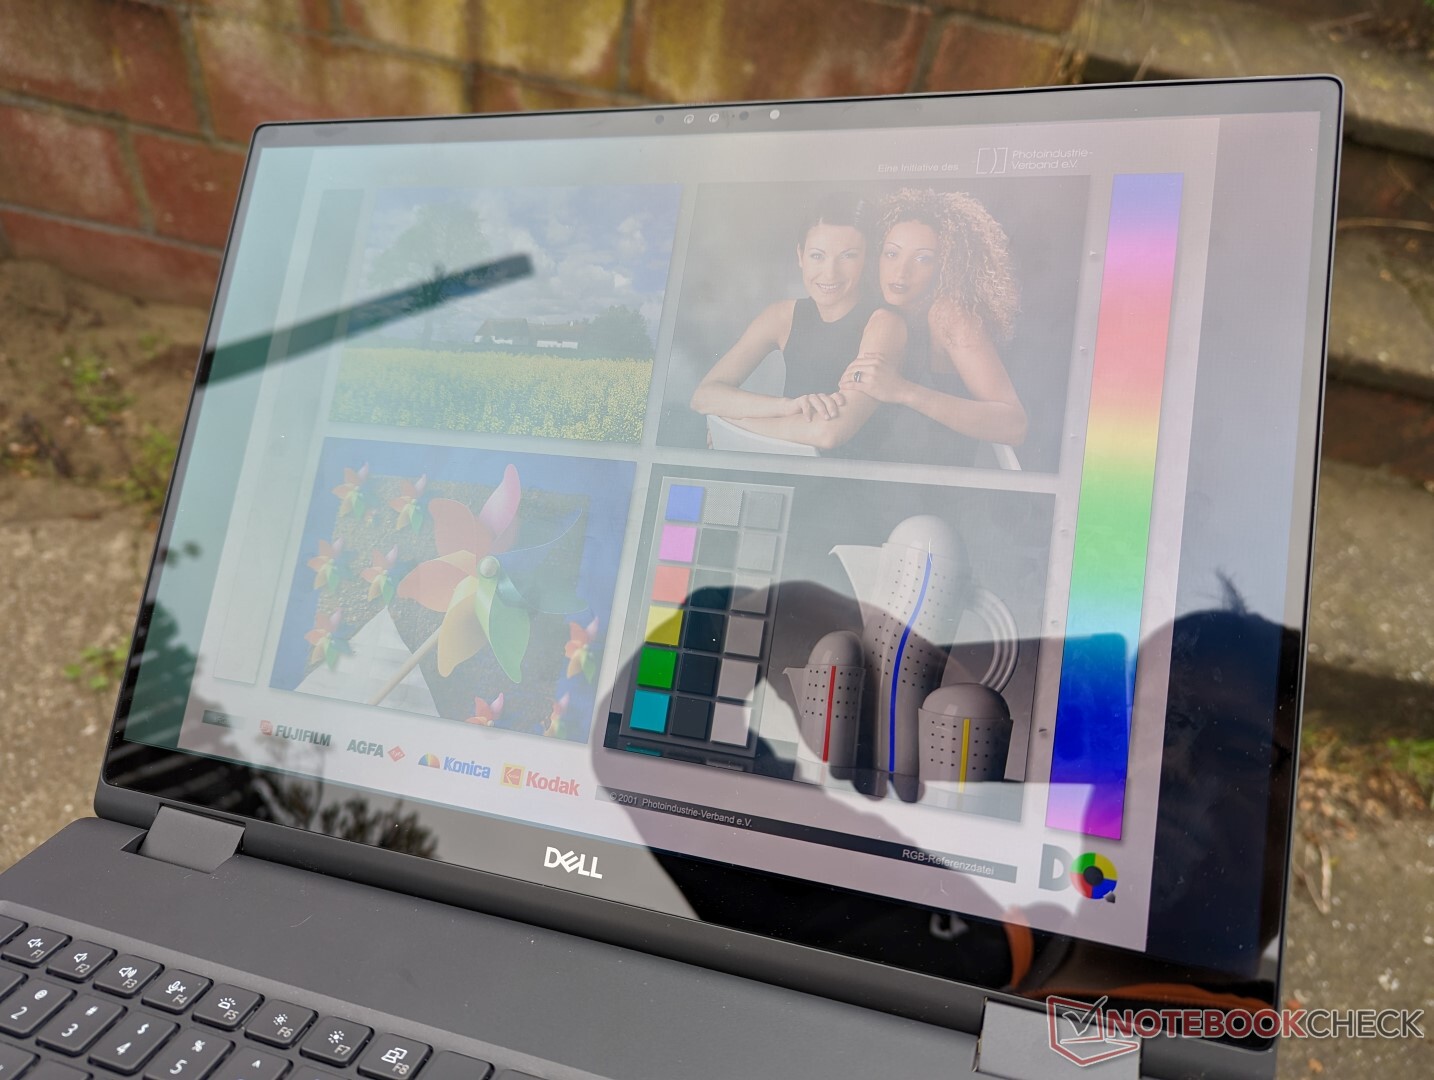
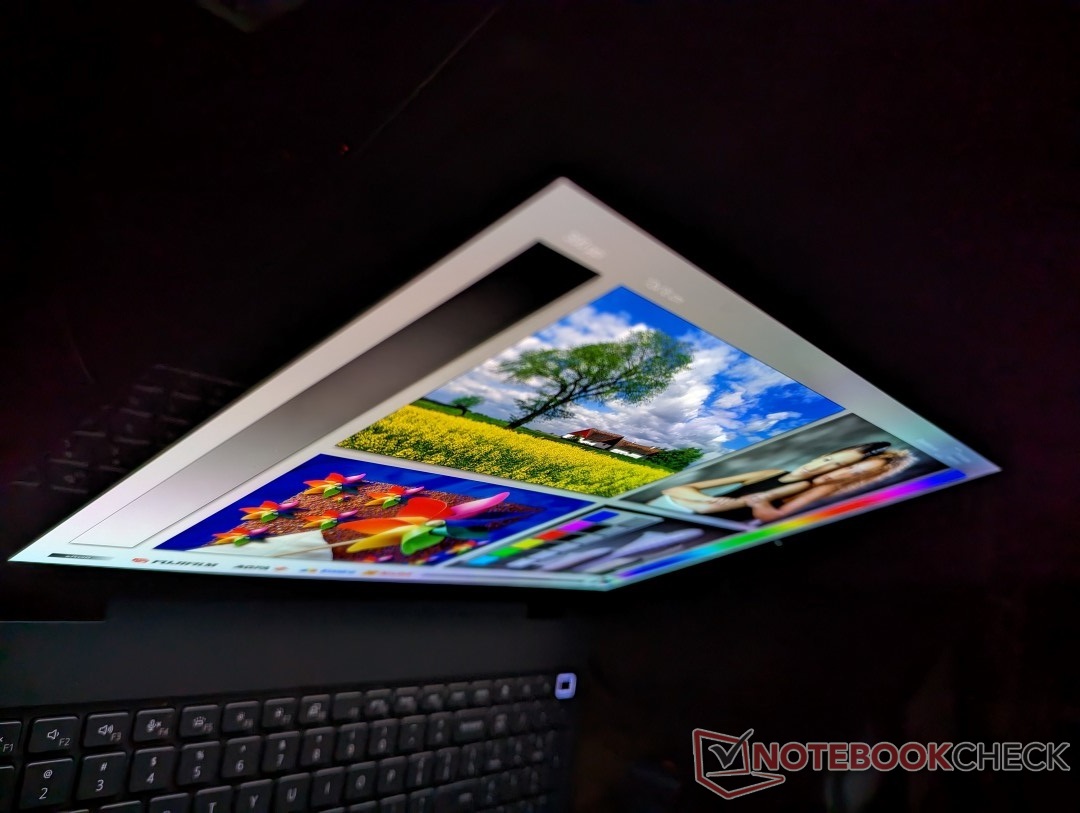
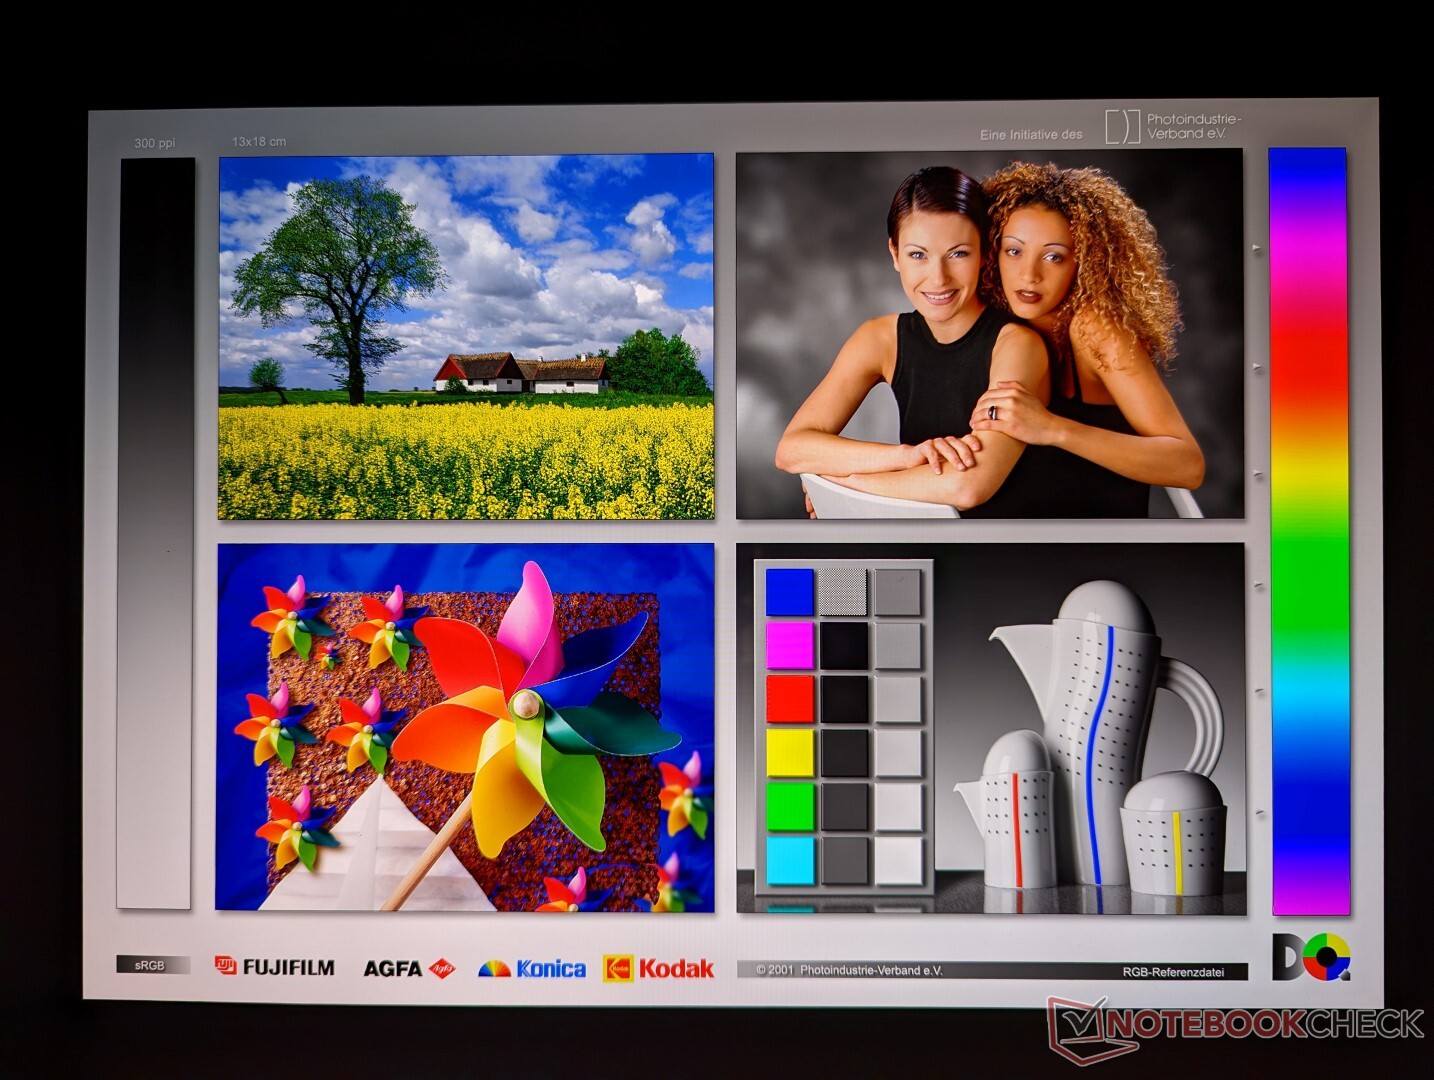
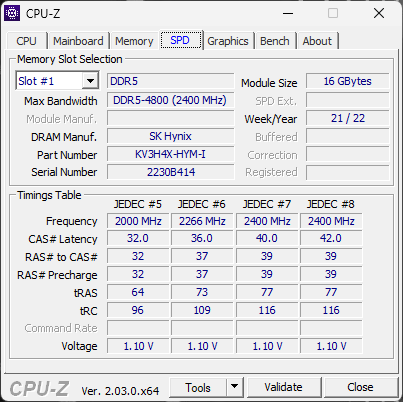
Le opzioni del display sono identiche a quelle disponibili sul più sottile Precision 7670. La nostra unità di prova utilizza lo stesso pannello OLED Samsung 160YV03 che promette colori P3 completi.
| |||||||||||||||||||||||||
Distribuzione della luminosità: 97 %
Al centro con la batteria: 325.2 cd/m²
Contrasto: ∞:1 (Nero: 0 cd/m²)
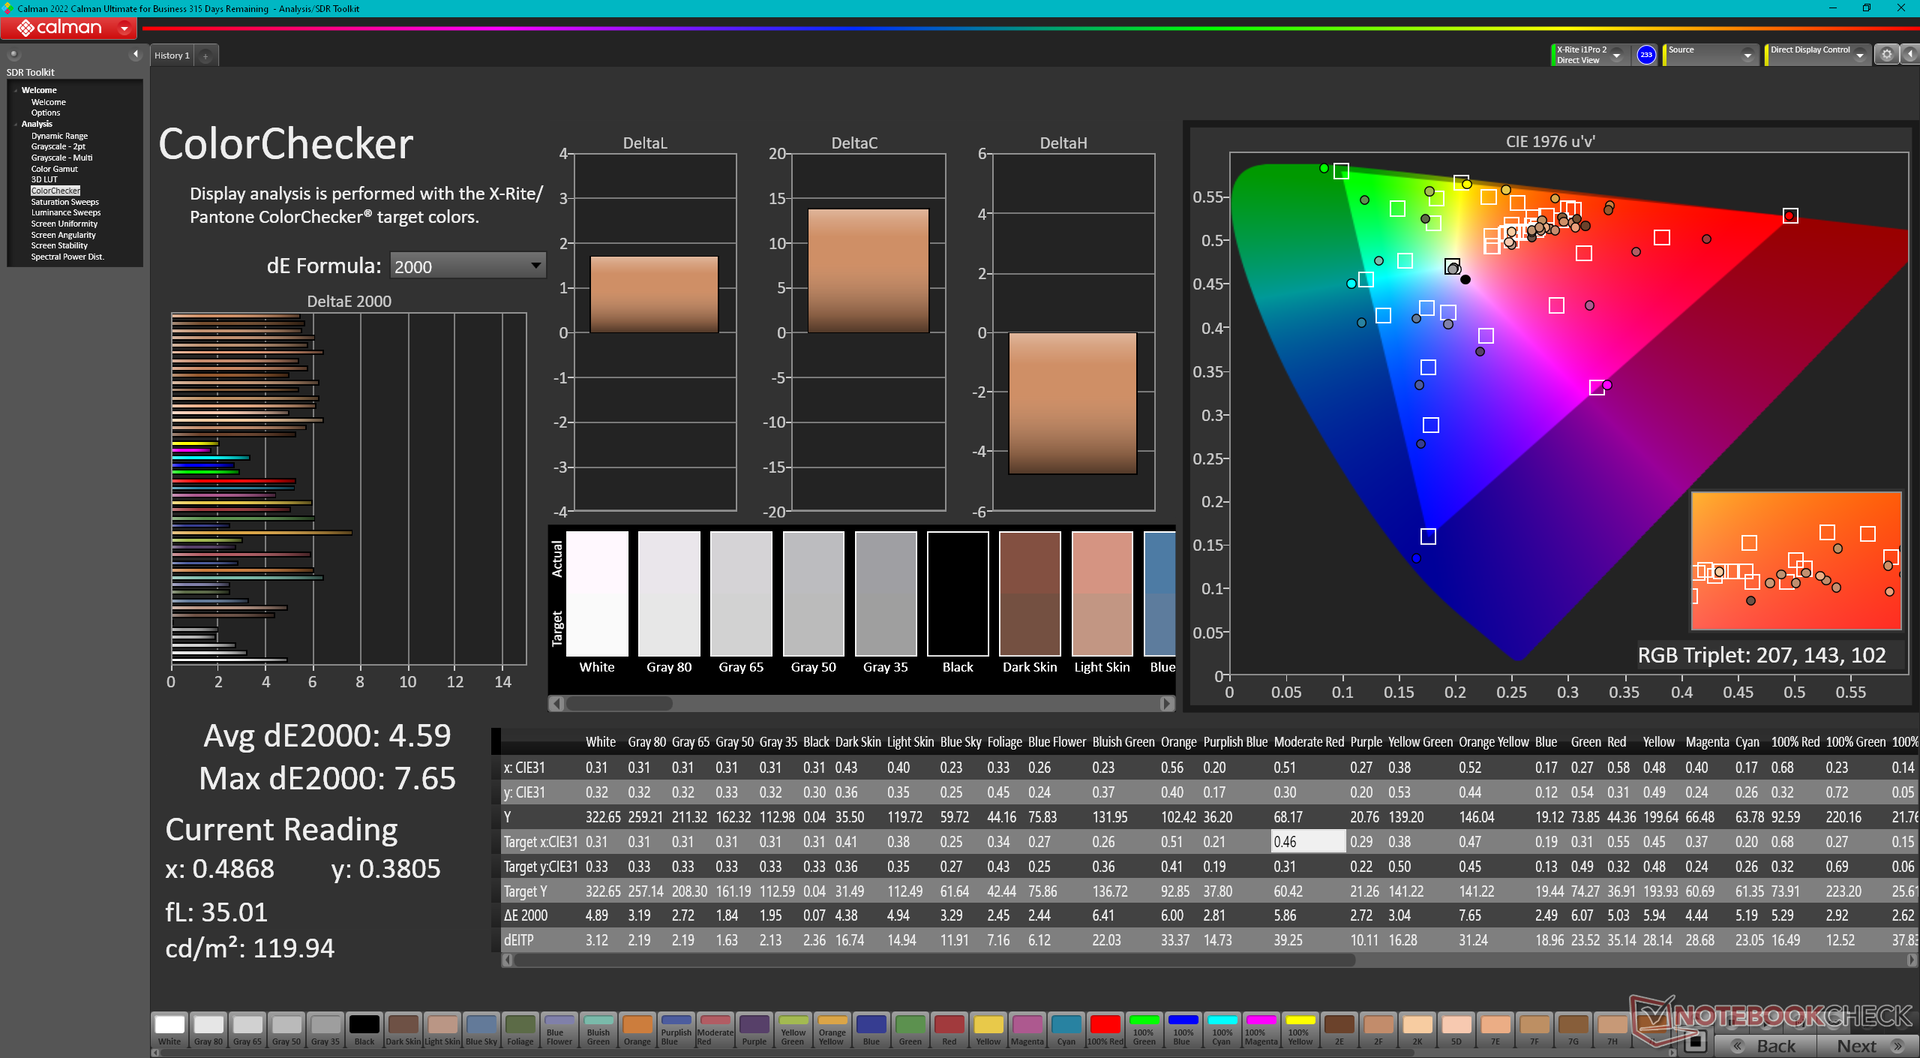
ΔE Color 4.59 | 0.5-29.43 Ø5
ΔE Greyscale 2.5 | 0.57-98 Ø5.3
98.1% AdobeRGB 1998 (Argyll 2.2.0 3D)
100% sRGB (Argyll 2.2.0 3D)
99.9% Display P3 (Argyll 2.2.0 3D)
Gamma: 2.1
| Dell Precision 7000 7670 Performance Samsung 160YV03, OLED, 3840x2400, 16.00 | MSI CreatorPro Z16P B12UKST B160QAN02.N, IPS, 2560x1600, 16.00 | HP ZBook Studio 16 G9 62U04EA BOE0A52, IPS, 3840x2400, 16.00 | HP ZBook Firefly 16 G9-6B897EA BOE0A02, IPS, 1920x1200, 16.00 | Lenovo ThinkPad P1 G4-20Y4Z9DVUS NE160QDM-N63, IPS, 2560x1600, 16.00 | Dell Precision 7670 Samsung 160YV03, OLED, 3840x2400, 16.00 | |
|---|---|---|---|---|---|---|
| Display | -4% | -5% | -22% | -17% | -0% | |
| Display P3 Coverage | 99.9 | 97.6 -2% | 97.5 -2% | 68.1 -32% | 72.7 -27% | 99.9 0% |
| sRGB Coverage | 100 | 99.9 0% | 99.9 0% | 96.1 -4% | 99.3 -1% | 100 0% |
| AdobeRGB 1998 Coverage | 98.1 | 87.4 -11% | 86.3 -12% | 70 -29% | 74.7 -24% | 97.5 -1% |
| Response Times | -441% | -475% | -1843% | -1550% | -2% | |
| Response Time Grey 50% / Grey 80% * | 1.84 ? | 12.8 ? -596% | 15.3 ? -732% | 52.8 ? -2770% | 40.8 -2117% | 1.9 ? -3% |
| Response Time Black / White * | 1.92 ? | 7.4 ? -285% | 6.1 ? -218% | 19.5 ? -916% | 20.8 -983% | 2 ? -4% |
| PWM Frequency | 59.52 ? | 59.5 ? 0% | ||||
| Screen | 32% | 50% | 4% | 7% | 2% | |
| Brightness middle | 325.2 | 407 25% | 554 70% | 526 62% | 441 36% | 340.1 5% |
| Brightness | 328 | 388 18% | 516 57% | 499 52% | 420 28% | 342 4% |
| Brightness Distribution | 97 | 88 -9% | 84 -13% | 93 -4% | 90 -7% | 98 1% |
| Black Level * | 0.36 | 0.47 | 0.31 | 0.27 | ||
| Colorchecker dE 2000 * | 4.59 | 1.3 72% | 1 78% | 3.6 22% | 2.6 43% | 2.5 46% |
| Colorchecker dE 2000 max. * | 7.65 | 2.5 67% | 2.4 69% | 6.6 14% | 6 22% | 8.19 -7% |
| Greyscale dE 2000 * | 2.5 | 2.1 16% | 1.6 36% | 5.5 -120% | 4.5 -80% | 3.5 -40% |
| Gamma | 2.1 105% | 2.26 97% | 2.29 96% | 2.02 109% | 2.18 101% | 2.12 104% |
| CCT | 6541 99% | 6437 101% | 6458 101% | 6527 100% | 6623 98% | 6704 97% |
| Contrast | 1131 | 1179 | 1697 | 1633 | ||
| Colorchecker dE 2000 calibrated * | 0.7 | 0.6 | 2.6 | 1.2 | ||
| Media totale (Programma / Settaggio) | -138% /
-64% | -143% /
-61% | -620% /
-339% | -520% /
-283% | 0% /
0% |
* ... Meglio usare valori piccoli
Tempi di risposta del Display
| ↔ Tempi di risposta dal Nero al Bianco | ||
|---|---|---|
| 1.92 ms ... aumenta ↗ e diminuisce ↘ combinato | ↗ 0.92 ms Incremento | 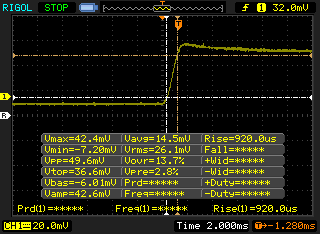 |
| ↘ 1 ms Calo | ||
| Lo schermo ha mostrato valori di risposta molto veloci nei nostri tests ed è molto adatto per i gaming veloce. In confronto, tutti i dispositivi di test variano da 0.1 (minimo) a 240 (massimo) ms. » 6 % di tutti i dispositivi è migliore. Questo significa che i tempi di risposta rilevati sono migliori rispettto alla media di tutti i dispositivi testati (21.5 ms). | ||
| ↔ Tempo di risposta dal 50% Grigio all'80% Grigio | ||
| 1.84 ms ... aumenta ↗ e diminuisce ↘ combinato | ↗ 0.92 ms Incremento | 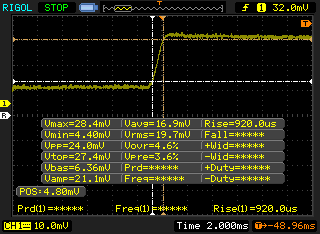 |
| ↘ 0.92 ms Calo | ||
| Lo schermo ha mostrato valori di risposta molto veloci nei nostri tests ed è molto adatto per i gaming veloce. In confronto, tutti i dispositivi di test variano da 0.2 (minimo) a 636 (massimo) ms. » 5 % di tutti i dispositivi è migliore. Questo significa che i tempi di risposta rilevati sono migliori rispettto alla media di tutti i dispositivi testati (33.7 ms). | ||
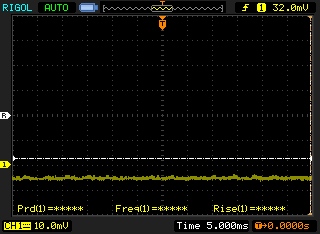
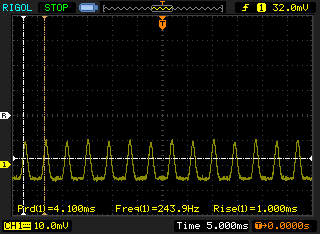
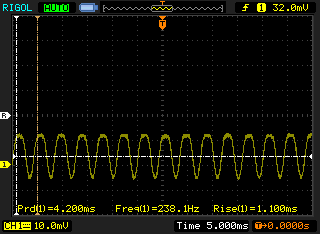
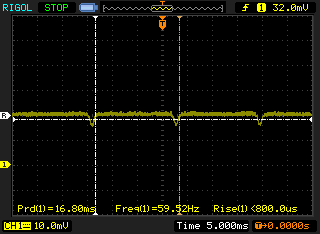
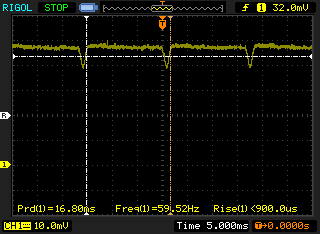
Sfarfallio dello schermo / PWM (Pulse-Width Modulation)
| flickering dello schermo / PWM rilevato | 59.52 Hz | ≤ 100 % settaggio luminosita' |  |
Il display sfarfalla a 59.52 Hz (Probabilmente a causa dell'uso di PWM) Flickering rilevato ad una luminosita' di 100 % o inferiore. Non dovrebbe verificarsi flickering o PWM sopra questo valore di luminosita'. La frequenza di 59.52 Hz è molto bassa, quindi il flickering potrebbe causare stanchezza agli occhi e mal di testa con un utilizzo prolungato. In confronto: 53 % di tutti i dispositivi testati non utilizza PWM per ridurre la luminosita' del display. Se è rilevato PWM, una media di 17900 (minimo: 5 - massimo: 3846000) Hz è stata rilevata. | |||
Lo sfarfallio è presente in tutte le impostazioni di luminosità, come nella maggior parte dei pannelli OLED. Abbiamo registrato una frequenza di 238,1 Hz da 0 al 57% di luminosità e di 59,5 Hz dal 58% al massimo.
Prestazioni
Condizioni di test
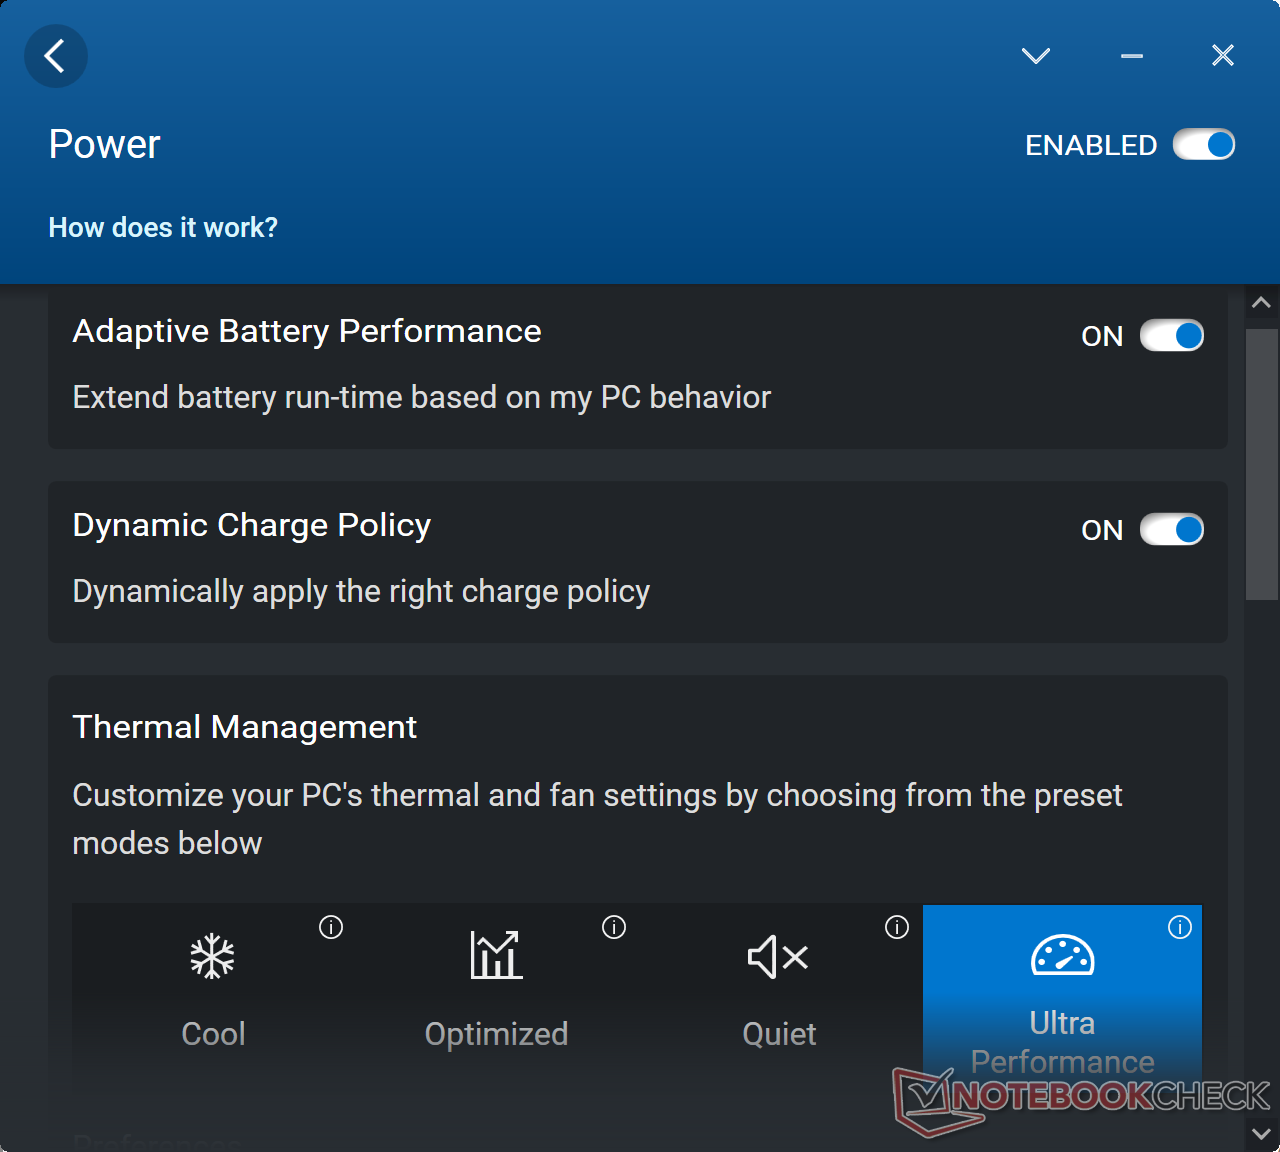
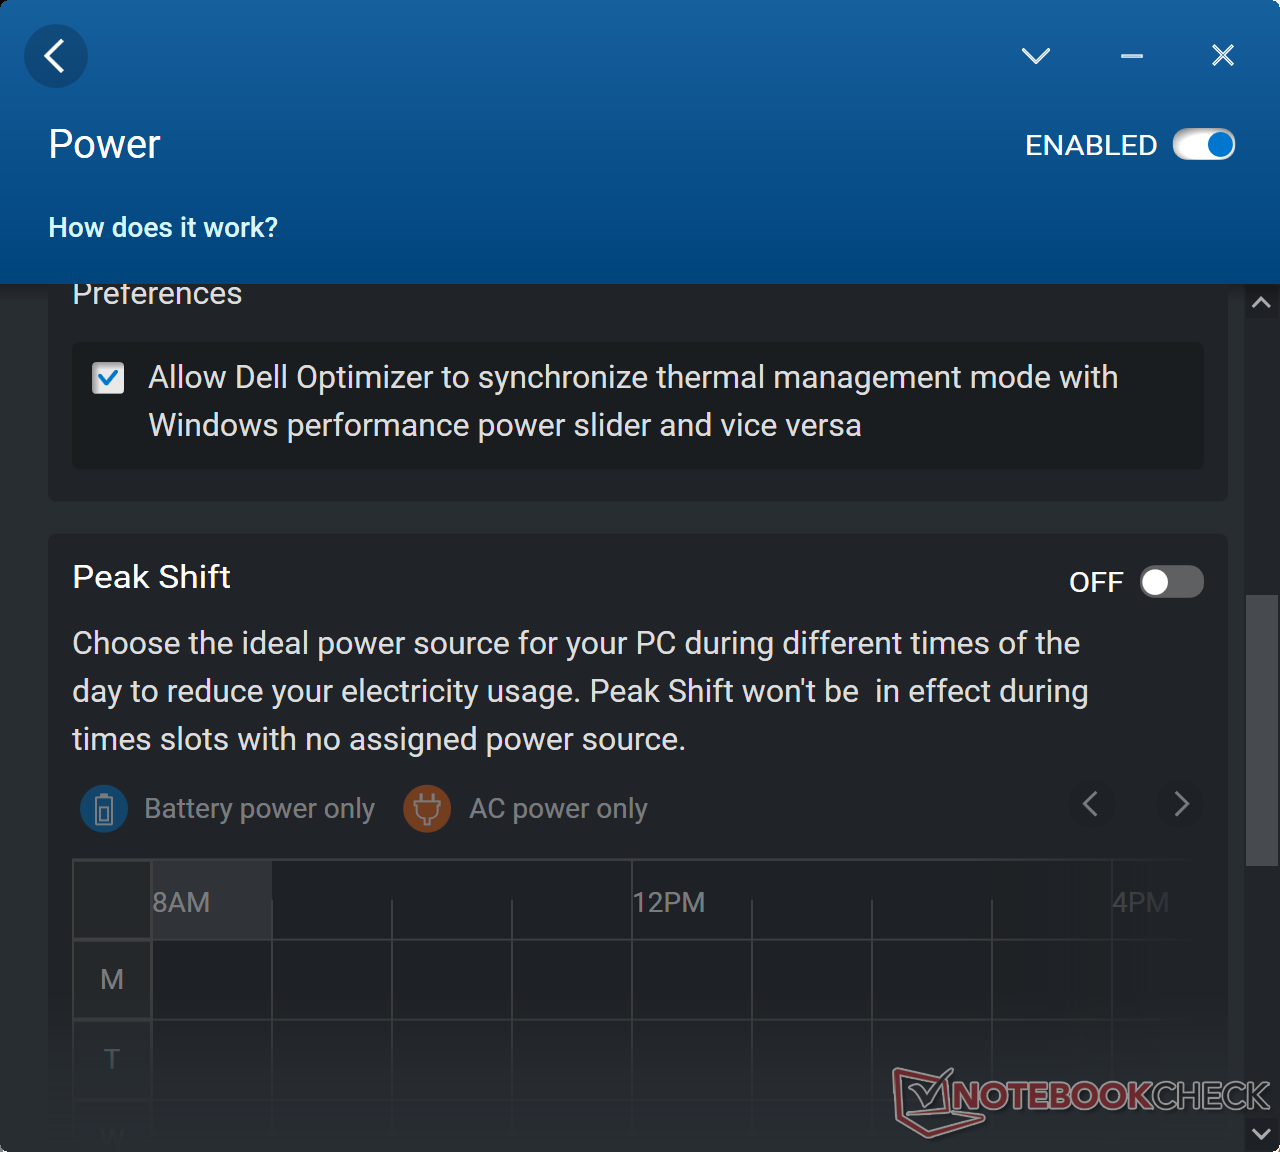
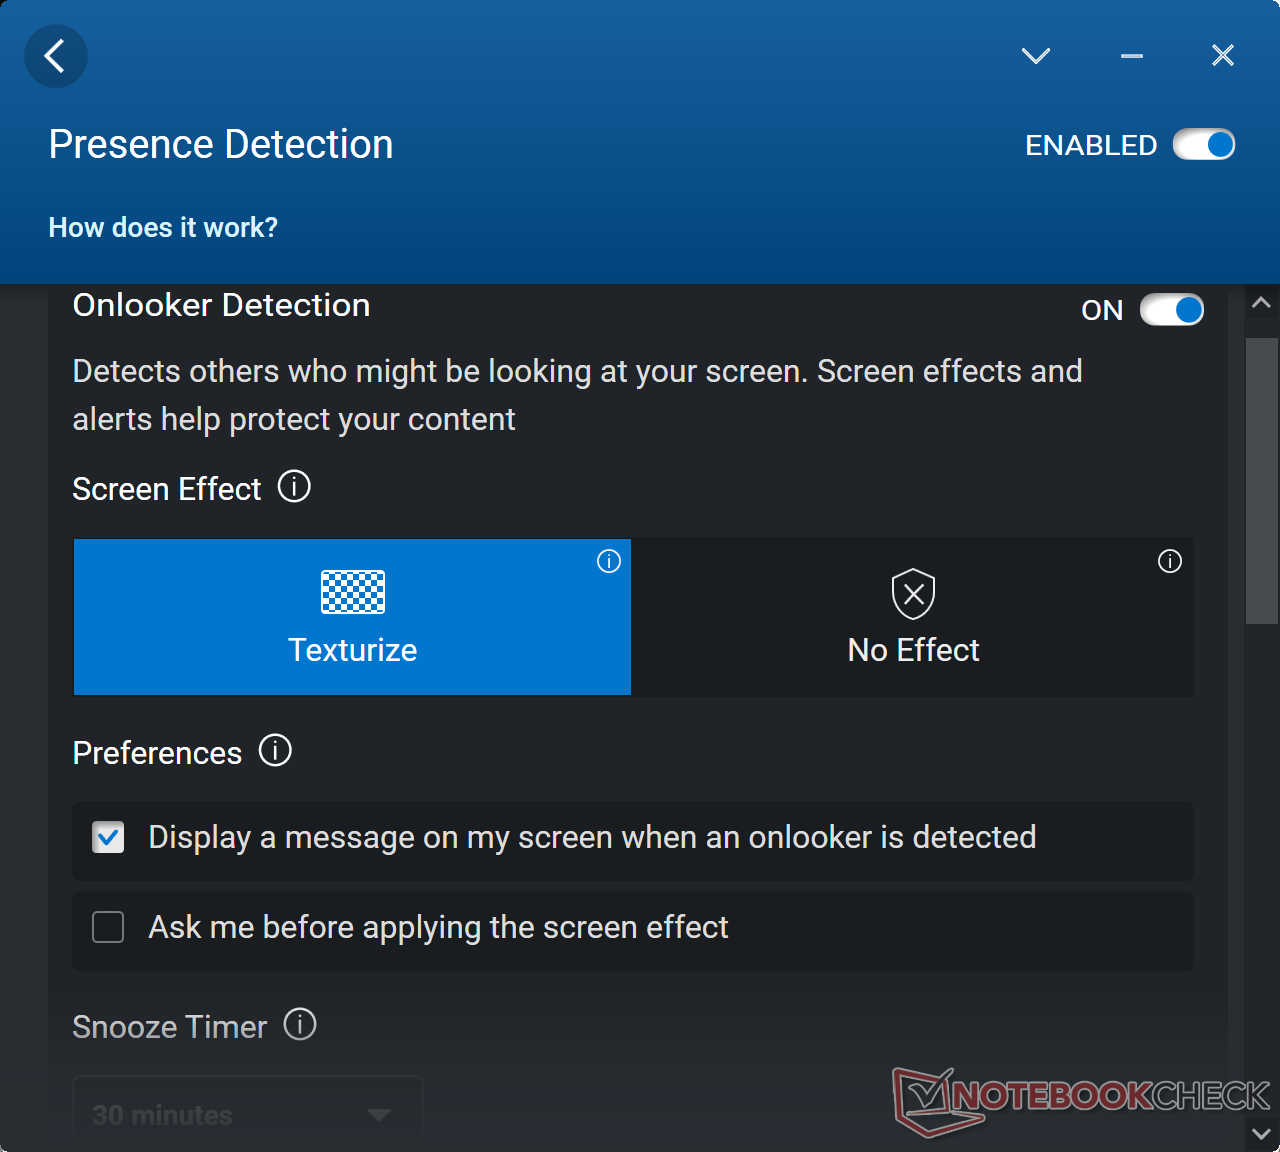
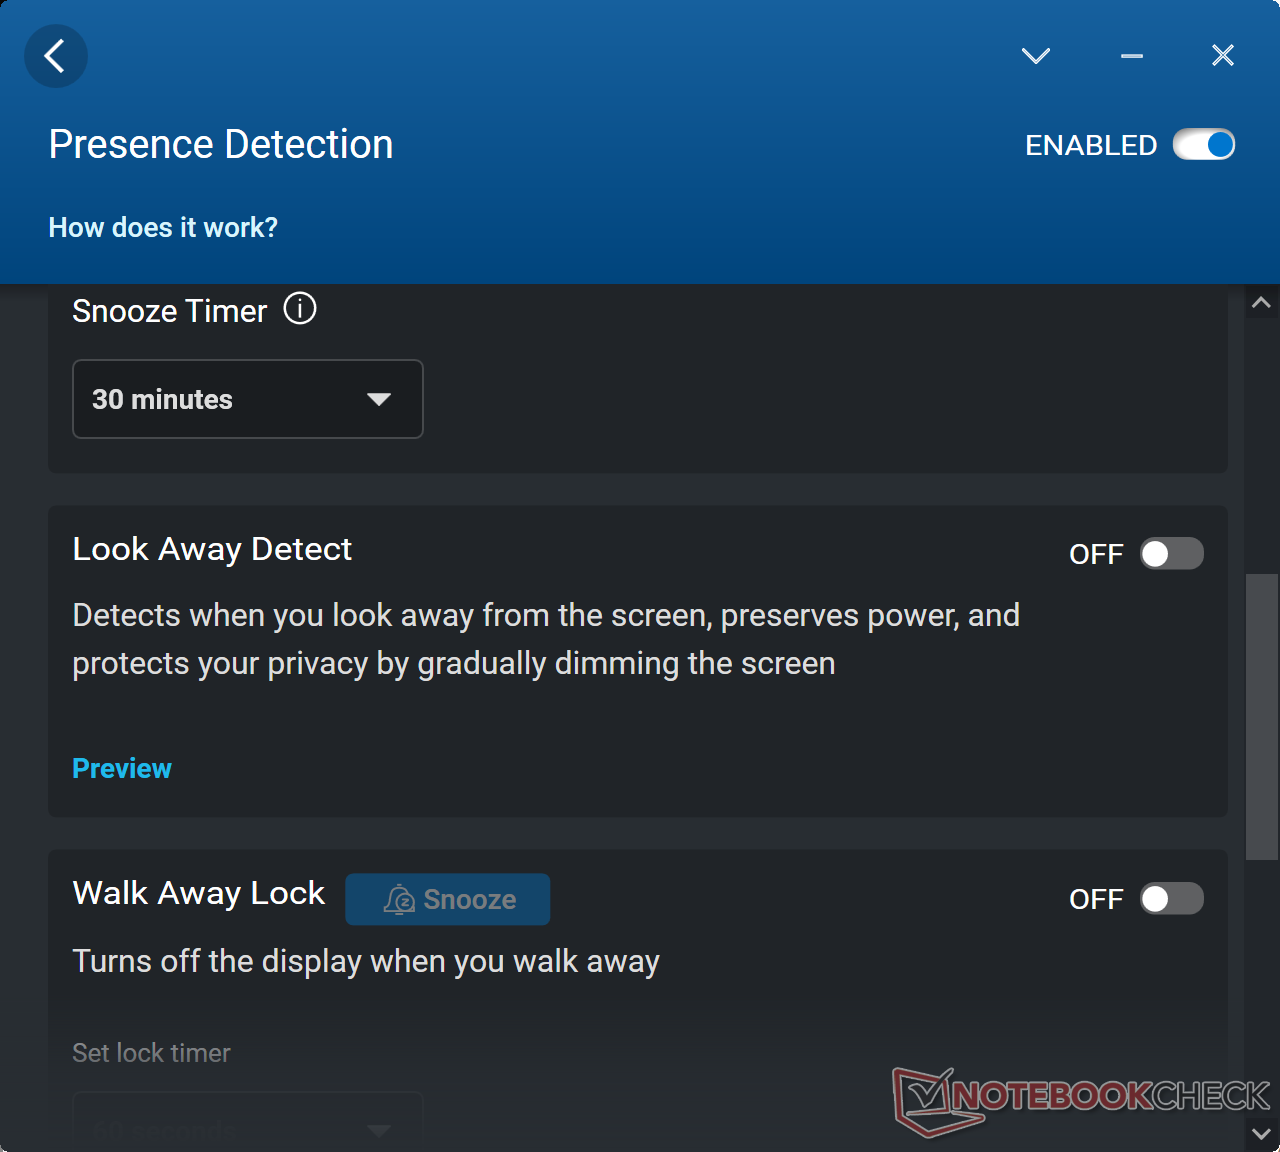
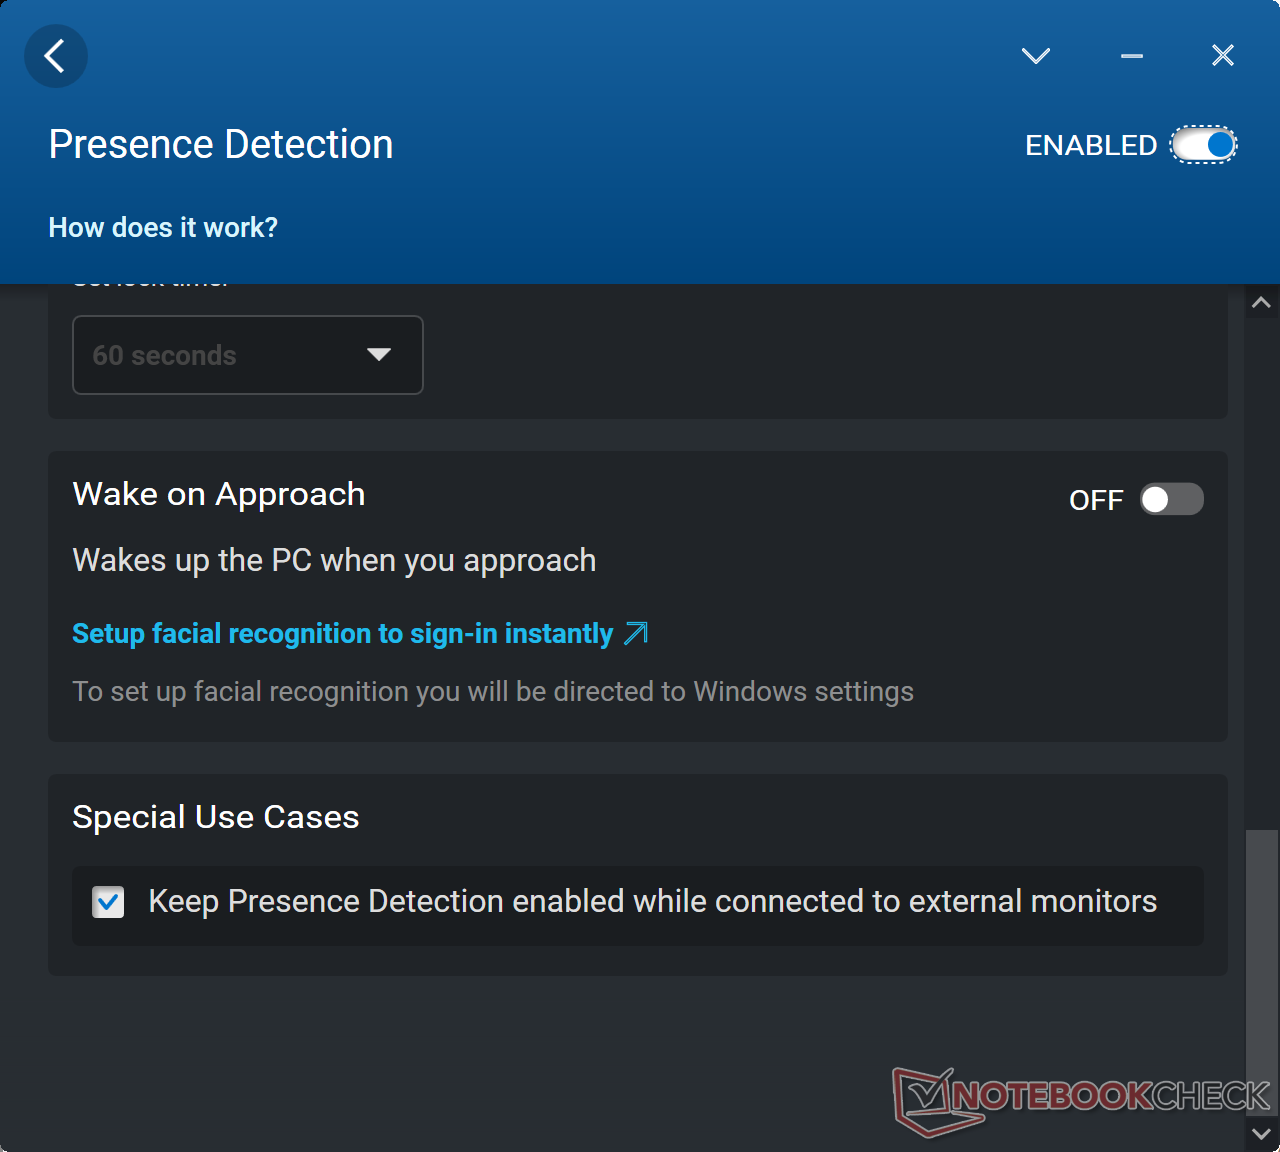
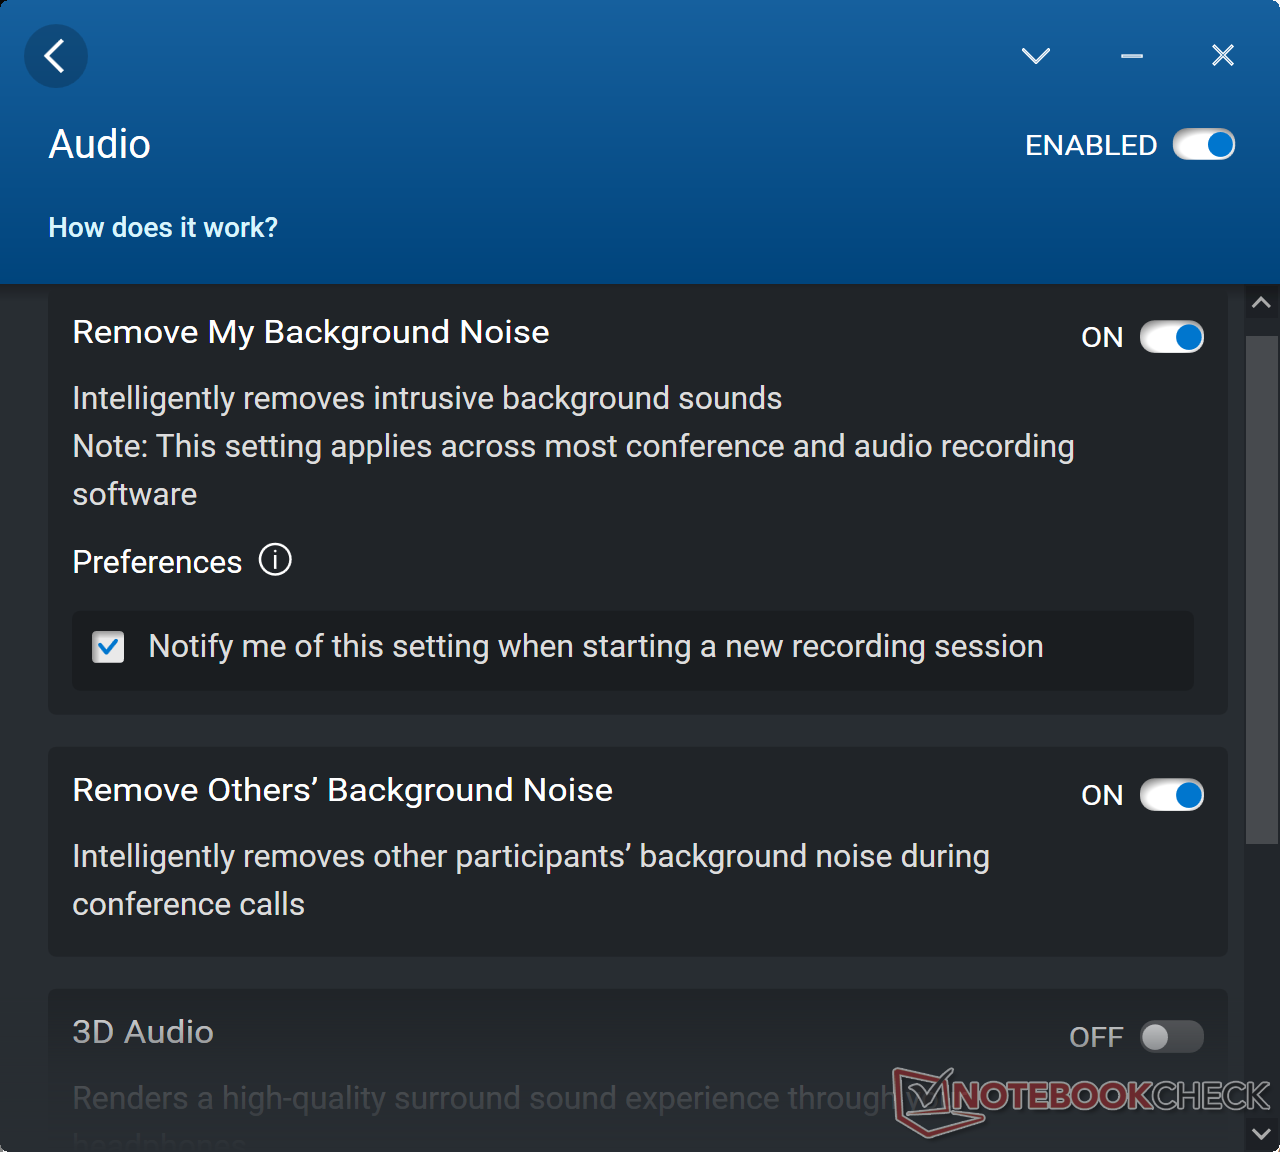
Abbiamo impostato la nostra unità sulla modalità Ultra Performance tramite il software Dell Optimizer e la GPU sulla grafica discreta prima di eseguire i benchmark delle prestazioni riportati di seguito. Si consiglia vivamente ai possessori di familiarizzare con Optimizer, in quanto è l'hub per il controllo di molte funzioni specifiche del portatile, tra cui il rilevamento della presenza e il comportamento di ricarica
Non abbiamo trovato alcun interruttore MUX nel software o nel BIOS.
Processore
Le prestazioni multi-thread sono solo dall'8 al 14% circa più veloci rispetto alCore i7-12850HX nel nostro più sottile Precision 7670. Il margine ridotto non è inaspettato, ma l'aspetto più sorprendente è la sostenibilità Turbo Boost un po' scarsa del nostroCore i9-12950HX. Durante l'esecuzione di CineBench R15 xT in loop, le prestazioni calavano di circa il 17% nel tempo, invece di rimanere costanti. Il deficit di prestazioni è simile a quello osservato sul normale Precision 7670, nonostante il profilo più spesso del nostro modello Performance.
Cinebench R15 Multi Loop
Cinebench R23: Multi Core | Single Core
Cinebench R15: CPU Multi 64Bit | CPU Single 64Bit
Blender: v2.79 BMW27 CPU
7-Zip 18.03: 7z b 4 | 7z b 4 -mmt1
Geekbench 5.5: Multi-Core | Single-Core
HWBOT x265 Benchmark v2.2: 4k Preset
LibreOffice : 20 Documents To PDF
R Benchmark 2.5: Overall mean
| Cinebench R20 / CPU (Multi Core) | |
| Media Intel Core i9-12950HX (6625 - 8777, n=7) | |
| MSI CreatorPro Z16P B12UKST | |
| Dell Precision 7000 7670 Performance | |
| HP ZBook Studio 16 G9 62U04EA | |
| Dell Precision 7670 | |
| Lenovo ThinkPad P1 G4-20Y4Z9DVUS | |
| HP ZBook Firefly 16 G9-6B897EA | |
| Cinebench R20 / CPU (Single Core) | |
| Media Intel Core i9-12950HX (703 - 741, n=7) | |
| HP ZBook Studio 16 G9 62U04EA | |
| Dell Precision 7000 7670 Performance | |
| Dell Precision 7670 | |
| MSI CreatorPro Z16P B12UKST | |
| Lenovo ThinkPad P1 G4-20Y4Z9DVUS | |
| HP ZBook Firefly 16 G9-6B897EA | |
| Cinebench R23 / Multi Core | |
| Media Intel Core i9-12950HX (16277 - 23113, n=7) | |
| MSI CreatorPro Z16P B12UKST | |
| HP ZBook Studio 16 G9 62U04EA | |
| Dell Precision 7000 7670 Performance | |
| Dell Precision 7670 | |
| Lenovo ThinkPad P1 G4-20Y4Z9DVUS | |
| HP ZBook Firefly 16 G9-6B897EA | |
| Cinebench R23 / Single Core | |
| HP ZBook Studio 16 G9 62U04EA | |
| Media Intel Core i9-12950HX (1465 - 1922, n=7) | |
| MSI CreatorPro Z16P B12UKST | |
| Dell Precision 7670 | |
| Lenovo ThinkPad P1 G4-20Y4Z9DVUS | |
| Dell Precision 7000 7670 Performance | |
| HP ZBook Firefly 16 G9-6B897EA | |
| Cinebench R15 / CPU Multi 64Bit | |
| Media Intel Core i9-12950HX (2464 - 3530, n=7) | |
| Dell Precision 7000 7670 Performance | |
| HP ZBook Studio 16 G9 62U04EA | |
| Dell Precision 7670 | |
| MSI CreatorPro Z16P B12UKST | |
| Lenovo ThinkPad P1 G4-20Y4Z9DVUS | |
| HP ZBook Firefly 16 G9-6B897EA | |
| Cinebench R15 / CPU Single 64Bit | |
| HP ZBook Studio 16 G9 62U04EA | |
| Dell Precision 7000 7670 Performance | |
| Media Intel Core i9-12950HX (167 - 276, n=7) | |
| Dell Precision 7670 | |
| MSI CreatorPro Z16P B12UKST | |
| Lenovo ThinkPad P1 G4-20Y4Z9DVUS | |
| HP ZBook Firefly 16 G9-6B897EA | |
| Blender / v2.79 BMW27 CPU | |
| HP ZBook Firefly 16 G9-6B897EA | |
| Lenovo ThinkPad P1 G4-20Y4Z9DVUS | |
| Dell Precision 7670 | |
| MSI CreatorPro Z16P B12UKST | |
| Dell Precision 7000 7670 Performance | |
| HP ZBook Studio 16 G9 62U04EA | |
| Media Intel Core i9-12950HX (138 - 193, n=7) | |
| 7-Zip 18.03 / 7z b 4 | |
| Media Intel Core i9-12950HX (65637 - 85019, n=7) | |
| HP ZBook Studio 16 G9 62U04EA | |
| MSI CreatorPro Z16P B12UKST | |
| Dell Precision 7000 7670 Performance | |
| Dell Precision 7670 | |
| Lenovo ThinkPad P1 G4-20Y4Z9DVUS | |
| HP ZBook Firefly 16 G9-6B897EA | |
| 7-Zip 18.03 / 7z b 4 -mmt1 | |
| Media Intel Core i9-12950HX (6022 - 6318, n=7) | |
| Dell Precision 7000 7670 Performance | |
| HP ZBook Studio 16 G9 62U04EA | |
| MSI CreatorPro Z16P B12UKST | |
| Dell Precision 7670 | |
| Lenovo ThinkPad P1 G4-20Y4Z9DVUS | |
| HP ZBook Firefly 16 G9-6B897EA | |
| Geekbench 5.5 / Multi-Core | |
| Media Intel Core i9-12950HX (14028 - 16009, n=7) | |
| Dell Precision 7000 7670 Performance | |
| HP ZBook Studio 16 G9 62U04EA | |
| MSI CreatorPro Z16P B12UKST | |
| Dell Precision 7670 | |
| Lenovo ThinkPad P1 G4-20Y4Z9DVUS | |
| HP ZBook Firefly 16 G9-6B897EA | |
| Geekbench 5.5 / Single-Core | |
| Dell Precision 7000 7670 Performance | |
| Media Intel Core i9-12950HX (1847 - 1945, n=7) | |
| HP ZBook Studio 16 G9 62U04EA | |
| HP ZBook Firefly 16 G9-6B897EA | |
| MSI CreatorPro Z16P B12UKST | |
| Dell Precision 7670 | |
| Lenovo ThinkPad P1 G4-20Y4Z9DVUS | |
| HWBOT x265 Benchmark v2.2 / 4k Preset | |
| Media Intel Core i9-12950HX (18.6 - 26.5, n=7) | |
| HP ZBook Studio 16 G9 62U04EA | |
| MSI CreatorPro Z16P B12UKST | |
| Dell Precision 7000 7670 Performance | |
| Dell Precision 7670 | |
| Lenovo ThinkPad P1 G4-20Y4Z9DVUS | |
| HP ZBook Firefly 16 G9-6B897EA | |
| LibreOffice / 20 Documents To PDF | |
| HP ZBook Firefly 16 G9-6B897EA | |
| Lenovo ThinkPad P1 G4-20Y4Z9DVUS | |
| Dell Precision 7670 | |
| Dell Precision 7000 7670 Performance | |
| HP ZBook Studio 16 G9 62U04EA | |
| Media Intel Core i9-12950HX (34.7 - 45.4, n=7) | |
| MSI CreatorPro Z16P B12UKST | |
| R Benchmark 2.5 / Overall mean | |
| Lenovo ThinkPad P1 G4-20Y4Z9DVUS | |
| HP ZBook Firefly 16 G9-6B897EA | |
| Dell Precision 7670 | |
| MSI CreatorPro Z16P B12UKST | |
| Dell Precision 7000 7670 Performance | |
| HP ZBook Studio 16 G9 62U04EA | |
| Media Intel Core i9-12950HX (0.4251 - 0.4515, n=7) | |
* ... Meglio usare valori piccoli
AIDA64: FP32 Ray-Trace | FPU Julia | CPU SHA3 | CPU Queen | FPU SinJulia | FPU Mandel | CPU AES | CPU ZLib | FP64 Ray-Trace | CPU PhotoWorxx
| Performance Rating | |
| Media Intel Core i9-12950HX | |
| MSI CreatorPro Z16P B12UKST | |
| HP ZBook Studio 16 G9 62U04EA | |
| Dell Precision 7000 7670 Performance | |
| Lenovo ThinkPad P1 G4-20Y4Z9DVUS | |
| Dell Precision 7670 | |
| HP ZBook Firefly 16 G9-6B897EA | |
| AIDA64 / FP32 Ray-Trace | |
| Media Intel Core i9-12950HX (15499 - 22868, n=7) | |
| Dell Precision 7000 7670 Performance | |
| Lenovo ThinkPad P1 G4-20Y4Z9DVUS | |
| HP ZBook Studio 16 G9 62U04EA | |
| MSI CreatorPro Z16P B12UKST | |
| Dell Precision 7670 | |
| HP ZBook Firefly 16 G9-6B897EA | |
| AIDA64 / FPU Julia | |
| Media Intel Core i9-12950HX (77846 - 115907, n=7) | |
| HP ZBook Studio 16 G9 62U04EA | |
| Dell Precision 7000 7670 Performance | |
| MSI CreatorPro Z16P B12UKST | |
| Dell Precision 7670 | |
| Lenovo ThinkPad P1 G4-20Y4Z9DVUS | |
| HP ZBook Firefly 16 G9-6B897EA | |
| AIDA64 / CPU SHA3 | |
| Lenovo ThinkPad P1 G4-20Y4Z9DVUS | |
| Media Intel Core i9-12950HX (3426 - 5069, n=7) | |
| HP ZBook Studio 16 G9 62U04EA | |
| MSI CreatorPro Z16P B12UKST | |
| Dell Precision 7000 7670 Performance | |
| Dell Precision 7670 | |
| HP ZBook Firefly 16 G9-6B897EA | |
| AIDA64 / CPU Queen | |
| HP ZBook Studio 16 G9 62U04EA | |
| Media Intel Core i9-12950HX (102752 - 104726, n=7) | |
| Dell Precision 7000 7670 Performance | |
| MSI CreatorPro Z16P B12UKST | |
| Lenovo ThinkPad P1 G4-20Y4Z9DVUS | |
| HP ZBook Firefly 16 G9-6B897EA | |
| Dell Precision 7670 | |
| AIDA64 / FPU SinJulia | |
| Media Intel Core i9-12950HX (10134 - 12823, n=7) | |
| Dell Precision 7000 7670 Performance | |
| Dell Precision 7670 | |
| Lenovo ThinkPad P1 G4-20Y4Z9DVUS | |
| HP ZBook Studio 16 G9 62U04EA | |
| MSI CreatorPro Z16P B12UKST | |
| HP ZBook Firefly 16 G9-6B897EA | |
| AIDA64 / FPU Mandel | |
| Media Intel Core i9-12950HX (37146 - 57340, n=7) | |
| HP ZBook Studio 16 G9 62U04EA | |
| Lenovo ThinkPad P1 G4-20Y4Z9DVUS | |
| Dell Precision 7000 7670 Performance | |
| MSI CreatorPro Z16P B12UKST | |
| Dell Precision 7670 | |
| HP ZBook Firefly 16 G9-6B897EA | |
| AIDA64 / CPU AES | |
| MSI CreatorPro Z16P B12UKST | |
| Media Intel Core i9-12950HX (72599 - 181128, n=7) | |
| Lenovo ThinkPad P1 G4-20Y4Z9DVUS | |
| HP ZBook Studio 16 G9 62U04EA | |
| Dell Precision 7000 7670 Performance | |
| Dell Precision 7670 | |
| HP ZBook Firefly 16 G9-6B897EA | |
| AIDA64 / CPU ZLib | |
| Media Intel Core i9-12950HX (996 - 1417, n=7) | |
| HP ZBook Studio 16 G9 62U04EA | |
| MSI CreatorPro Z16P B12UKST | |
| Dell Precision 7000 7670 Performance | |
| Dell Precision 7670 | |
| Lenovo ThinkPad P1 G4-20Y4Z9DVUS | |
| HP ZBook Firefly 16 G9-6B897EA | |
| AIDA64 / FP64 Ray-Trace | |
| Media Intel Core i9-12950HX (8455 - 12432, n=7) | |
| HP ZBook Studio 16 G9 62U04EA | |
| Dell Precision 7000 7670 Performance | |
| Lenovo ThinkPad P1 G4-20Y4Z9DVUS | |
| MSI CreatorPro Z16P B12UKST | |
| Dell Precision 7670 | |
| HP ZBook Firefly 16 G9-6B897EA | |
| AIDA64 / CPU PhotoWorxx | |
| MSI CreatorPro Z16P B12UKST | |
| Dell Precision 7000 7670 Performance | |
| Dell Precision 7670 | |
| Media Intel Core i9-12950HX (35479 - 42655, n=7) | |
| HP ZBook Studio 16 G9 62U04EA | |
| HP ZBook Firefly 16 G9-6B897EA | |
| Lenovo ThinkPad P1 G4-20Y4Z9DVUS | |
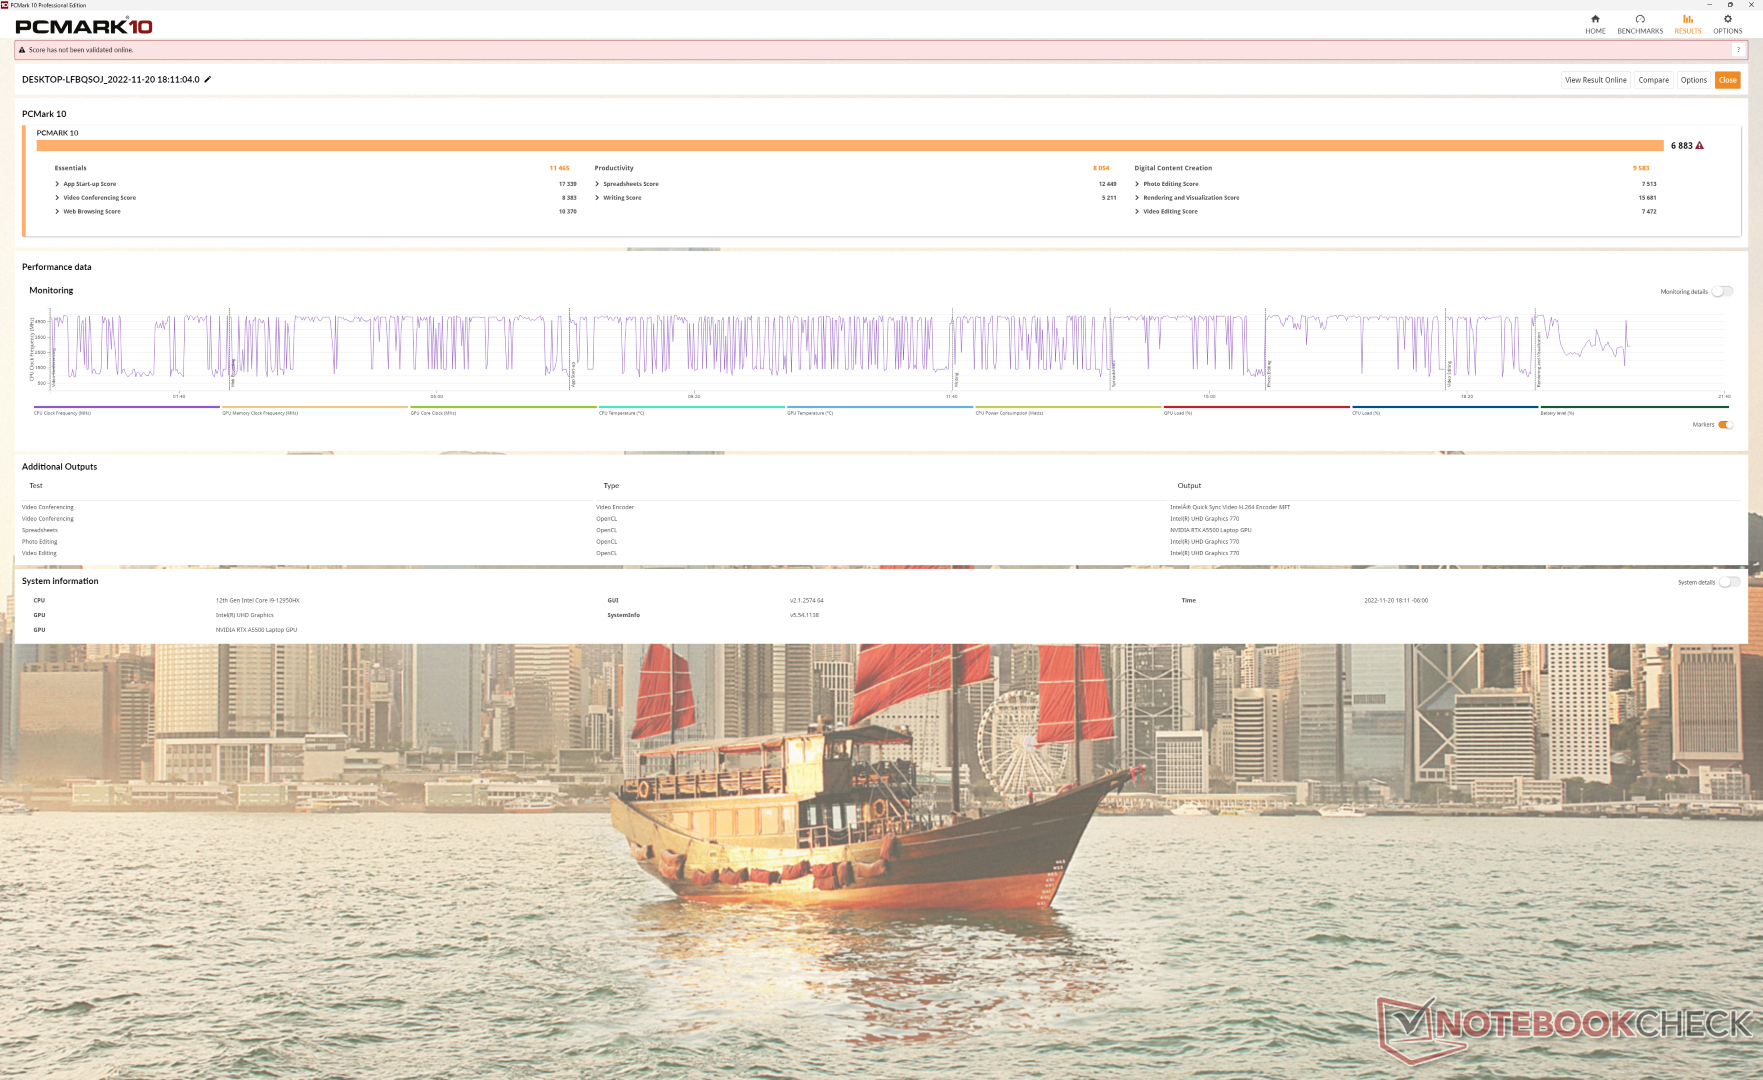
Prestazioni del sistema
I risultati di PCMark sono paragonabili a quelli delle workstation mobili di fascia alta attualmente disponibili, tra cui il modelloHP ZBook Fury 15 G8.
CrossMark: Overall | Productivity | Creativity | Responsiveness
| PCMark 10 / Score | |
| MSI CreatorPro Z16P B12UKST | |
| MSI WE76 11UM-456 | |
| Media Intel Core i9-12950HX, NVIDIA RTX A5500 Laptop GPU (6883 - 7236, n=3) | |
| Dell Precision 7000 7670 Performance | |
| Dell Precision 7670 | |
| HP ZBook Studio 16 G9 62U04EA | |
| Lenovo ThinkPad P1 G4-20Y4Z9DVUS | |
| HP ZBook Firefly 16 G9-6B897EA | |
| PCMark 10 / Essentials | |
| Dell Precision 7000 7670 Performance | |
| Media Intel Core i9-12950HX, NVIDIA RTX A5500 Laptop GPU (10898 - 11465, n=3) | |
| MSI CreatorPro Z16P B12UKST | |
| Dell Precision 7670 | |
| HP ZBook Firefly 16 G9-6B897EA | |
| Lenovo ThinkPad P1 G4-20Y4Z9DVUS | |
| MSI WE76 11UM-456 | |
| HP ZBook Studio 16 G9 62U04EA | |
| PCMark 10 / Productivity | |
| MSI WE76 11UM-456 | |
| MSI CreatorPro Z16P B12UKST | |
| Dell Precision 7670 | |
| Media Intel Core i9-12950HX, NVIDIA RTX A5500 Laptop GPU (8054 - 9489, n=3) | |
| HP ZBook Firefly 16 G9-6B897EA | |
| Lenovo ThinkPad P1 G4-20Y4Z9DVUS | |
| Dell Precision 7000 7670 Performance | |
| HP ZBook Studio 16 G9 62U04EA | |
| PCMark 10 / Digital Content Creation | |
| MSI WE76 11UM-456 | |
| MSI CreatorPro Z16P B12UKST | |
| Dell Precision 7000 7670 Performance | |
| Media Intel Core i9-12950HX, NVIDIA RTX A5500 Laptop GPU (9155 - 9944, n=3) | |
| HP ZBook Studio 16 G9 62U04EA | |
| Dell Precision 7670 | |
| Lenovo ThinkPad P1 G4-20Y4Z9DVUS | |
| HP ZBook Firefly 16 G9-6B897EA | |
| CrossMark / Overall | |
| MSI CreatorPro Z16P B12UKST | |
| Media Intel Core i9-12950HX, NVIDIA RTX A5500 Laptop GPU (1801 - 1889, n=3) | |
| HP ZBook Studio 16 G9 62U04EA | |
| Dell Precision 7000 7670 Performance | |
| MSI WE76 11UM-456 | |
| HP ZBook Firefly 16 G9-6B897EA | |
| Lenovo ThinkPad P1 G4-20Y4Z9DVUS | |
| Dell Precision 7670 | |
| CrossMark / Productivity | |
| MSI CreatorPro Z16P B12UKST | |
| Media Intel Core i9-12950HX, NVIDIA RTX A5500 Laptop GPU (1684 - 1785, n=3) | |
| HP ZBook Studio 16 G9 62U04EA | |
| Dell Precision 7000 7670 Performance | |
| MSI WE76 11UM-456 | |
| HP ZBook Firefly 16 G9-6B897EA | |
| Lenovo ThinkPad P1 G4-20Y4Z9DVUS | |
| Dell Precision 7670 | |
| CrossMark / Creativity | |
| Media Intel Core i9-12950HX, NVIDIA RTX A5500 Laptop GPU (2042 - 2192, n=3) | |
| HP ZBook Studio 16 G9 62U04EA | |
| MSI CreatorPro Z16P B12UKST | |
| Dell Precision 7000 7670 Performance | |
| MSI WE76 11UM-456 | |
| HP ZBook Firefly 16 G9-6B897EA | |
| Dell Precision 7670 | |
| Lenovo ThinkPad P1 G4-20Y4Z9DVUS | |
| CrossMark / Responsiveness | |
| MSI CreatorPro Z16P B12UKST | |
| HP ZBook Studio 16 G9 62U04EA | |
| Media Intel Core i9-12950HX, NVIDIA RTX A5500 Laptop GPU (1501 - 1585, n=3) | |
| Dell Precision 7000 7670 Performance | |
| MSI WE76 11UM-456 | |
| HP ZBook Firefly 16 G9-6B897EA | |
| Lenovo ThinkPad P1 G4-20Y4Z9DVUS | |
| Dell Precision 7670 | |
| PCMark 10 Score | 6883 punti | |
Aiuto | ||
| AIDA64 / Memory Copy | |
| Dell Precision 7000 7670 Performance | |
| Media Intel Core i9-12950HX (59731 - 64732, n=7) | |
| Dell Precision 7670 | |
| MSI CreatorPro Z16P B12UKST | |
| HP ZBook Studio 16 G9 62U04EA | |
| HP ZBook Firefly 16 G9-6B897EA | |
| Lenovo ThinkPad P1 G4-20Y4Z9DVUS | |
| AIDA64 / Memory Read | |
| Dell Precision 7670 | |
| Dell Precision 7000 7670 Performance | |
| Media Intel Core i9-12950HX (59744 - 70359, n=7) | |
| MSI CreatorPro Z16P B12UKST | |
| HP ZBook Studio 16 G9 62U04EA | |
| HP ZBook Firefly 16 G9-6B897EA | |
| Lenovo ThinkPad P1 G4-20Y4Z9DVUS | |
| AIDA64 / Memory Write | |
| MSI CreatorPro Z16P B12UKST | |
| Dell Precision 7000 7670 Performance | |
| HP ZBook Studio 16 G9 62U04EA | |
| Dell Precision 7670 | |
| Media Intel Core i9-12950HX (57750 - 67899, n=7) | |
| HP ZBook Firefly 16 G9-6B897EA | |
| Lenovo ThinkPad P1 G4-20Y4Z9DVUS | |
| AIDA64 / Memory Latency | |
| MSI CreatorPro Z16P B12UKST | |
| HP ZBook Firefly 16 G9-6B897EA | |
| HP ZBook Studio 16 G9 62U04EA | |
| Dell Precision 7670 | |
| Media Intel Core i9-12950HX (84.5 - 92.2, n=7) | |
| Dell Precision 7000 7670 Performance | |
| Lenovo ThinkPad P1 G4-20Y4Z9DVUS | |
* ... Meglio usare valori piccoli
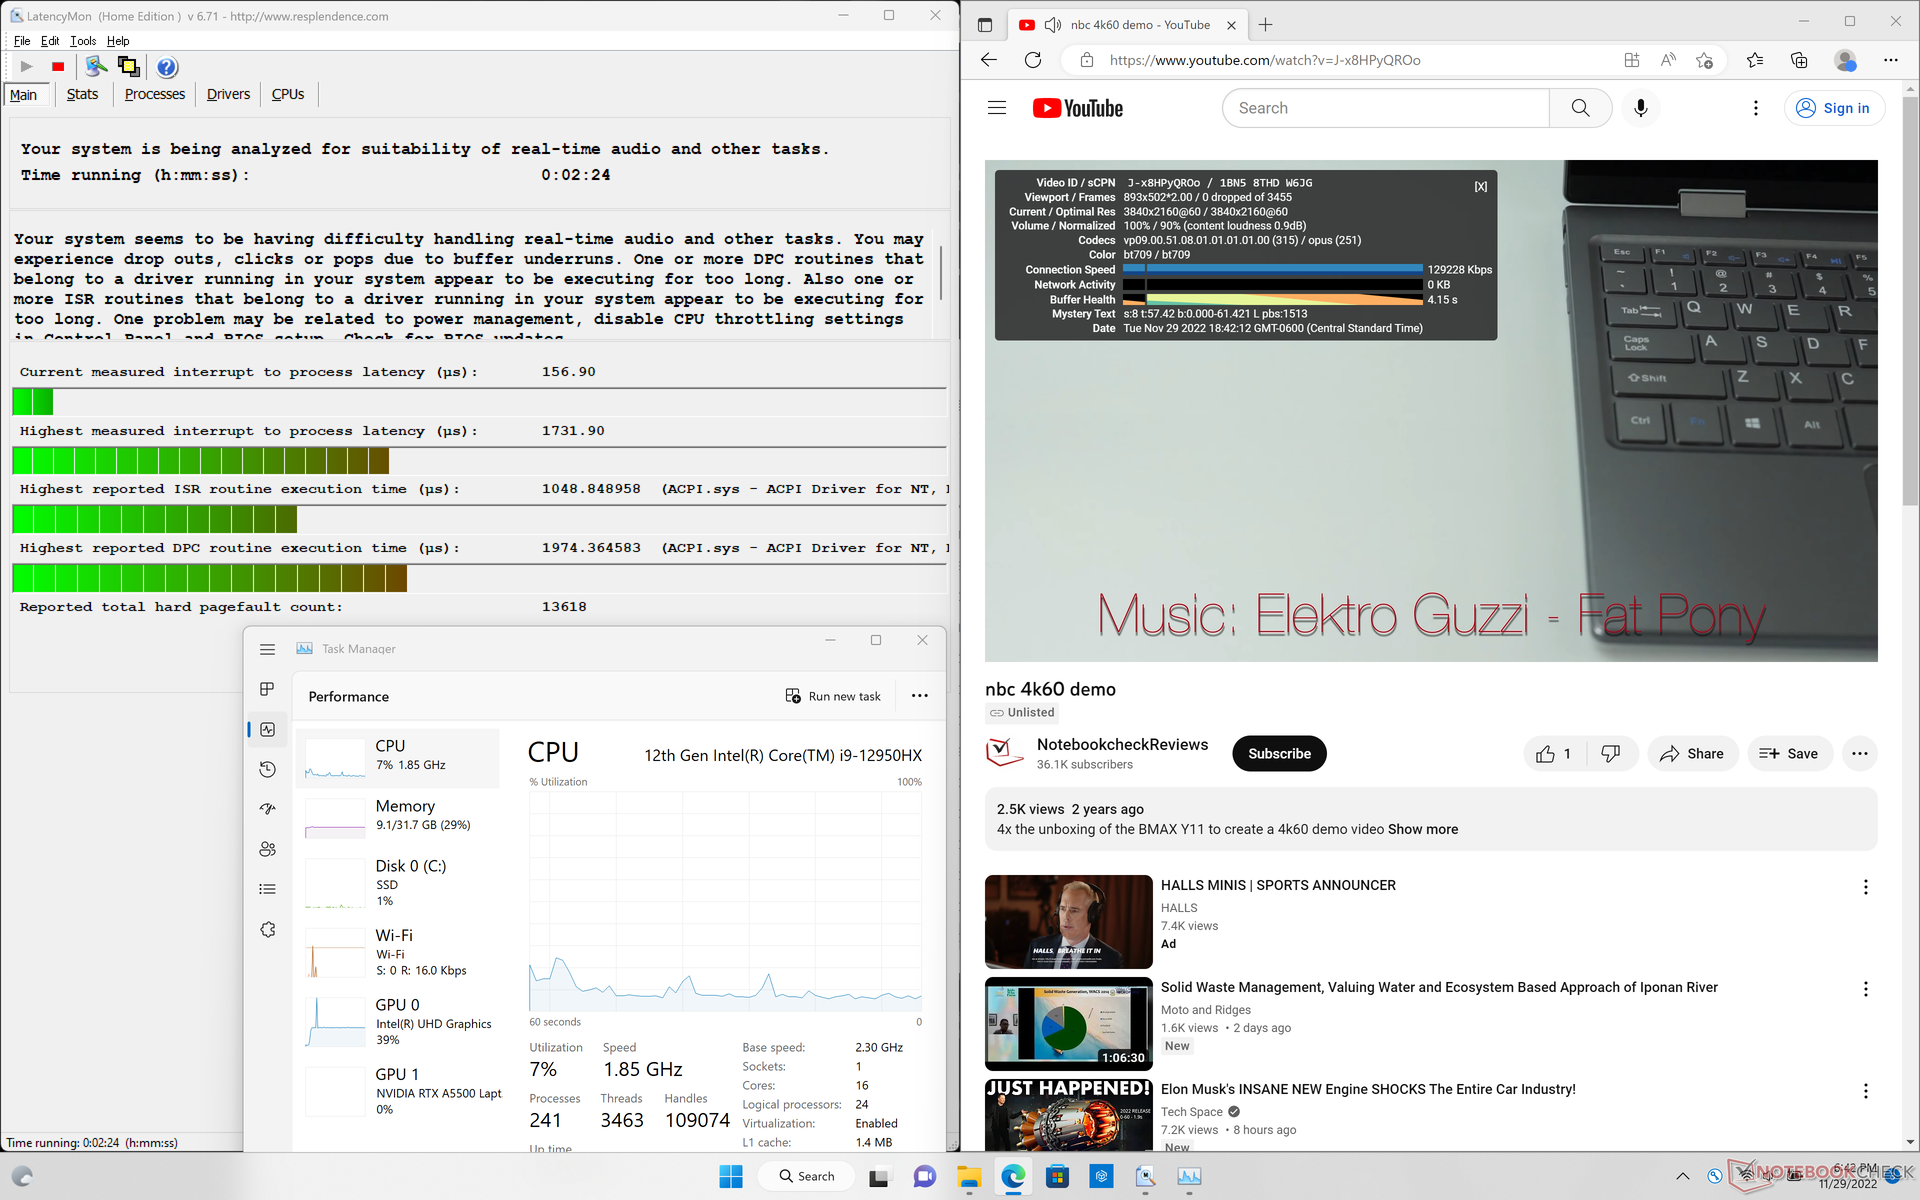
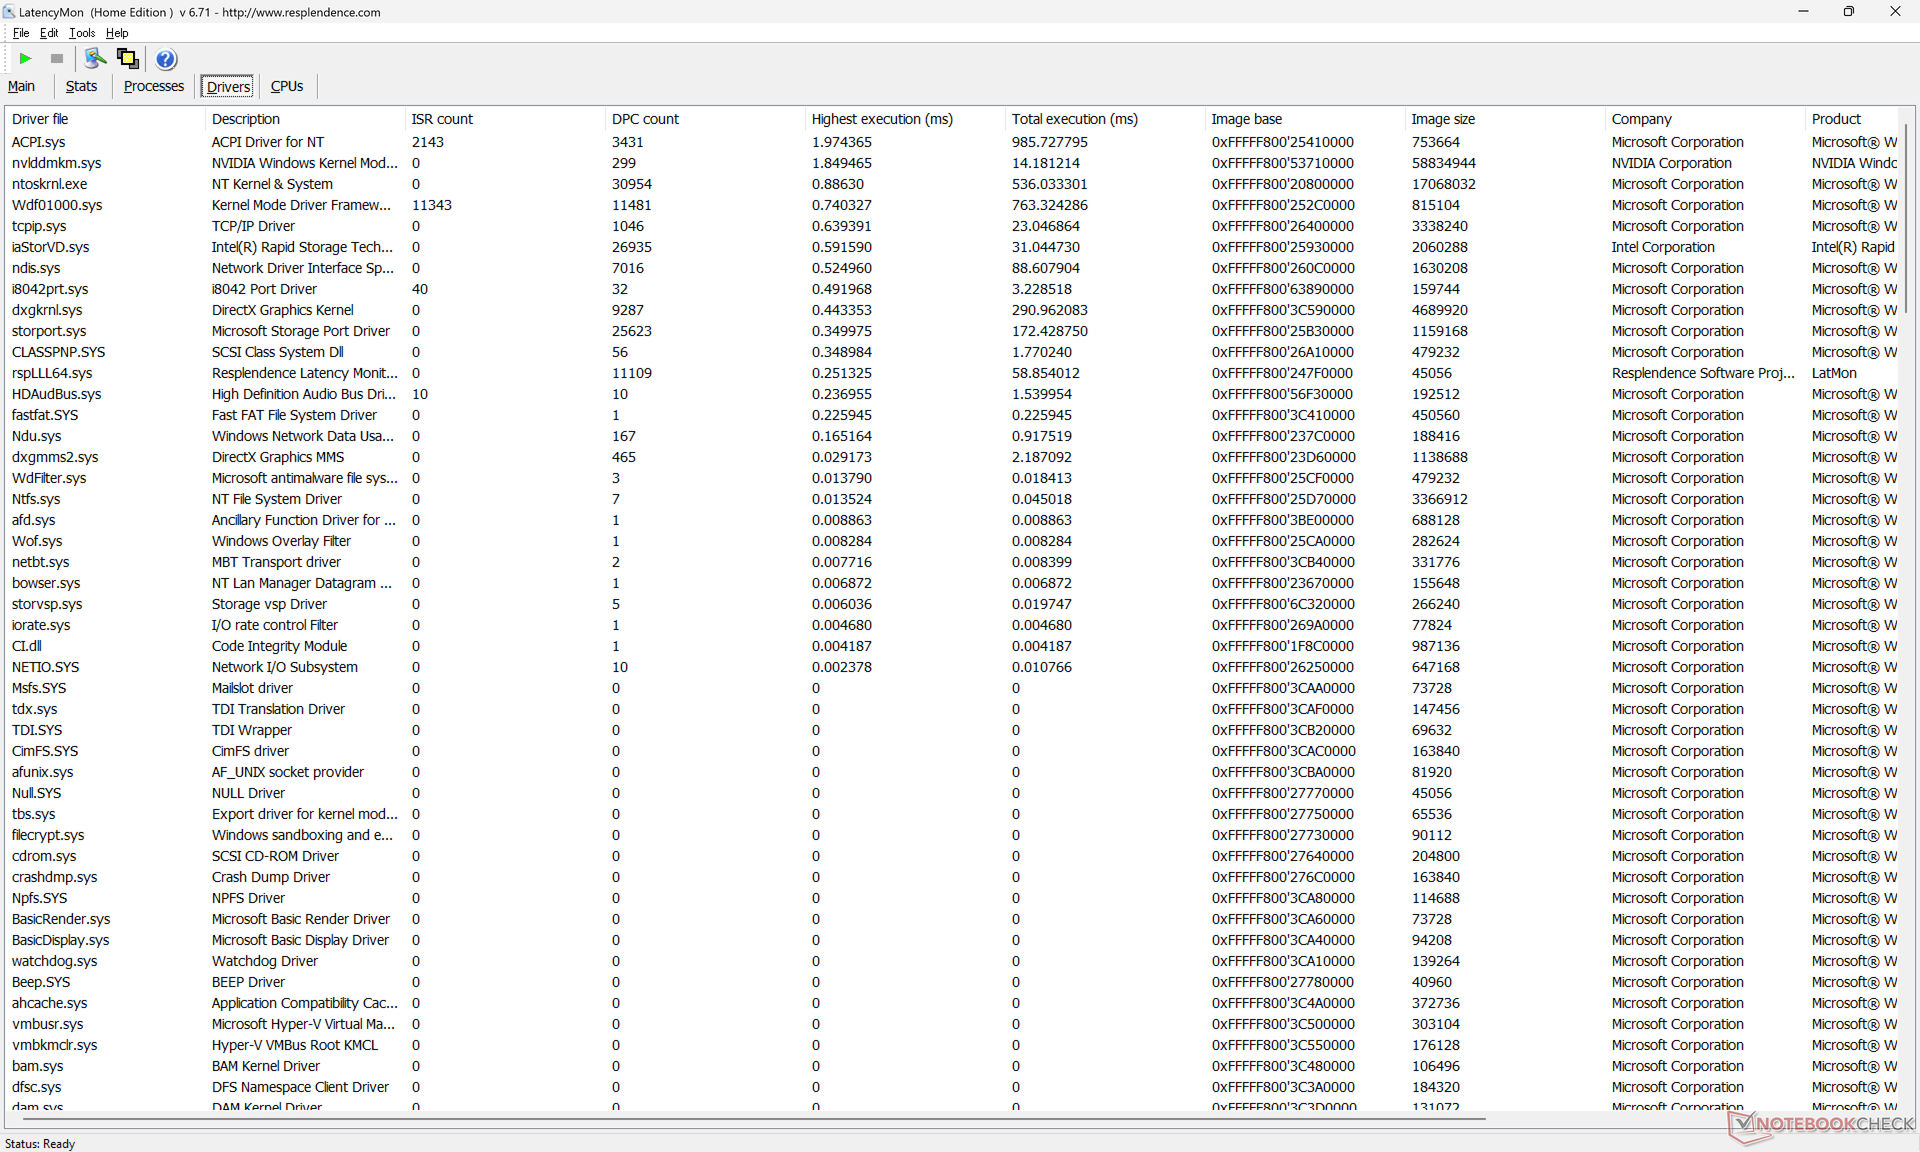
Latenza DPC
LatencyMon rivela problemi di DPC quando si aprono più schede del browser sulla nostra homepage, anche dopo diversi test. la riproduzione di video 4K a 60 FPS è invece fluida e senza cadute di fotogrammi.
| DPC Latencies / LatencyMon - interrupt to process latency (max), Web, Youtube, Prime95 | |
| Dell Precision 7000 7670 Performance | |
| Lenovo ThinkPad P1 G4-20Y4Z9DVUS | |
| Dell Precision 7670 | |
| HP ZBook Studio 16 G9 62U04EA | |
| HP ZBook Firefly 16 G9-6B897EA | |
| MSI CreatorPro Z16P B12UKST | |
* ... Meglio usare valori piccoli
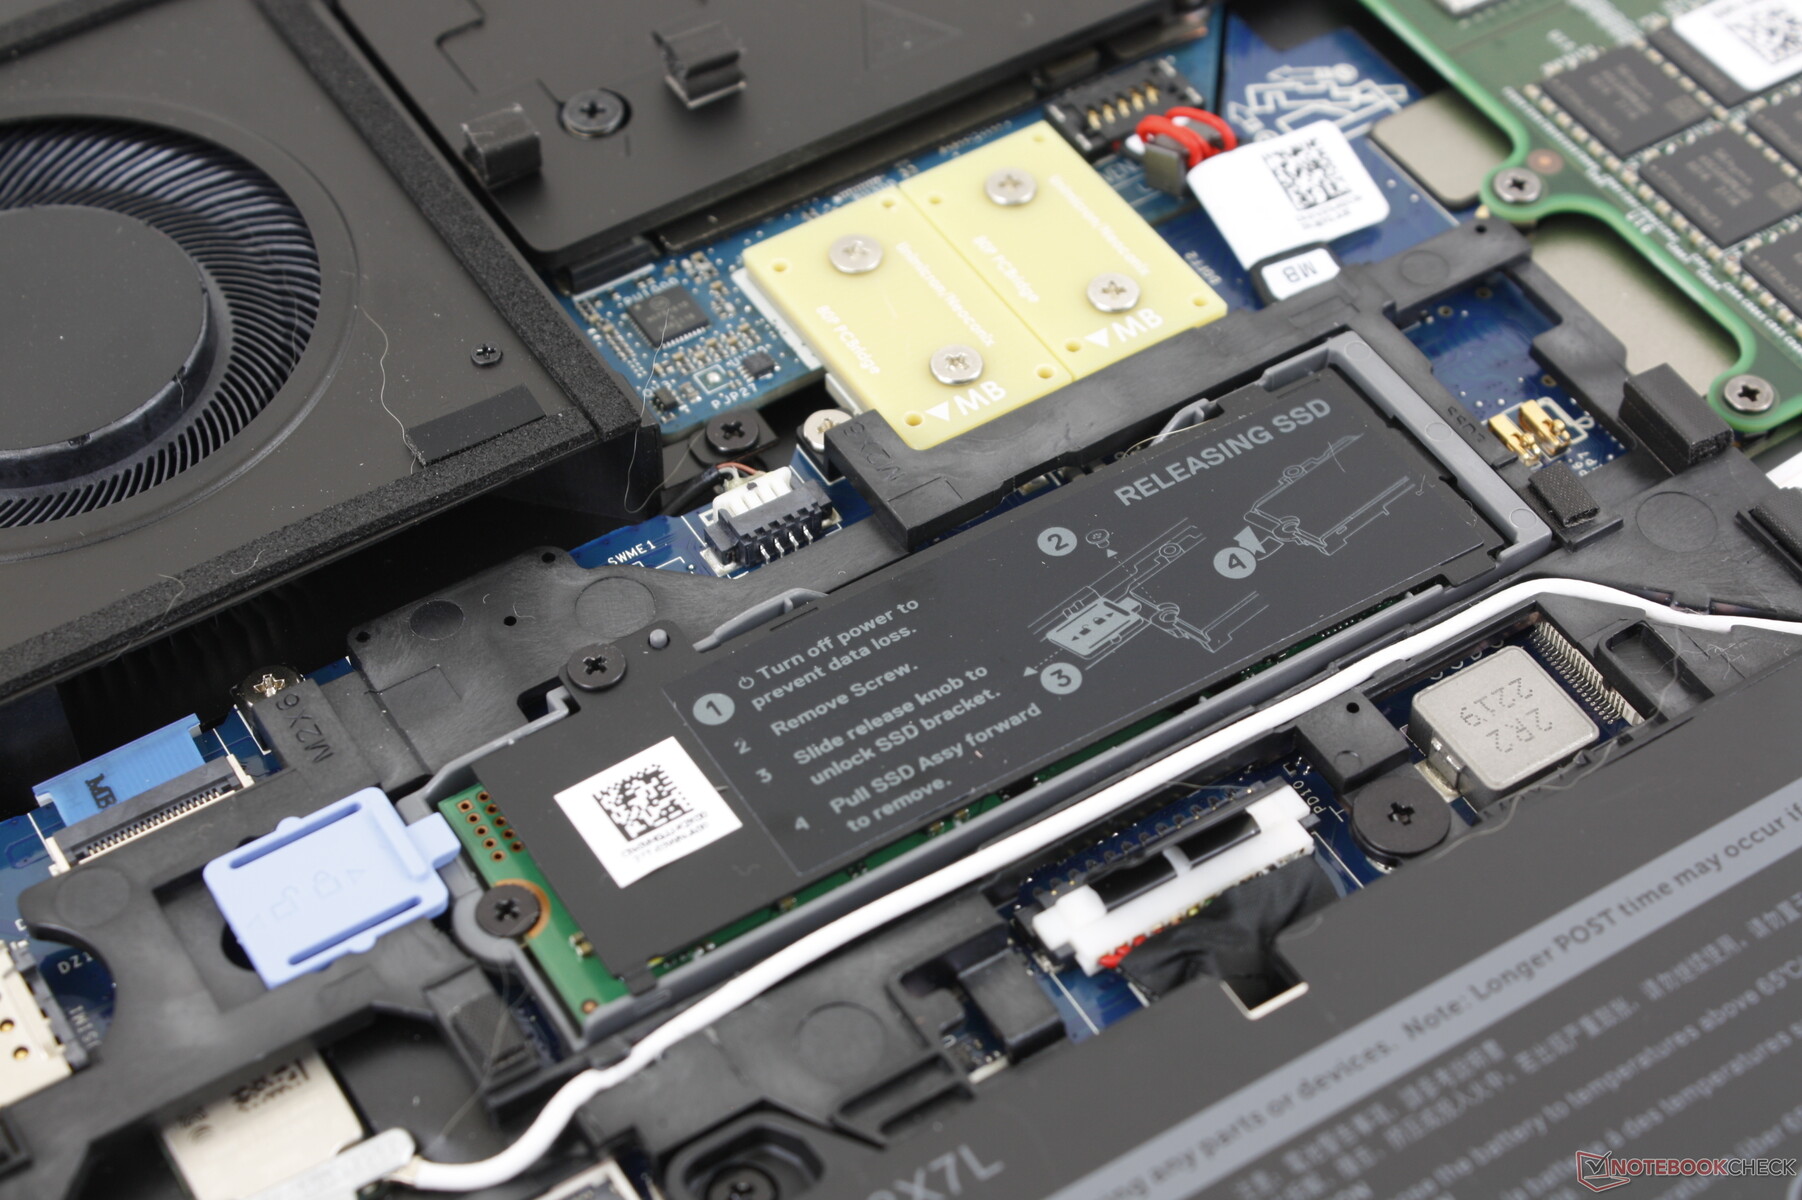
Dispositivi di archiviazione
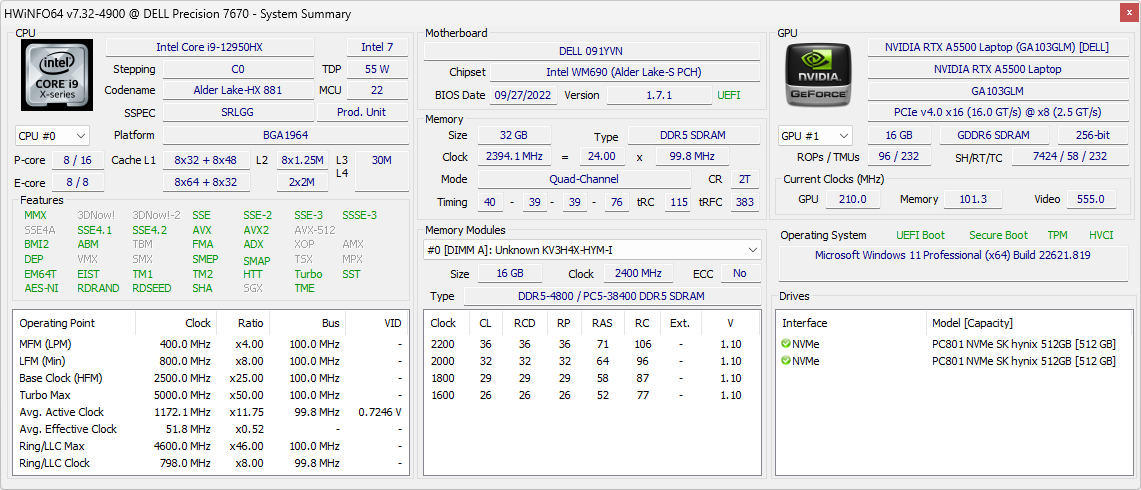
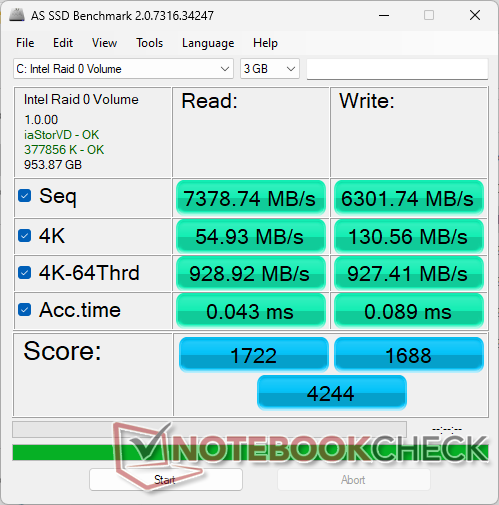
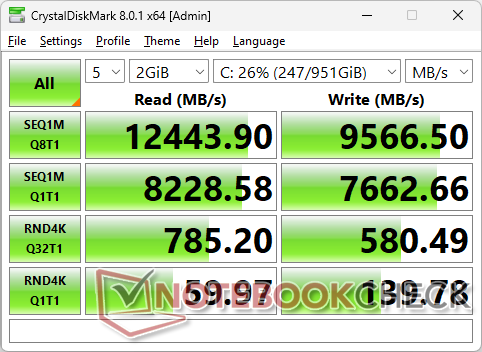
Gli utenti possono installare fino a tre unità SSD PCIe4 x4 NVMe M.2 2280, anziché solo due sul modello normale più sottile. Le due unità SK Hynix PC801 nella nostra unità sono installate in configurazione RAID 0 per ottenere velocità di lettura e scrittura sequenziali incredibilmente elevate, rispettivamente di circa 13000 MB/s e 10000 MB/s. Ogni slot SSD è dotato di un proprio diffusore di calore e di un pad termico per la dissipazione del calore.

| Drive Performance Rating - Percent | |
| MSI CreatorPro Z16P B12UKST -8! | |
| Dell Precision 7670 | |
| Dell Precision 7000 7670 Performance | |
| HP ZBook Studio 16 G9 62U04EA | |
| Lenovo ThinkPad P1 G4-20Y4Z9DVUS | |
| HP ZBook Firefly 16 G9-6B897EA | |
| Global Average -3 | |
* ... Meglio usare valori piccoli
Disk Throttling: DiskSpd Read Loop, Queue Depth 8
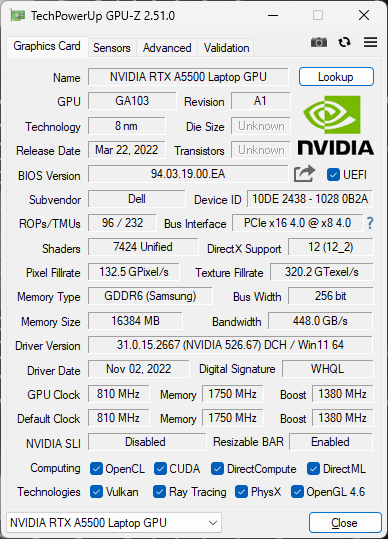
Prestazioni della GPU
La RTX A5500 è circa il 60-80% più veloce della RTX A2000 nel più sottile Precision 7670 per essere una delle workstation mobili più veloci attualmente sul mercato. Non è molto meglio della vecchia Quadro RTX 5000 di due anni fa Quadro RTX 5000 nella Acer ConceptD 9 Pro o Asus ProArt StudioBook Pro Xanche in termini di prestazioni di ray-tracing. La RTX A5000 nel più grande 17,3 pollici MSI WE76 supera la nostra RTX A5500 nella maggior parte dei benchmark.
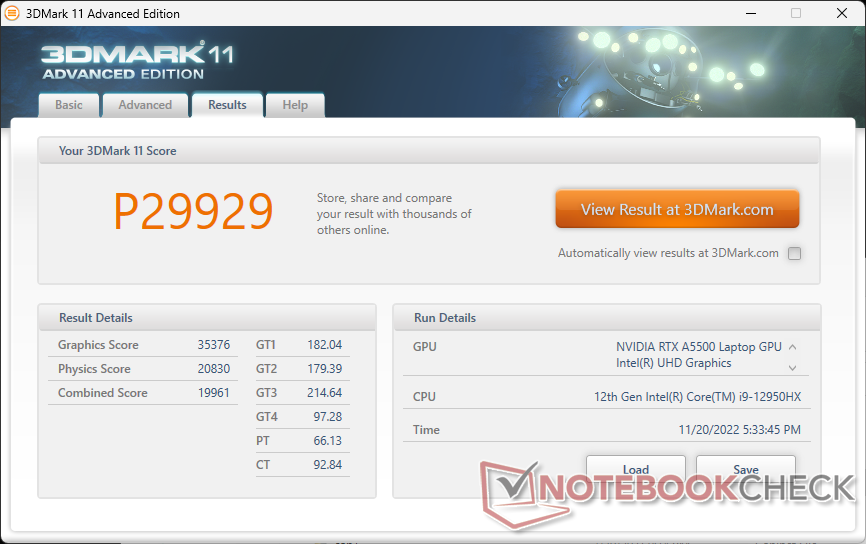
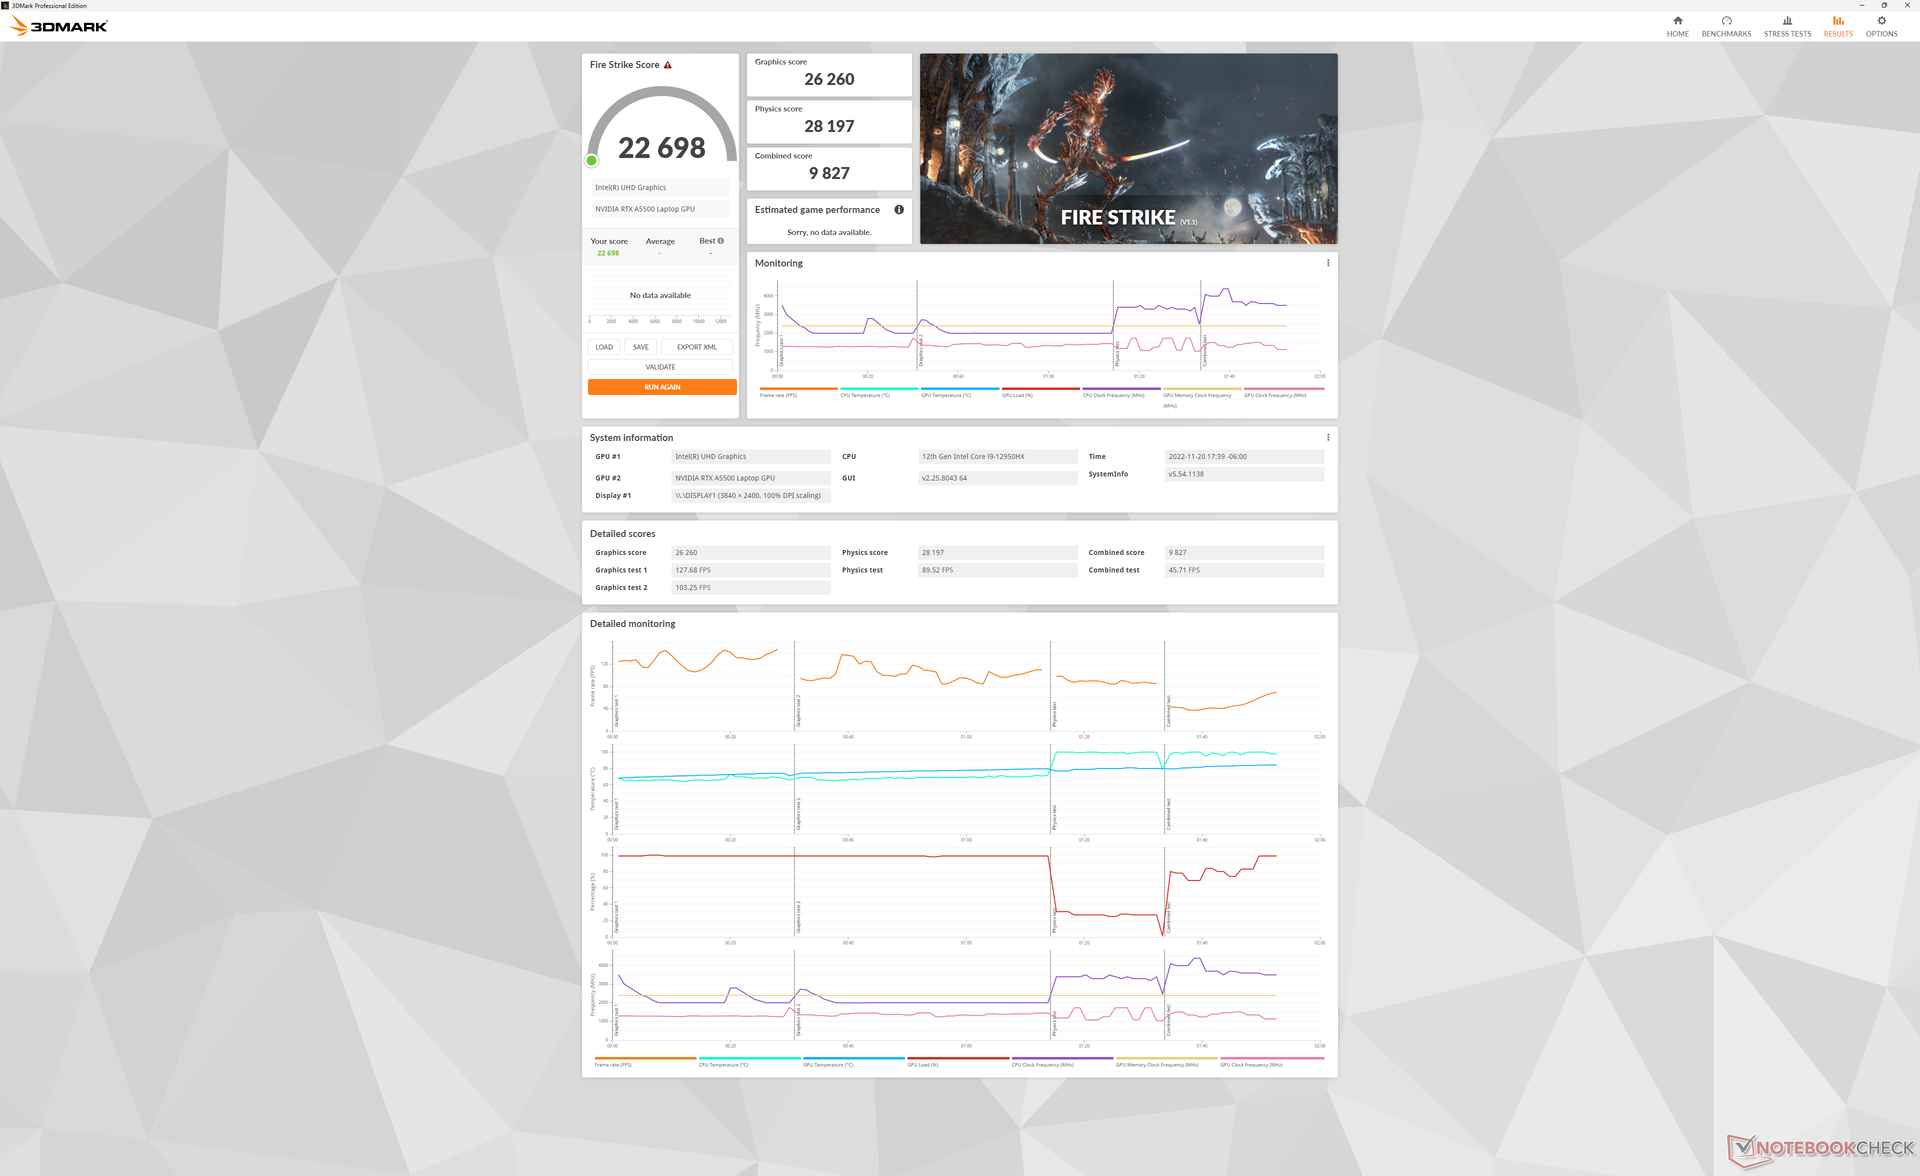
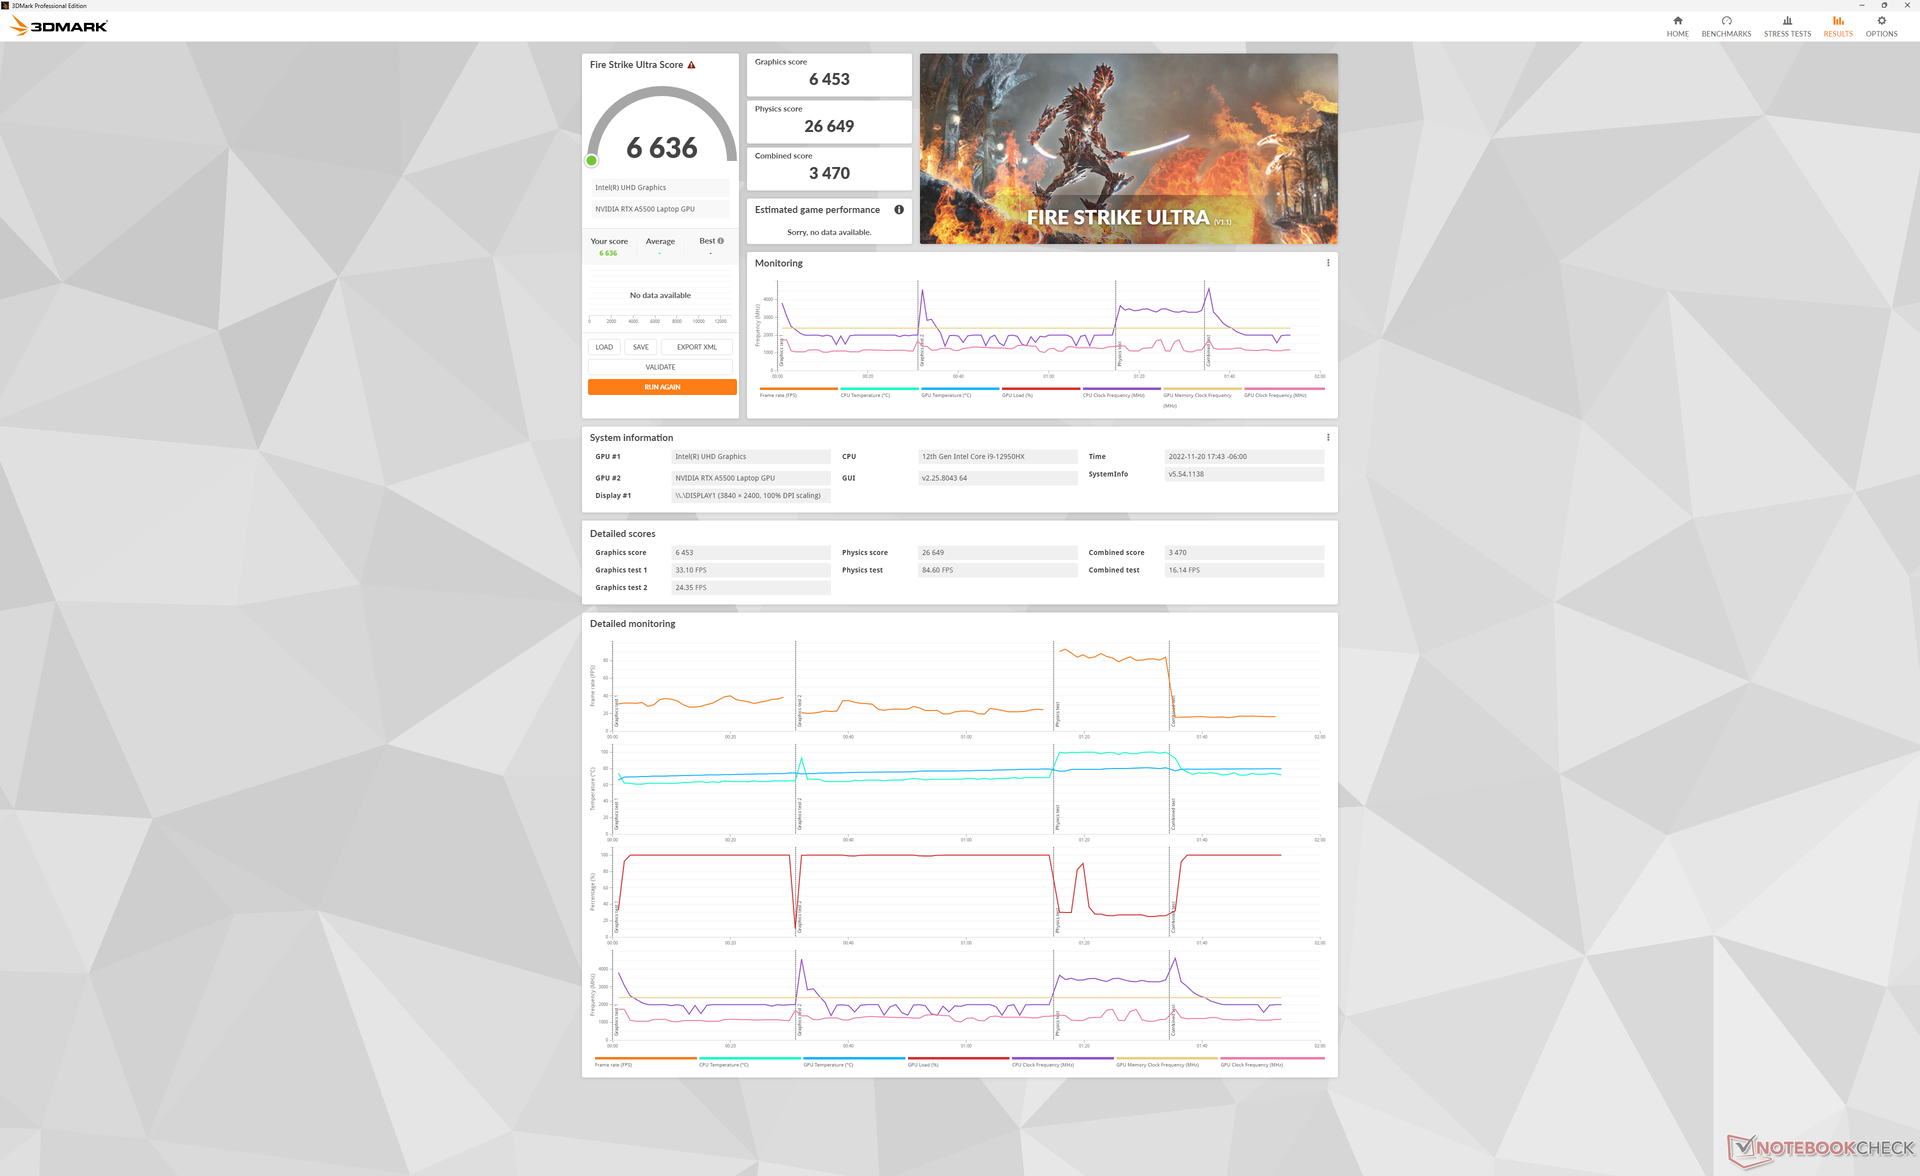
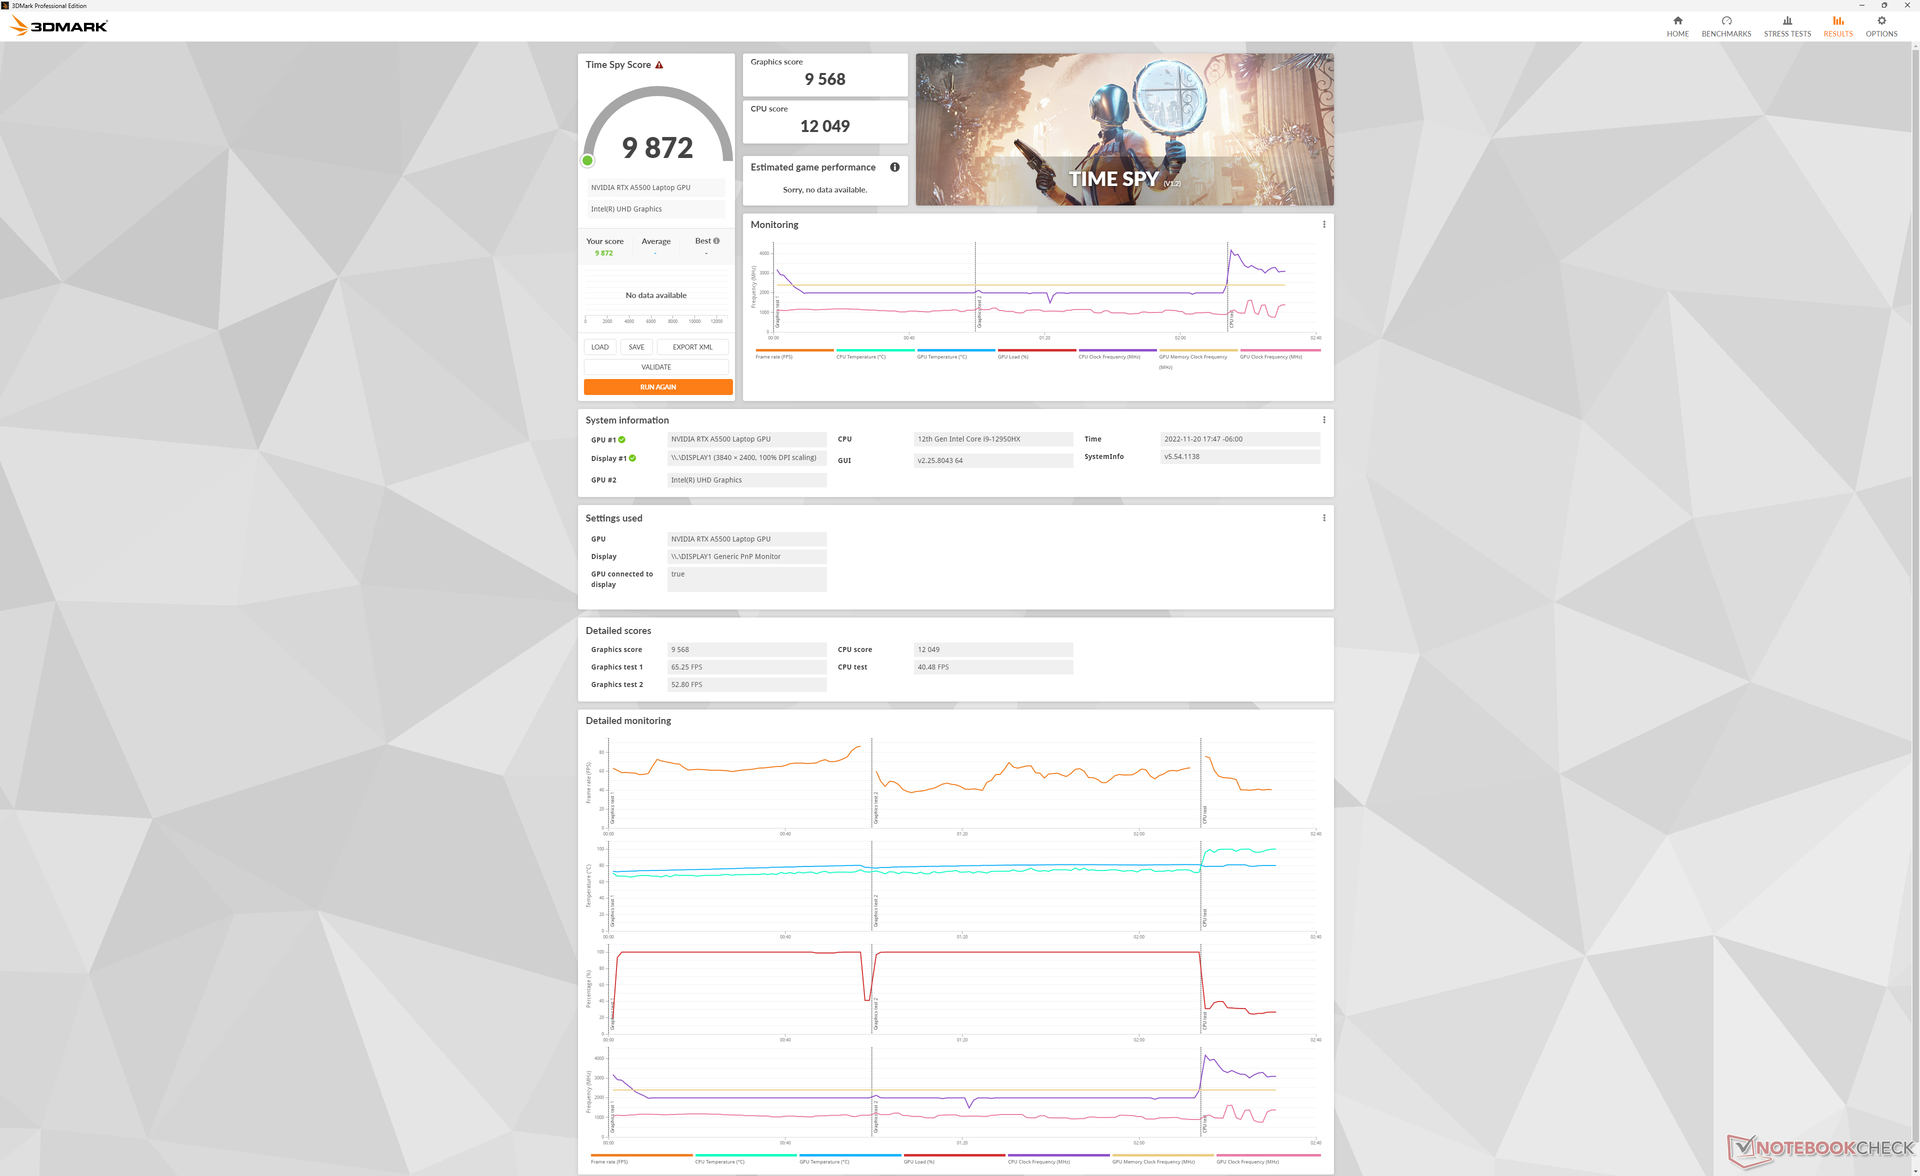
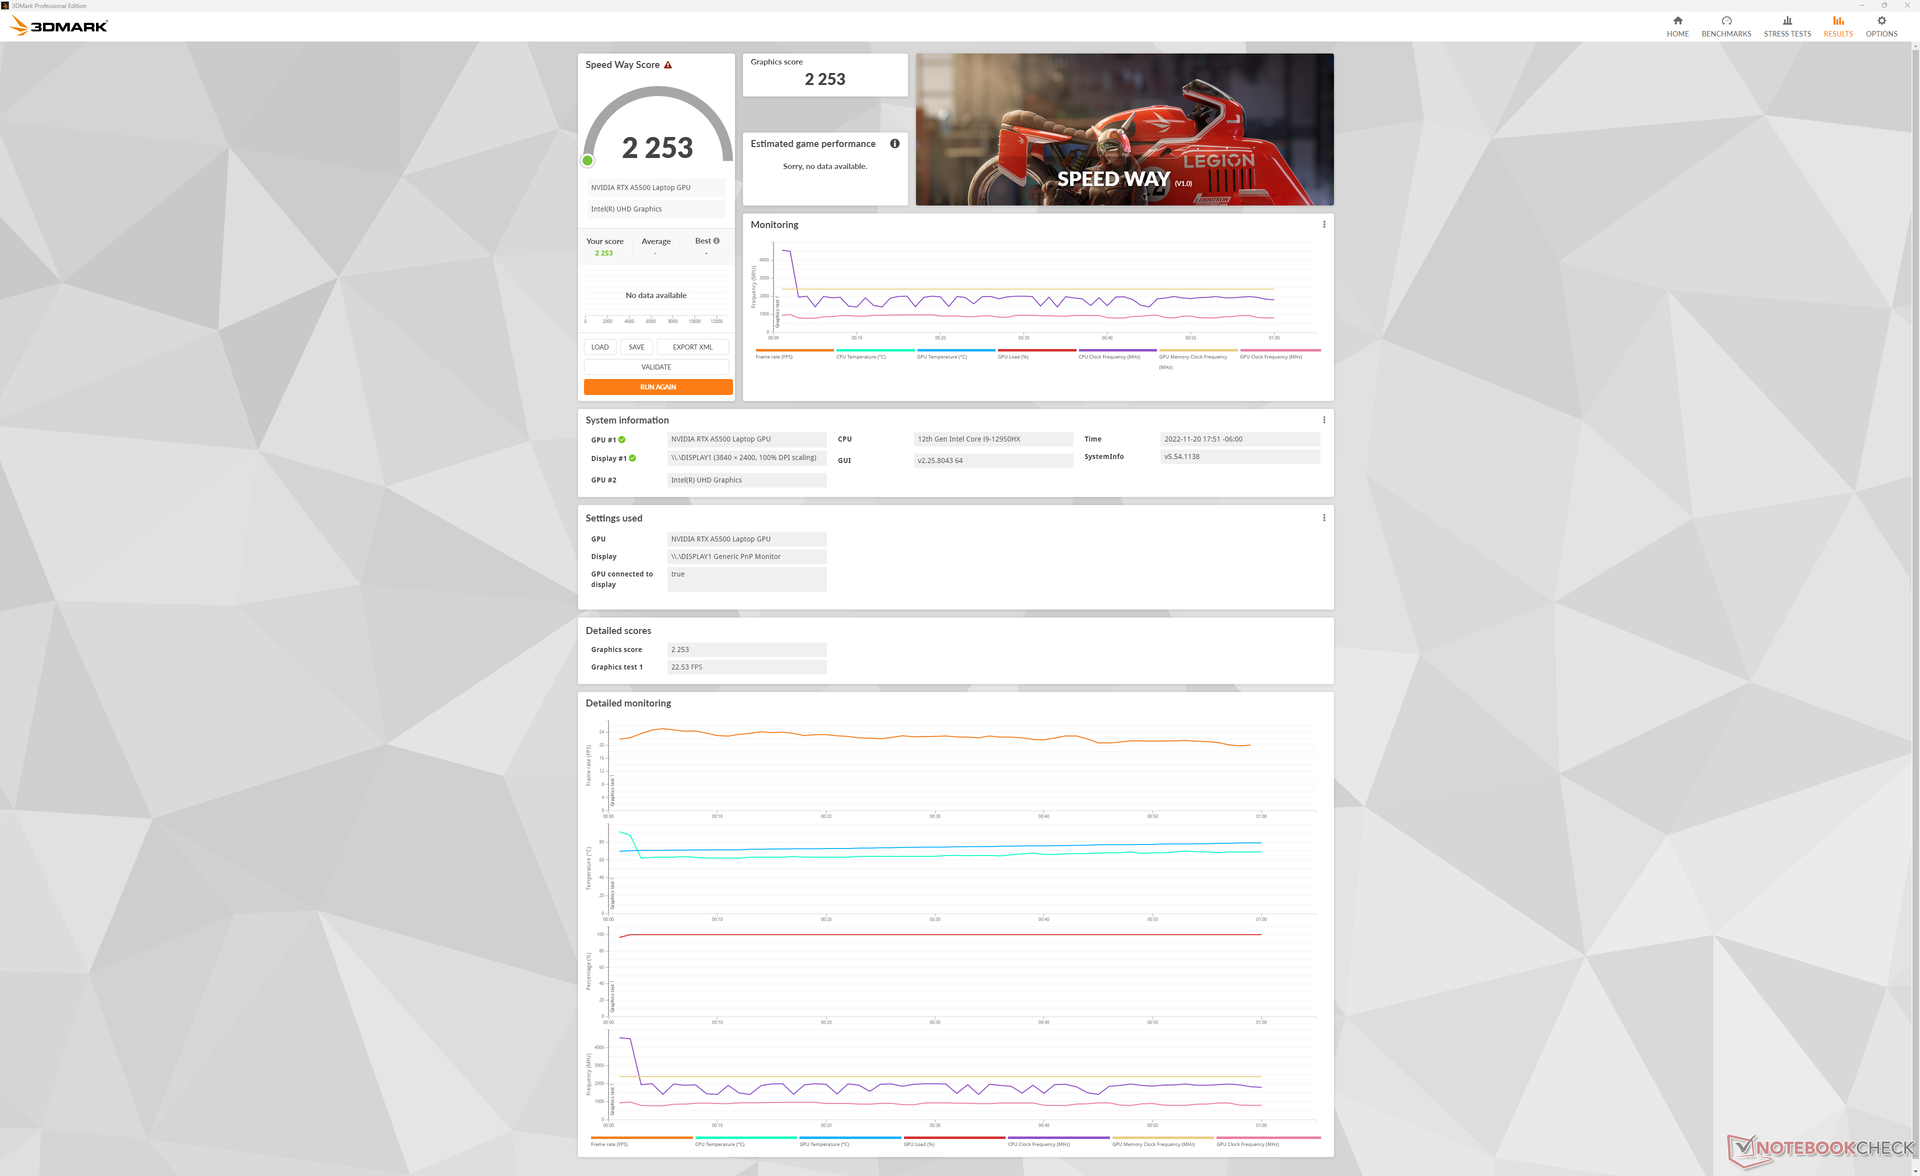
| 3DMark 11 Performance | 29929 punti | |
| 3DMark Fire Strike Score | 22698 punti | |
| 3DMark Time Spy Score | 9872 punti | |
Aiuto | ||
* ... Meglio usare valori piccoli
| Performance Rating - Percent | |
| Dell Precision 7000 7670 Performance | |
| MSI CreatorPro Z16P B12UKST | |
| Dell Precision 7670 | |
| HP ZBook Studio 16 G9 62U04EA | |
| Lenovo ThinkPad P1 G4-20Y4Z9DVUS -2! | |
| HP ZBook Firefly 16 G9-6B897EA | |
| The Witcher 3 - 1920x1080 Ultra Graphics & Postprocessing (HBAO+) | |
| Dell Precision 7000 7670 Performance | |
| MSI CreatorPro Z16P B12UKST | |
| Dell Precision 7670 | |
| HP ZBook Studio 16 G9 62U04EA | |
| Lenovo ThinkPad P1 G4-20Y4Z9DVUS | |
| HP ZBook Firefly 16 G9-6B897EA | |
| GTA V - 1920x1080 Highest Settings possible AA:4xMSAA + FX AF:16x | |
| Dell Precision 7000 7670 Performance | |
| MSI CreatorPro Z16P B12UKST | |
| Dell Precision 7670 | |
| HP ZBook Studio 16 G9 62U04EA | |
| HP ZBook Firefly 16 G9-6B897EA | |
| Final Fantasy XV Benchmark - 1920x1080 High Quality | |
| Dell Precision 7000 7670 Performance | |
| MSI CreatorPro Z16P B12UKST | |
| Dell Precision 7670 | |
| HP ZBook Studio 16 G9 62U04EA | |
| Lenovo ThinkPad P1 G4-20Y4Z9DVUS | |
| HP ZBook Firefly 16 G9-6B897EA | |
| Strange Brigade - 1920x1080 ultra AA:ultra AF:16 | |
| Dell Precision 7000 7670 Performance | |
| MSI CreatorPro Z16P B12UKST | |
| Dell Precision 7670 | |
| HP ZBook Studio 16 G9 62U04EA | |
| HP ZBook Firefly 16 G9-6B897EA | |
| Dota 2 Reborn - 1920x1080 ultra (3/3) best looking | |
| Dell Precision 7000 7670 Performance | |
| HP ZBook Studio 16 G9 62U04EA | |
| MSI CreatorPro Z16P B12UKST | |
| Dell Precision 7670 | |
| Lenovo ThinkPad P1 G4-20Y4Z9DVUS | |
| HP ZBook Firefly 16 G9-6B897EA | |
| X-Plane 11.11 - 1920x1080 high (fps_test=3) | |
| Dell Precision 7000 7670 Performance | |
| MSI CreatorPro Z16P B12UKST | |
| HP ZBook Studio 16 G9 62U04EA | |
| Dell Precision 7670 | |
| Lenovo ThinkPad P1 G4-20Y4Z9DVUS | |
| HP ZBook Firefly 16 G9-6B897EA | |
| Cyberpunk 2077 1.6 | |
| 1920x1080 Low Preset | |
| Dell Precision 7000 7670 Performance | |
| Dell Precision 7670 | |
| MSI CreatorPro Z16P B12UKST | |
| HP ZBook Studio 16 G9 62U04EA | |
| 1920x1080 Medium Preset | |
| Dell Precision 7000 7670 Performance | |
| MSI CreatorPro Z16P B12UKST | |
| Dell Precision 7670 | |
| HP ZBook Studio 16 G9 62U04EA | |
| 1920x1080 High Preset | |
| Dell Precision 7000 7670 Performance | |
| Dell Precision 7670 | |
| MSI CreatorPro Z16P B12UKST | |
| HP ZBook Studio 16 G9 62U04EA | |
| 1920x1080 Ultra Preset | |
| Dell Precision 7000 7670 Performance | |
| Dell Precision 7670 | |
| MSI CreatorPro Z16P B12UKST | |
| HP ZBook Studio 16 G9 62U04EA | |
| 2560x1440 Ultra Preset | |
| Dell Precision 7000 7670 Performance | |
| Dell Precision 7670 | |
| MSI CreatorPro Z16P B12UKST | |
| HP ZBook Studio 16 G9 62U04EA | |
| 3840x2160 Ultra Preset | |
| Dell Precision 7000 7670 Performance | |
Quando il computer è rimasto acceso al minimo per un'ora Witcher 3 per un'ora, siamo stati in grado di registrare forti cali di frame rate dopo circa 10 minuti di test, come mostra il grafico seguente. Questo suggerisce una scarsa priorità dei programmi o l'interruzione di attività in background che possono interferire con le prestazioni del programma principale.
Witcher 3 FPS Chart
| basso | medio | alto | ultra | QHD | 4K | |
| GTA V (2015) | 183.4 | 178.1 | 166.2 | 102.6 | 99.2 | |
| The Witcher 3 (2015) | 421.2 | 306.8 | 205.4 | 101.5 | 62.5 | |
| Dota 2 Reborn (2015) | 193.3 | 171.3 | 161.8 | 152.9 | 131.4 | |
| Final Fantasy XV Benchmark (2018) | 170.1 | 138.9 | 107.8 | 78.9 | 43.5 | |
| X-Plane 11.11 (2018) | 146.2 | 134.3 | 107.8 | 92.7 | ||
| Strange Brigade (2018) | 377 | 244 | 200 | 177.9 | 129.3 | |
| Metro Exodus (2019) | 171 | 125.8 | 95.3 | 75.7 | 58.5 | 31.3 |
| Borderlands 3 (2019) | 162.9 | 135.4 | 110.4 | 89.3 | 62.7 | 30.2 |
| Gears Tactics (2020) | 314.1 | 189.7 | 139.2 | 110.1 | 77.1 | 34.9 |
| Horizon Zero Dawn (2020) | 139 | 130 | 111 | 101 | 89 | 42 |
| Watch Dogs Legion (2020) | 119 | 98 | 93 | 77 | 58 | 30 |
| Dirt 5 (2020) | 167.6 | 130 | 114.8 | 92.2 | 71.9 | 39.8 |
| Hitman 3 (2021) | 229 | 186.6 | 179.9 | 161.4 | 104.6 | 43.8 |
| Far Cry 6 (2021) | 132 | 115 | 104 | 95 | 79 | 42 |
| Guardians of the Galaxy (2021) | 142 | 124 | 137 | 134 | 104 | 49 |
| God of War (2022) | 128.9 | 119.6 | 105.6 | 79 | 62.2 | 35.6 |
| Cyberpunk 2077 1.6 (2022) | 93.9 | 80.2 | 79.3 | 75.7 | 45.3 | 17.8 |
| F1 22 (2022) | 190.8 | 188.2 | 163.1 | 66.4 | 40.8 | 18.8 |
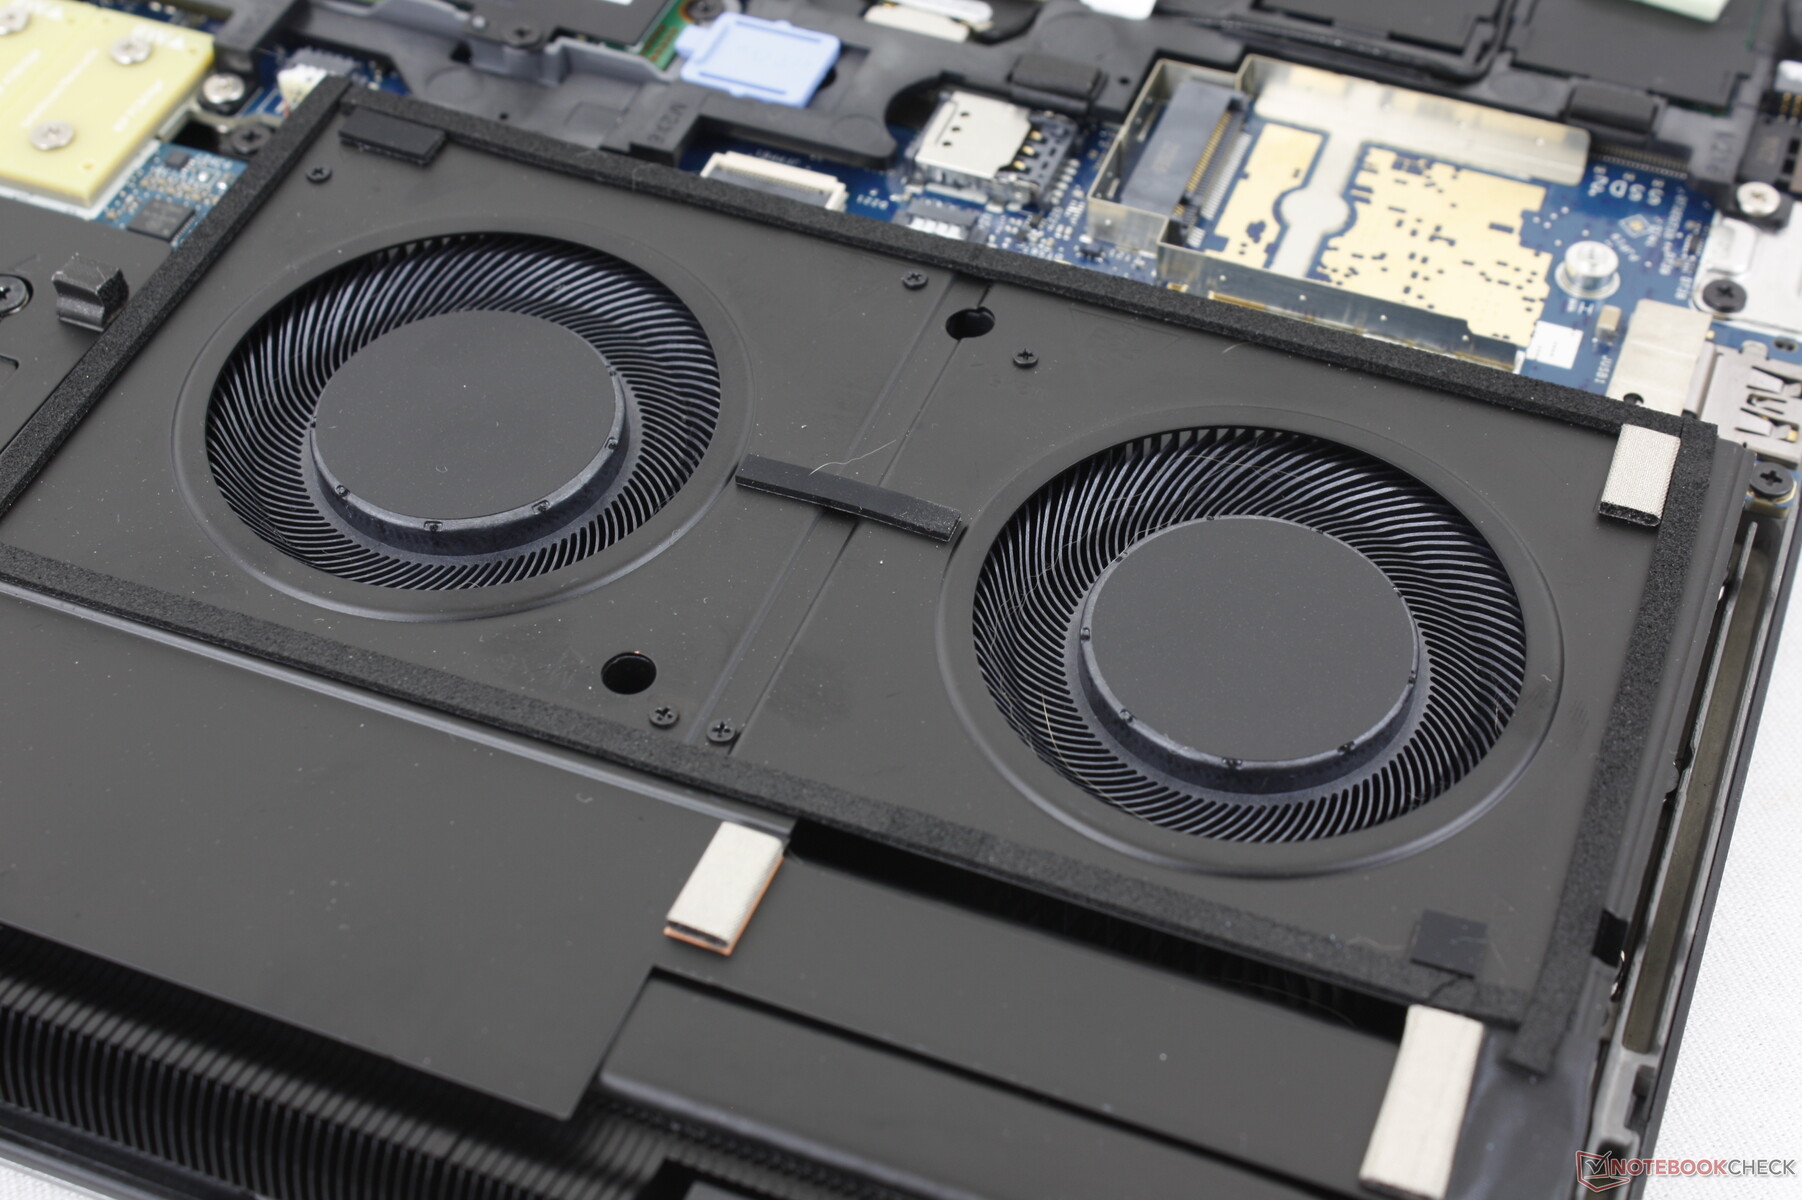
Emissioni
Rumore del sistema
Le ventole di Precision 7670 Performance tendono a pulsare più frequentemente rispetto a quelle del più sottile Precision 7670, probabilmente a causa dell'aumento del Turbo Boost del Core i9-12950HX rispetto al Core i7-12850HX. Tuttavia, questo non dovrebbe essere un problema quando il profilo energetico è impostato sulla modalità Bilanciata o Silenziosa
Il rumore complessivo della ventola è generalmente più silenzioso di quello registrato sul più sottile Precision 7670. I carichi di gioco si stabilizzano tra i 42 e i 47 dB(A) rispetto ai 45-49 dB(A) del modello più piccolo. Siamo riusciti a raggiungere un massimo di 48 dB(A) quando sia la CPU che la GPU sono al 100% di utilizzo.
Rumorosità
| Idle |
| 24 / 24 / 38 dB(A) |
| Sotto carico |
| 46.3 / 47.9 dB(A) |
 | ||
30 dB silenzioso 40 dB(A) udibile 50 dB(A) rumoroso |
||
min: | ||
| Dell Precision 7000 7670 Performance RTX A5500 Laptop GPU, i9-12950HX | MSI CreatorPro Z16P B12UKST RTX A3000 Laptop GPU, i7-12700H, Samsung PM9A1 MZVL21T0HCLR | HP ZBook Studio 16 G9 62U04EA RTX A2000 Laptop GPU, i7-12800H, Micron 3400 1TB MTFDKBA1T0TFH | HP ZBook Firefly 16 G9-6B897EA T550 Laptop GPU, i7-1265U, Samsung PM9A1 MZVL21T0HCLR | Lenovo ThinkPad P1 G4-20Y4Z9DVUS T1200 Laptop GPU, i7-11800H, Samsung PM9A1 MZVL2512HCJQ | Dell Precision 7670 RTX A2000 Laptop GPU, i7-12850HX, SK Hynix HFS001TEJ9X115N | |
|---|---|---|---|---|---|---|
| Noise | 1% | 3% | 10% | 2% | 4% | |
| off /ambiente * | 23.9 | 24.1 -1% | 24 -0% | 23.8 -0% | 24.3 -2% | 22.7 5% |
| Idle Minimum * | 24 | 27.1 -13% | 24 -0% | 23.8 1% | 24.3 -1% | 22.9 5% |
| Idle Average * | 24 | 27.1 -13% | 27.7 -15% | 23.8 1% | 24.3 -1% | 22.9 5% |
| Idle Maximum * | 38 | 27.1 29% | 27.7 27% | 23.8 37% | 26.6 30% | 24.5 36% |
| Load Average * | 46.3 | 42.9 7% | 39.8 14% | 39.4 15% | 46.8 -1% | 48.7 -5% |
| Witcher 3 ultra * | 41.9 | 44 -5% | 44.3 -6% | 40.5 3% | 46.8 -12% | 45.2 -8% |
| Load Maximum * | 47.9 | 47 2% | 47.7 -0% | 41.4 14% | 46.8 2% | 52.1 -9% |
* ... Meglio usare valori piccoli
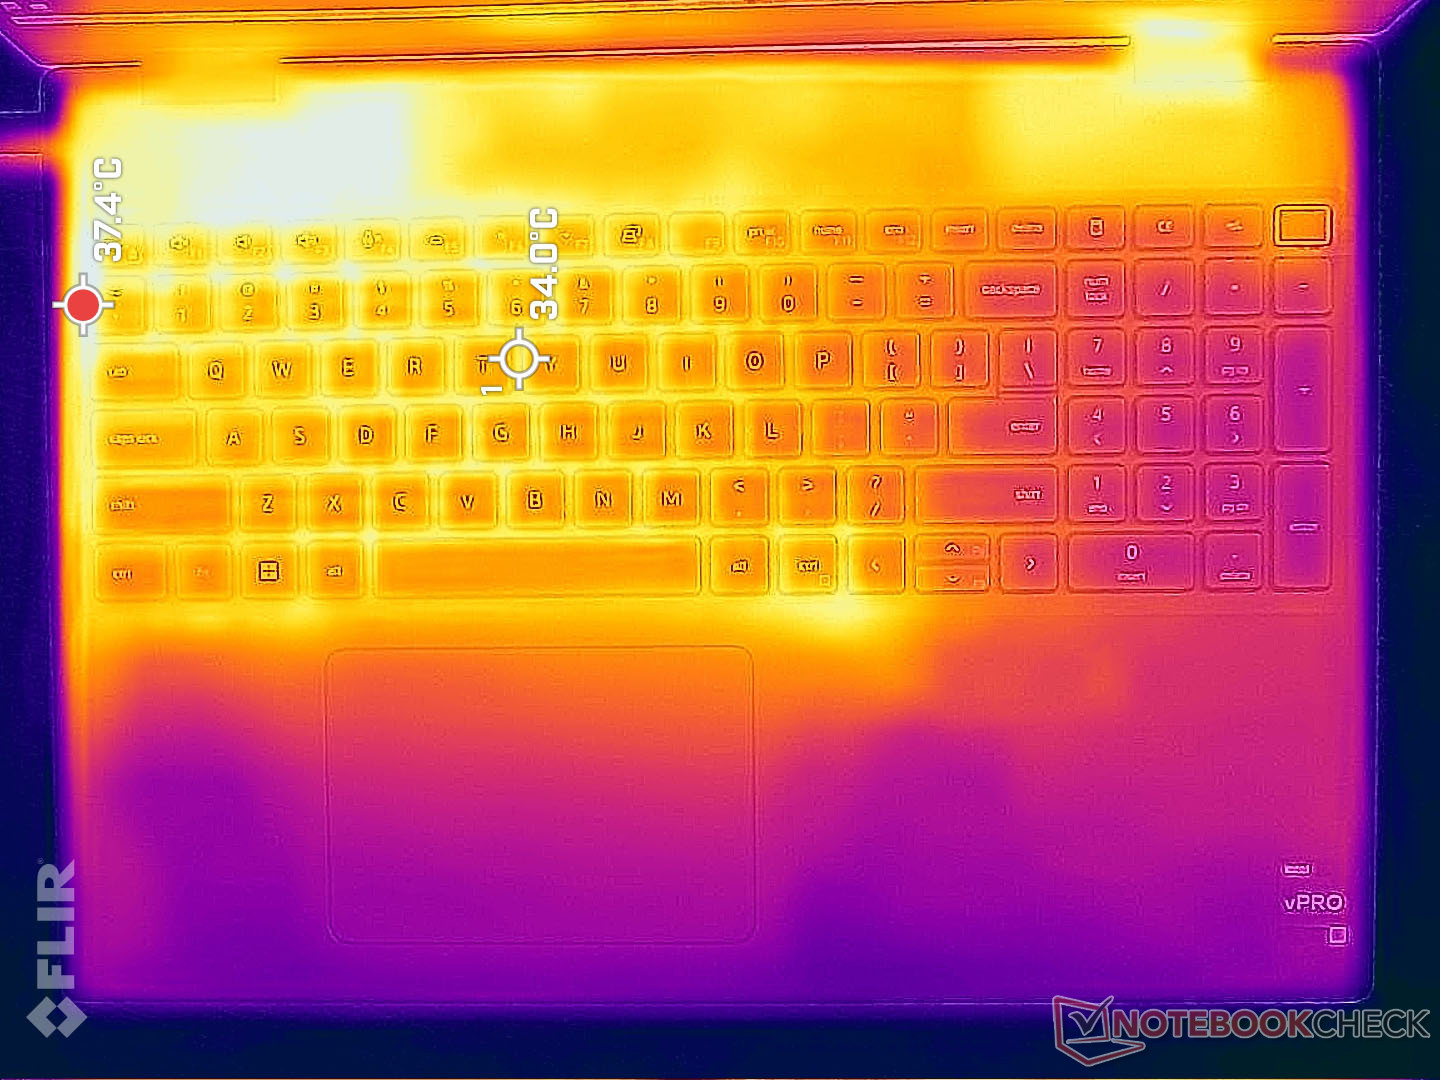
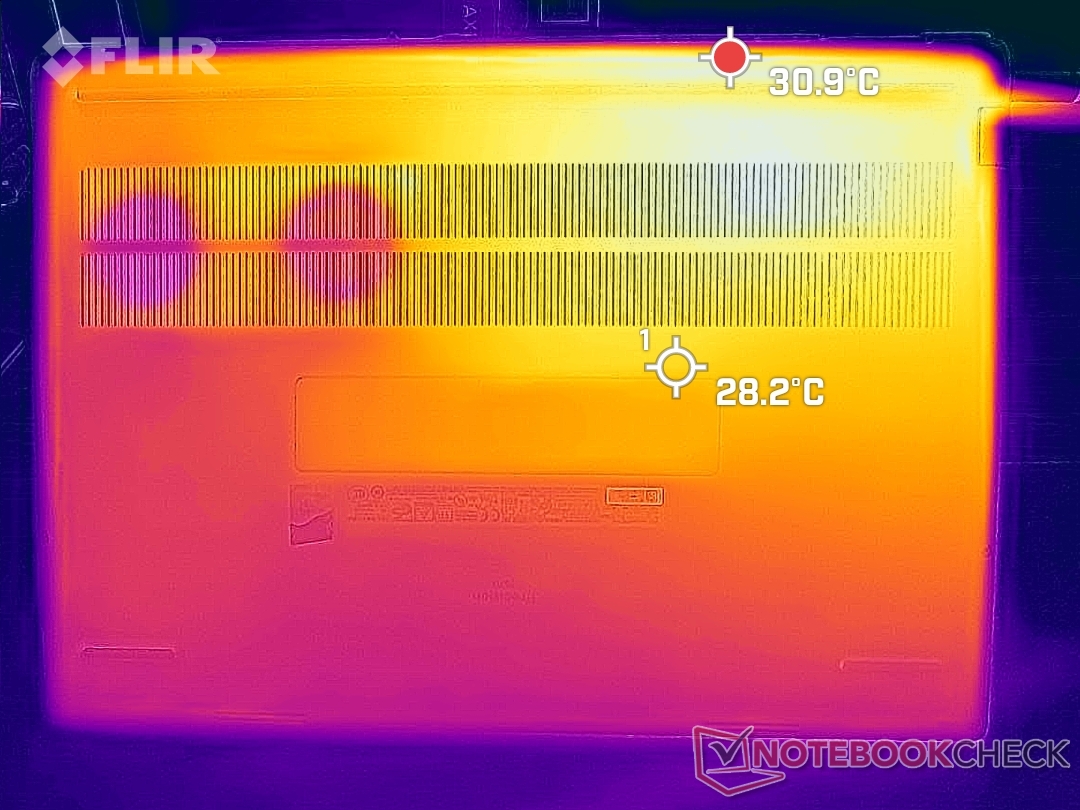
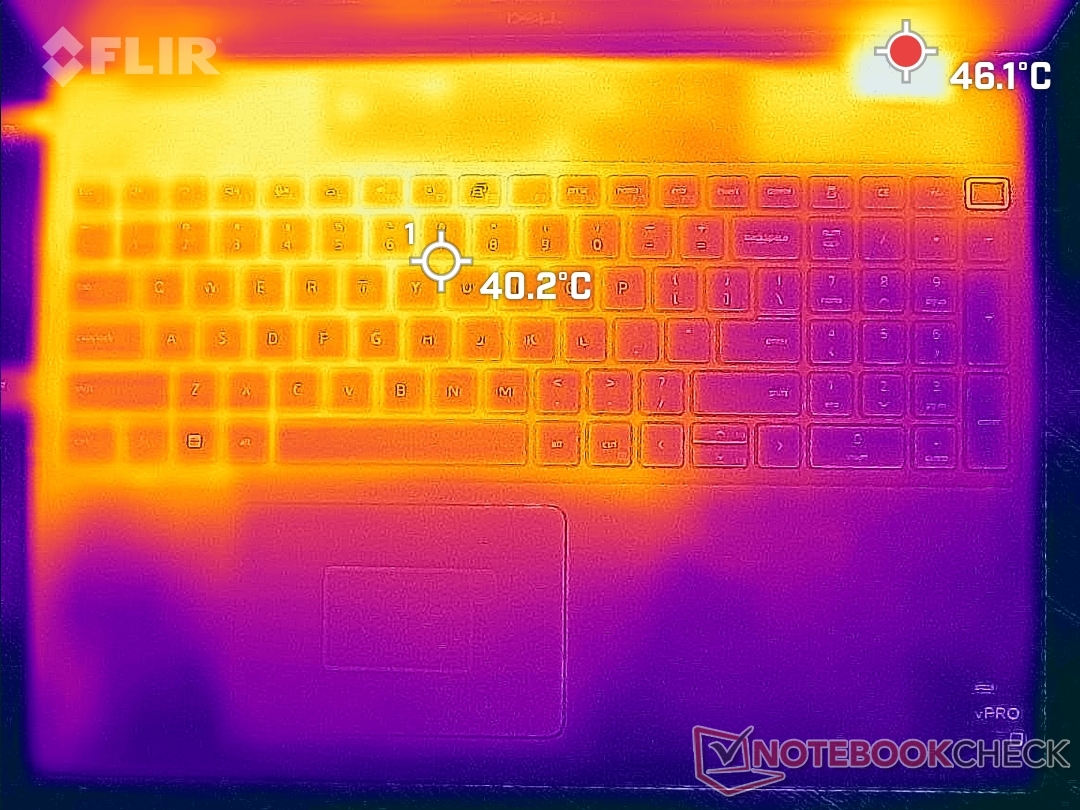
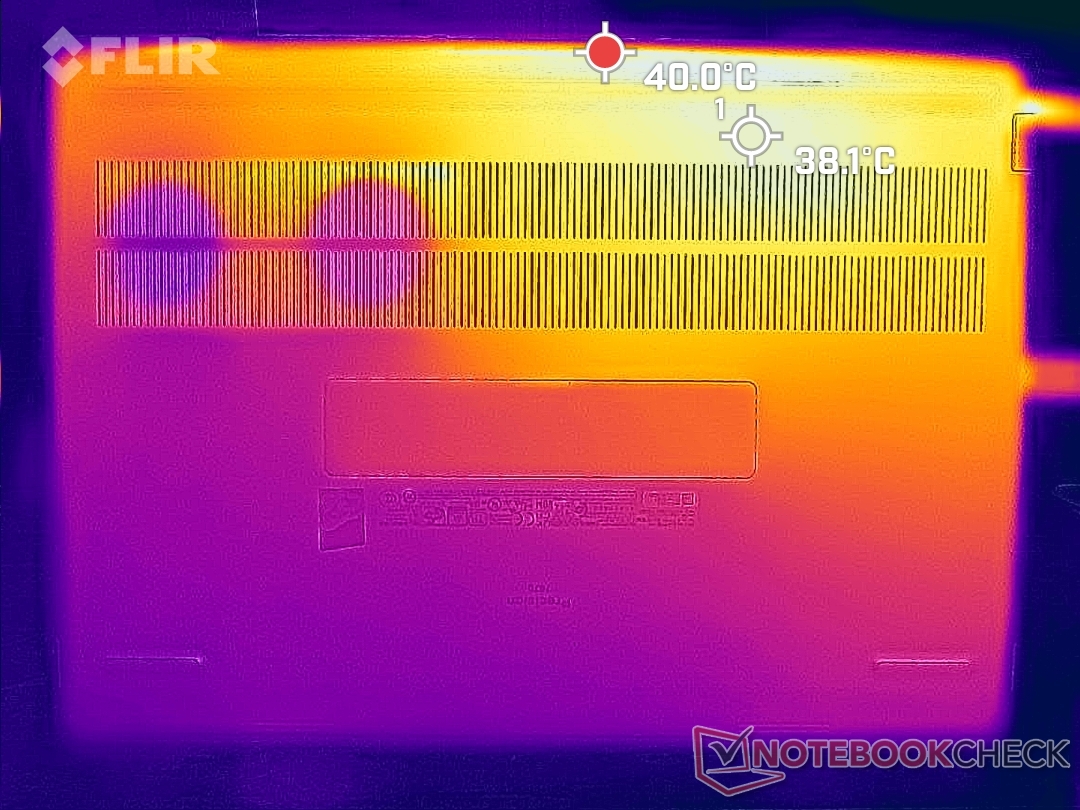
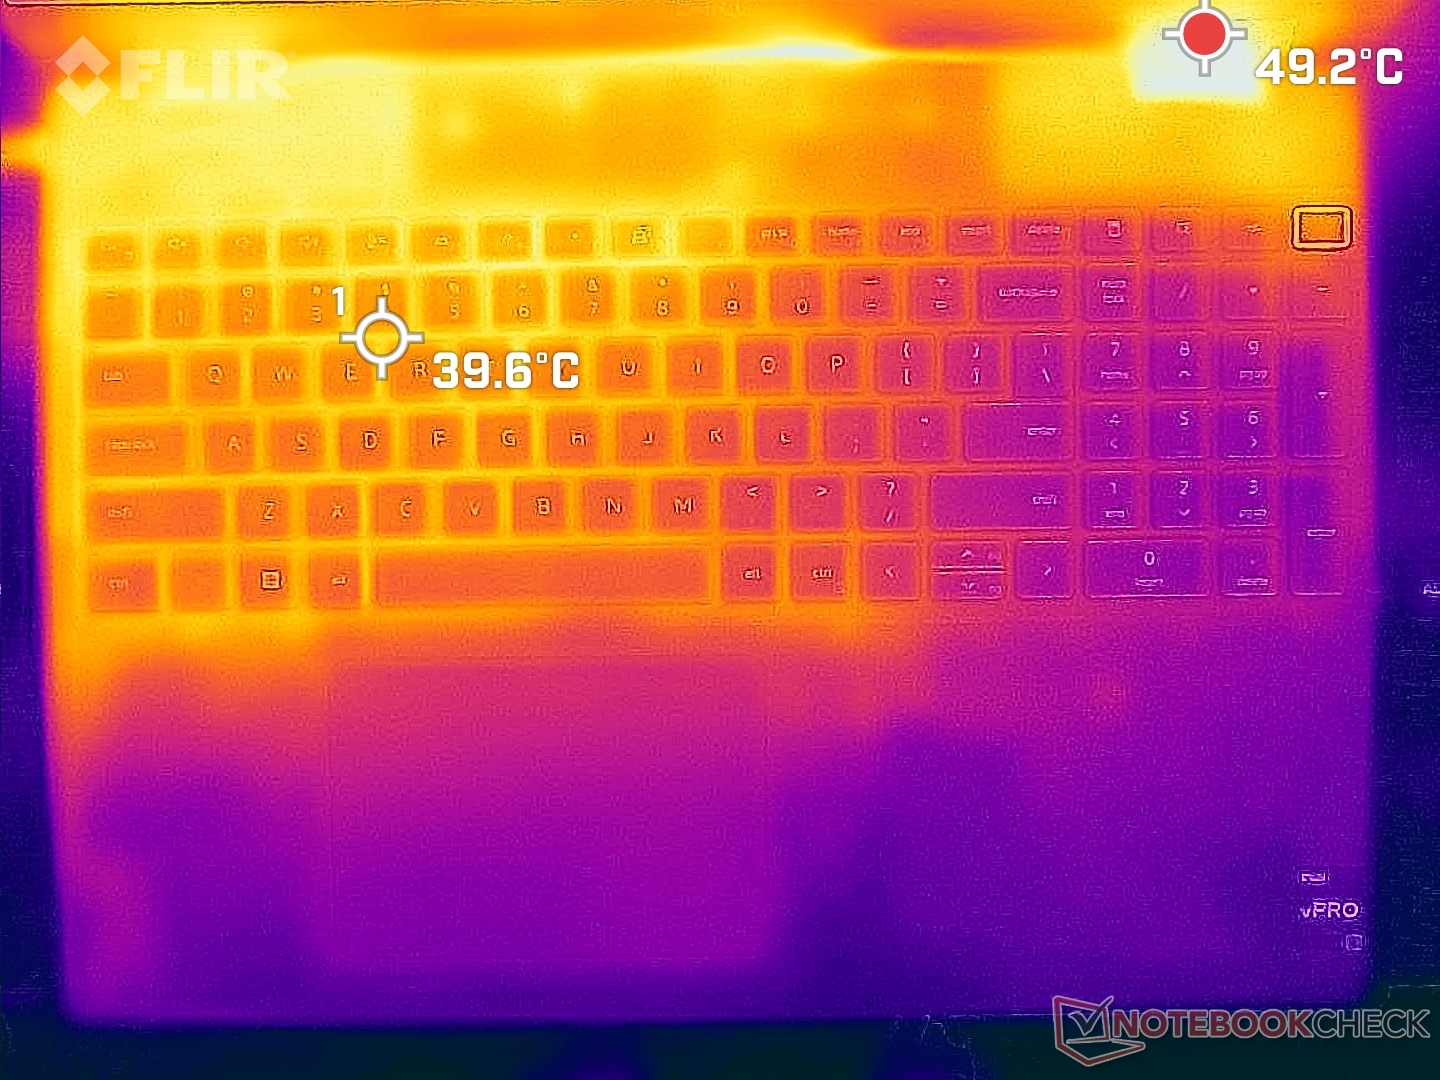
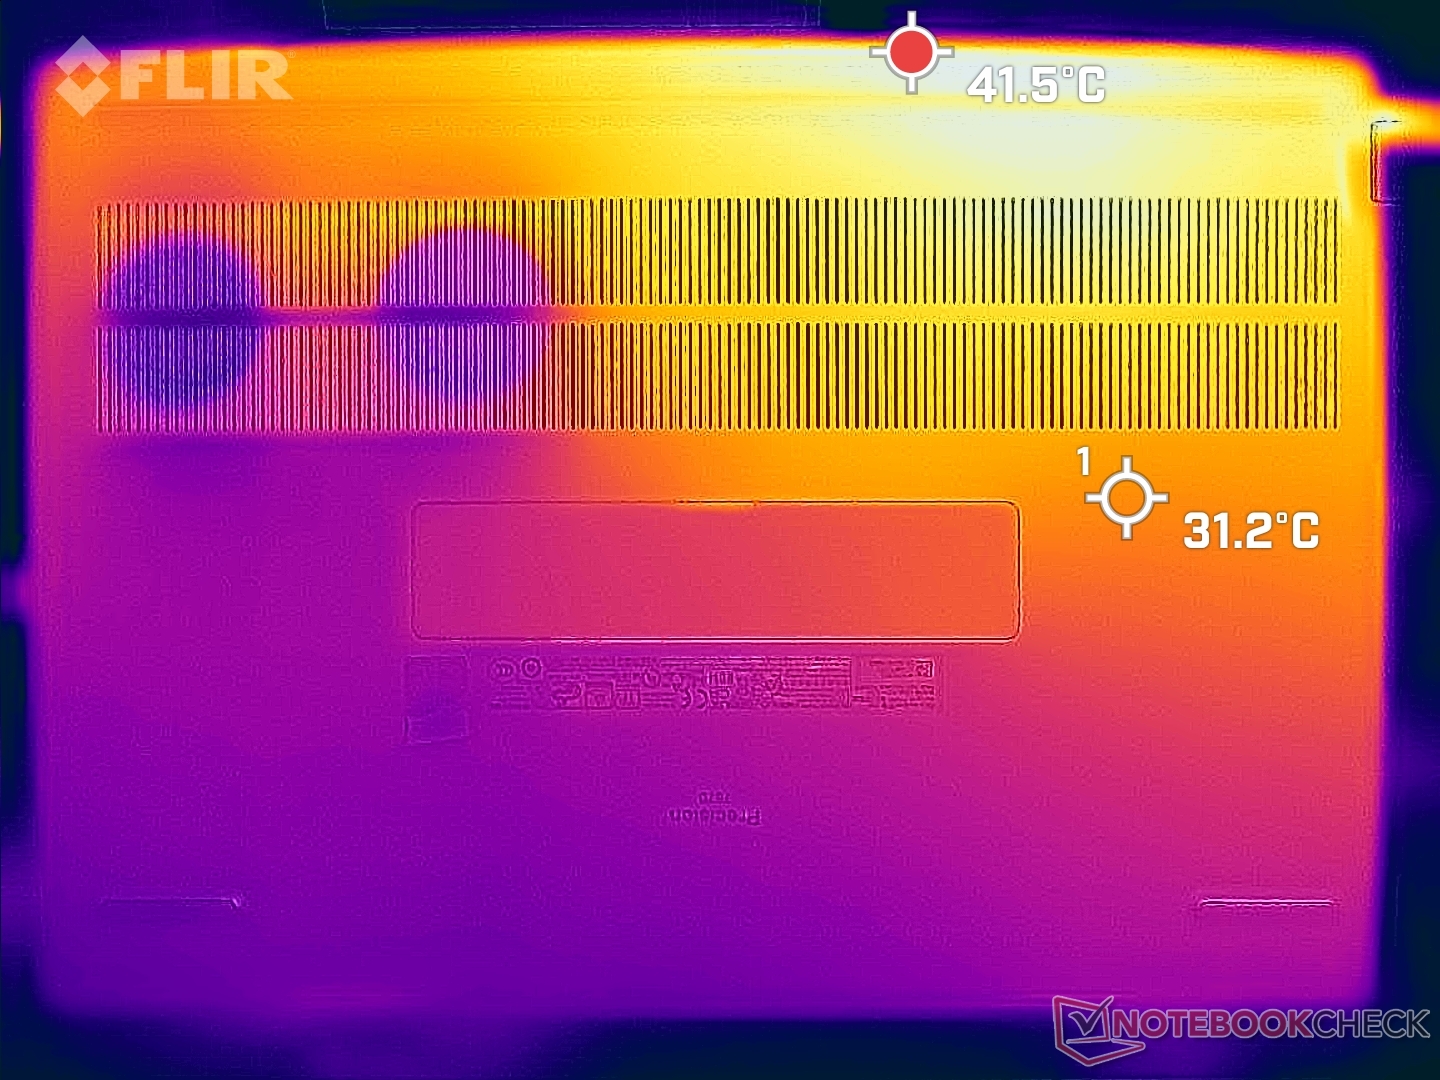
Temperatura
Le temperature di superficie sono effettivamente un po' più calde di quelle registrate sul normale Precision 7670. I punti caldi sulla tastiera e sul retro quando si eseguono carichi impegnativi come i giochi per periodi prolungati possono raggiungere circa 40 C ciascuno rispetto ai 35 C del modello normale più sottile. Questi risultati corrispondono alle misurazioni della temperatura del nucleo nella sezione successiva, dove la CPU e la GPU si stabilizzano a temperature più elevate.
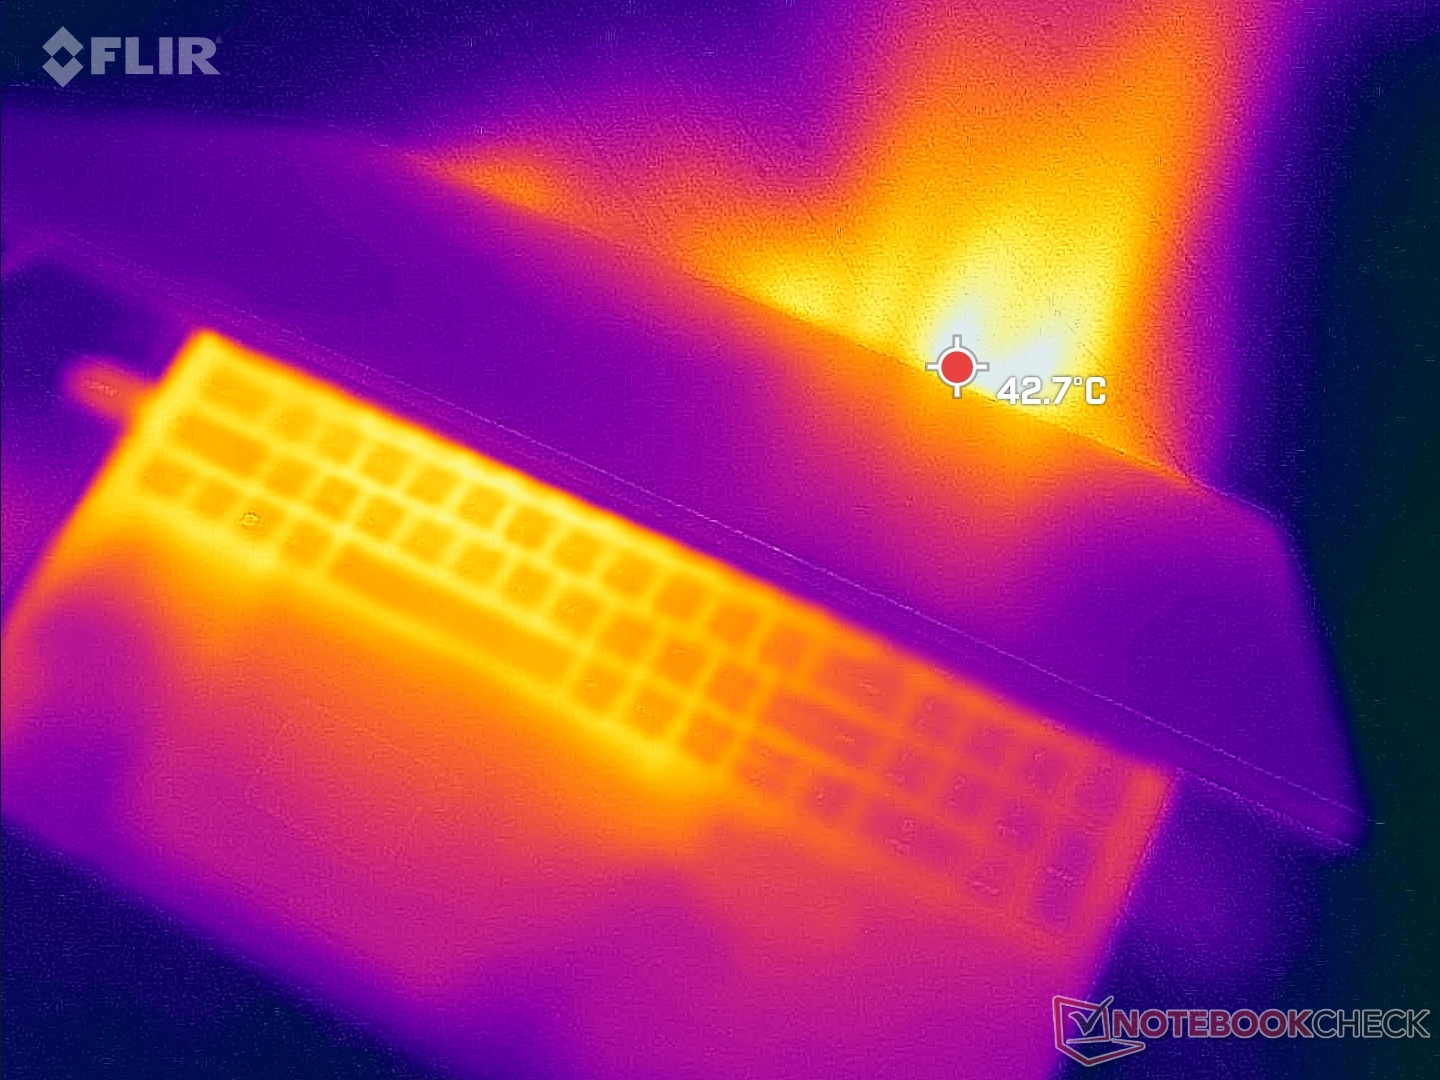
(-) La temperatura massima sul lato superiore è di 53 °C / 127 F, rispetto alla media di 38.1 °C / 101 F, che varia da 22.2 a 69.8 °C per questa classe Workstation.
(±) Il lato inferiore si riscalda fino ad un massimo di 43.2 °C / 110 F, rispetto alla media di 41.3 °C / 106 F
(+) In idle, la temperatura media del lato superiore è di 31.8 °C / 89 F, rispetto alla media deld ispositivo di 32 °C / 90 F.
(±) Riproducendo The Witcher 3, la temperatura media per il lato superiore e' di 37 °C / 99 F, rispetto alla media del dispositivo di 32 °C / 90 F.
(+) I poggiapolsi e il touchpad sono piu' freddi della temperatura della pelle con un massimo di 30.6 °C / 87.1 F e sono quindi freddi al tatto.
(-) La temperatura media della zona del palmo della mano di dispositivi simili e'stata di 27.8 °C / 82 F (-2.8 °C / -5.1 F).
| Dell Precision 7000 7670 Performance Intel Core i9-12950HX, NVIDIA RTX A5500 Laptop GPU | MSI CreatorPro Z16P B12UKST Intel Core i7-12700H, NVIDIA RTX A3000 Laptop GPU | HP ZBook Studio 16 G9 62U04EA Intel Core i7-12800H, NVIDIA RTX A2000 Laptop GPU | HP ZBook Firefly 16 G9-6B897EA Intel Core i7-1265U, NVIDIA T550 Laptop GPU | Lenovo ThinkPad P1 G4-20Y4Z9DVUS Intel Core i7-11800H, NVIDIA T1200 Laptop GPU | Dell Precision 7670 Intel Core i7-12850HX, NVIDIA RTX A2000 Laptop GPU | |
|---|---|---|---|---|---|---|
| Heat | -2% | 9% | 8% | 7% | 4% | |
| Maximum Upper Side * | 53 | 56.3 -6% | 38.7 27% | 42.1 21% | 49.9 6% | 51 4% |
| Maximum Bottom * | 43.2 | 68.3 -58% | 53.4 -24% | 48 -11% | 56.7 -31% | 45.8 -6% |
| Idle Upper Side * | 36.8 | 25.2 32% | 27.3 26% | 29.9 19% | 25.5 31% | 31.8 14% |
| Idle Bottom * | 33.8 | 25.9 23% | 31.6 7% | 32.9 3% | 26.2 22% | 32.6 4% |
* ... Meglio usare valori piccoli
Stress test
Quando si esegue Prime95 per stressare la CPU, le frequenze di clock e la temperatura balzano quasi istantaneamente a 3,4 GHz e 99 C, rispettivamente, con un elevato assorbimento di potenza del processore di 147 W. Una temperatura così elevata non è sostenibile e quindi le frequenze di clock e la temperatura scendono rapidamente a 2,3 GHz e 78 C, rispettivamente, con un assorbimento finale di potenza del processore di 76 W. Il calo costante e significativo del potenziale Turbo Boost corrisponde ai risultati del test CineBench R15 xT in cui i punteggi diminuiscono lentamente prima di stabilizzarsi nel tempo.
Le temperature della CPU e della GPU durante il funzionamento Witcher 3 si stabilizzerebbero rispettivamente a 77 C e 82 C, rispetto ai 70 C e 80 C del normale e più sottile Precision 7670.
Le prestazioni sono limitate se si utilizza l'alimentazione a batteria. Fire Strike a batteria restituisce punteggi di Fisica e Grafica rispettivamente di 18901 e 9254 punti, rispetto a 28197 e 26260 punti con l'alimentazione a rete.
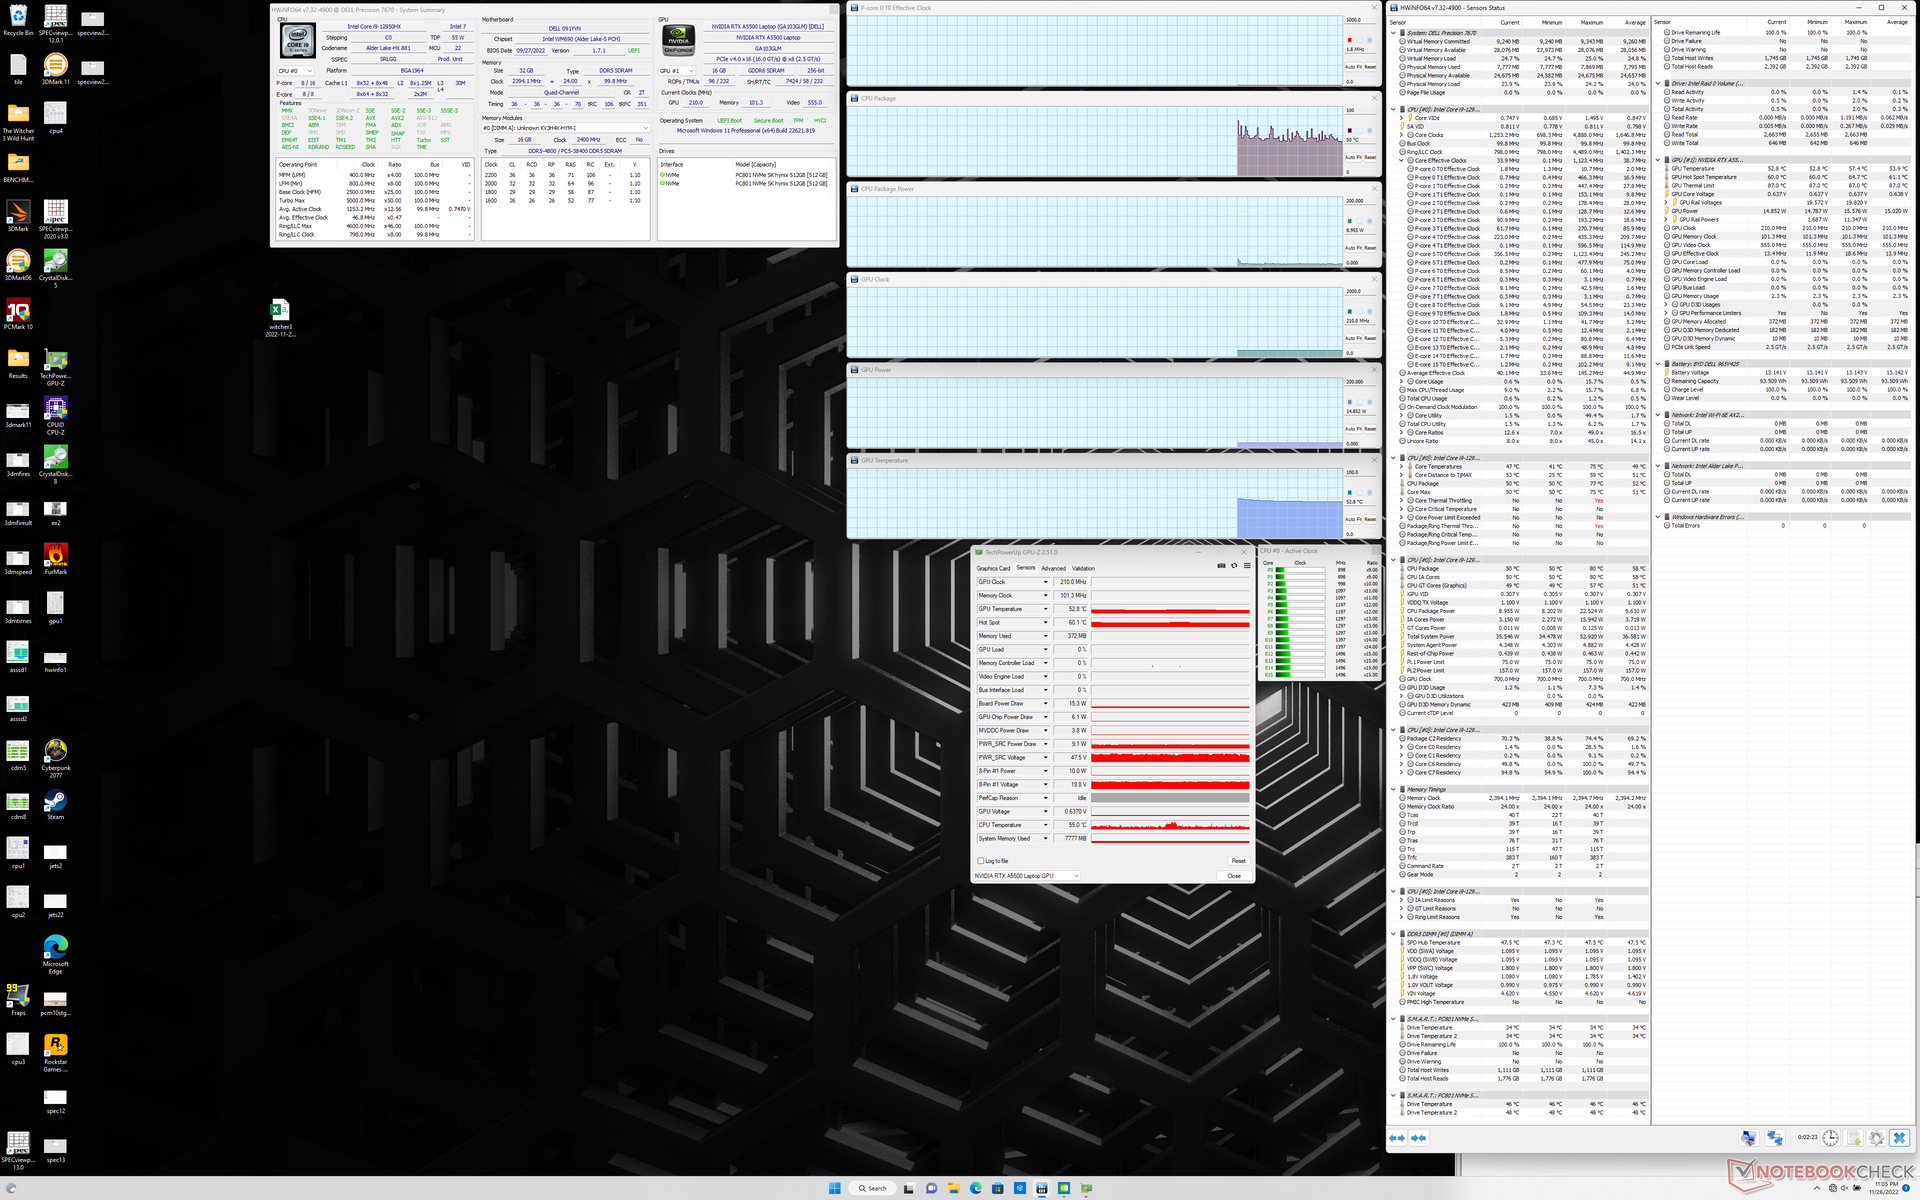
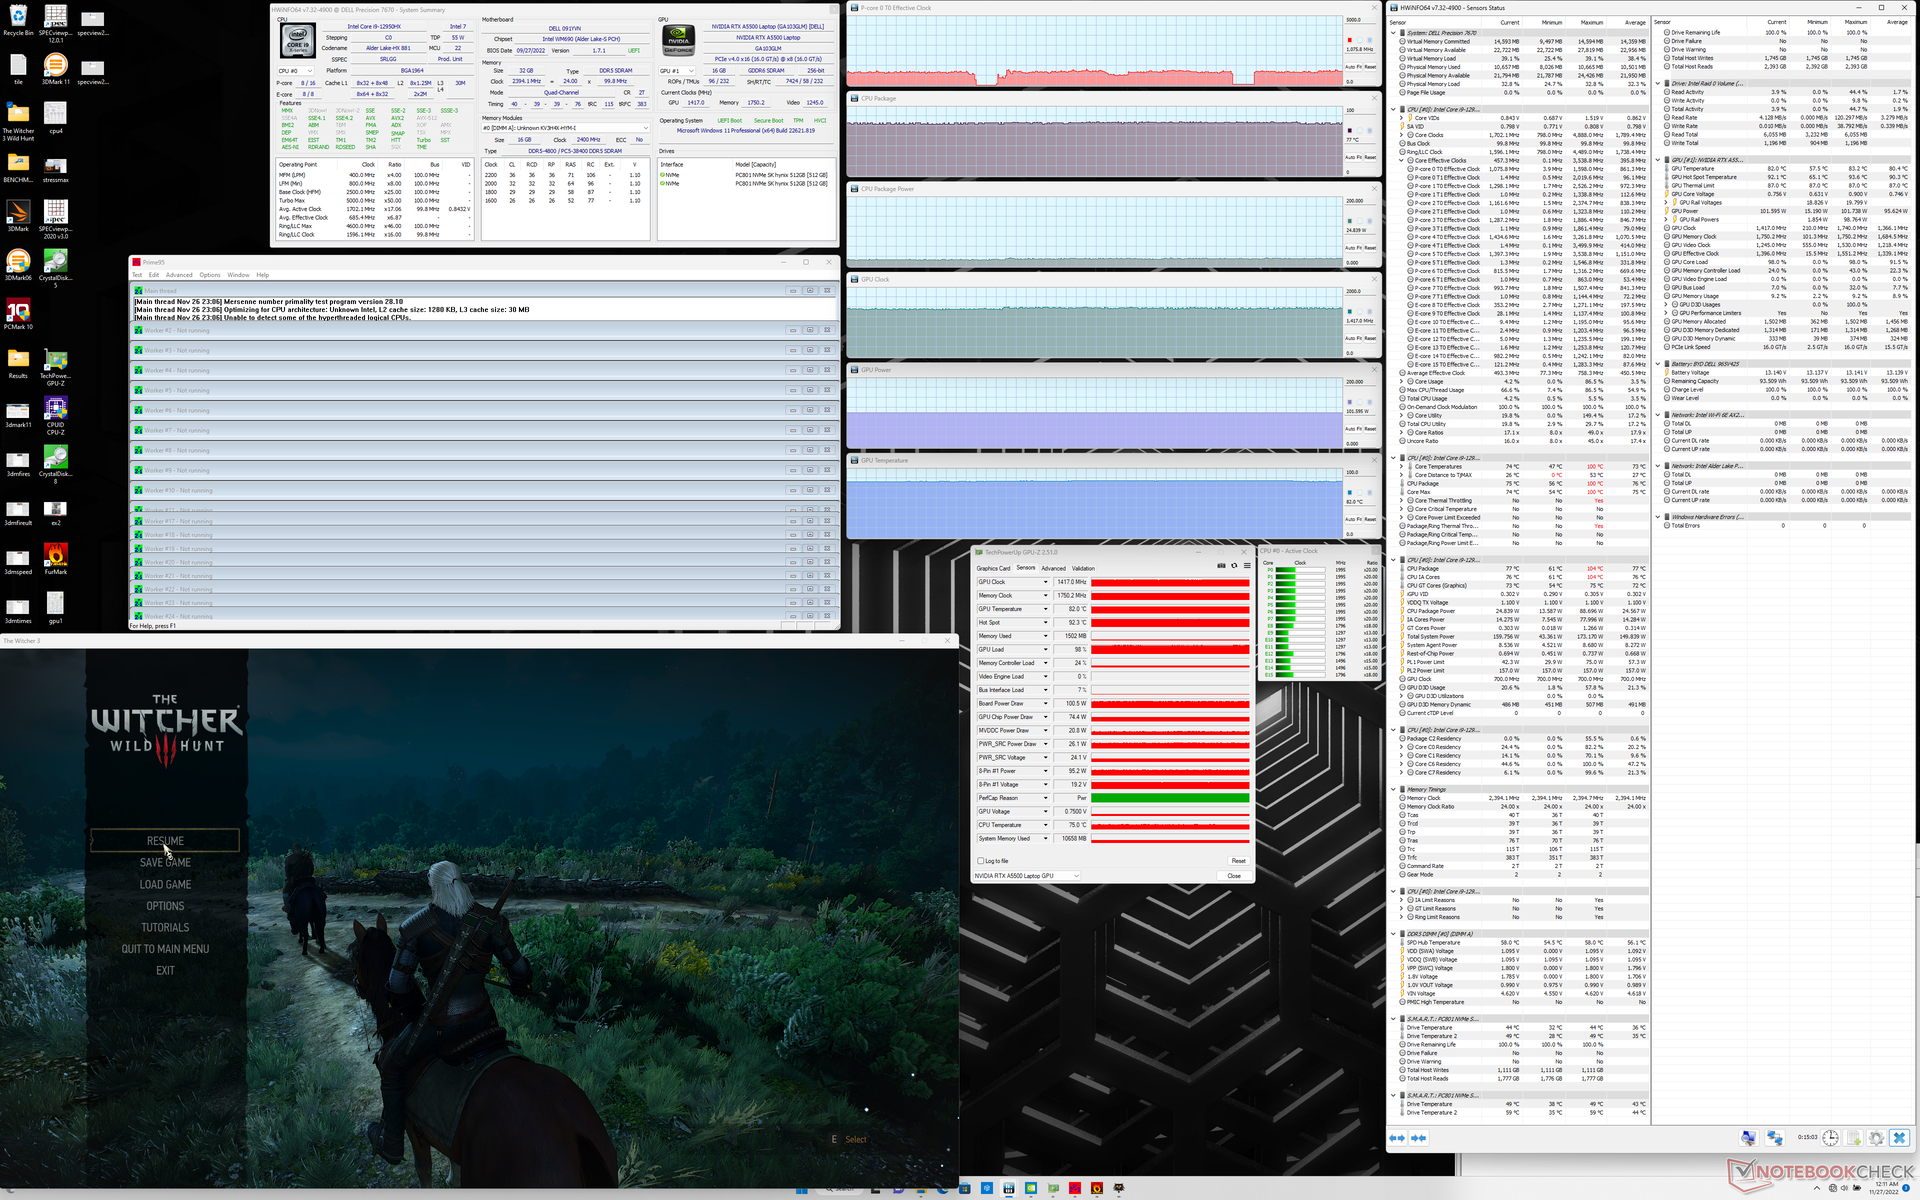
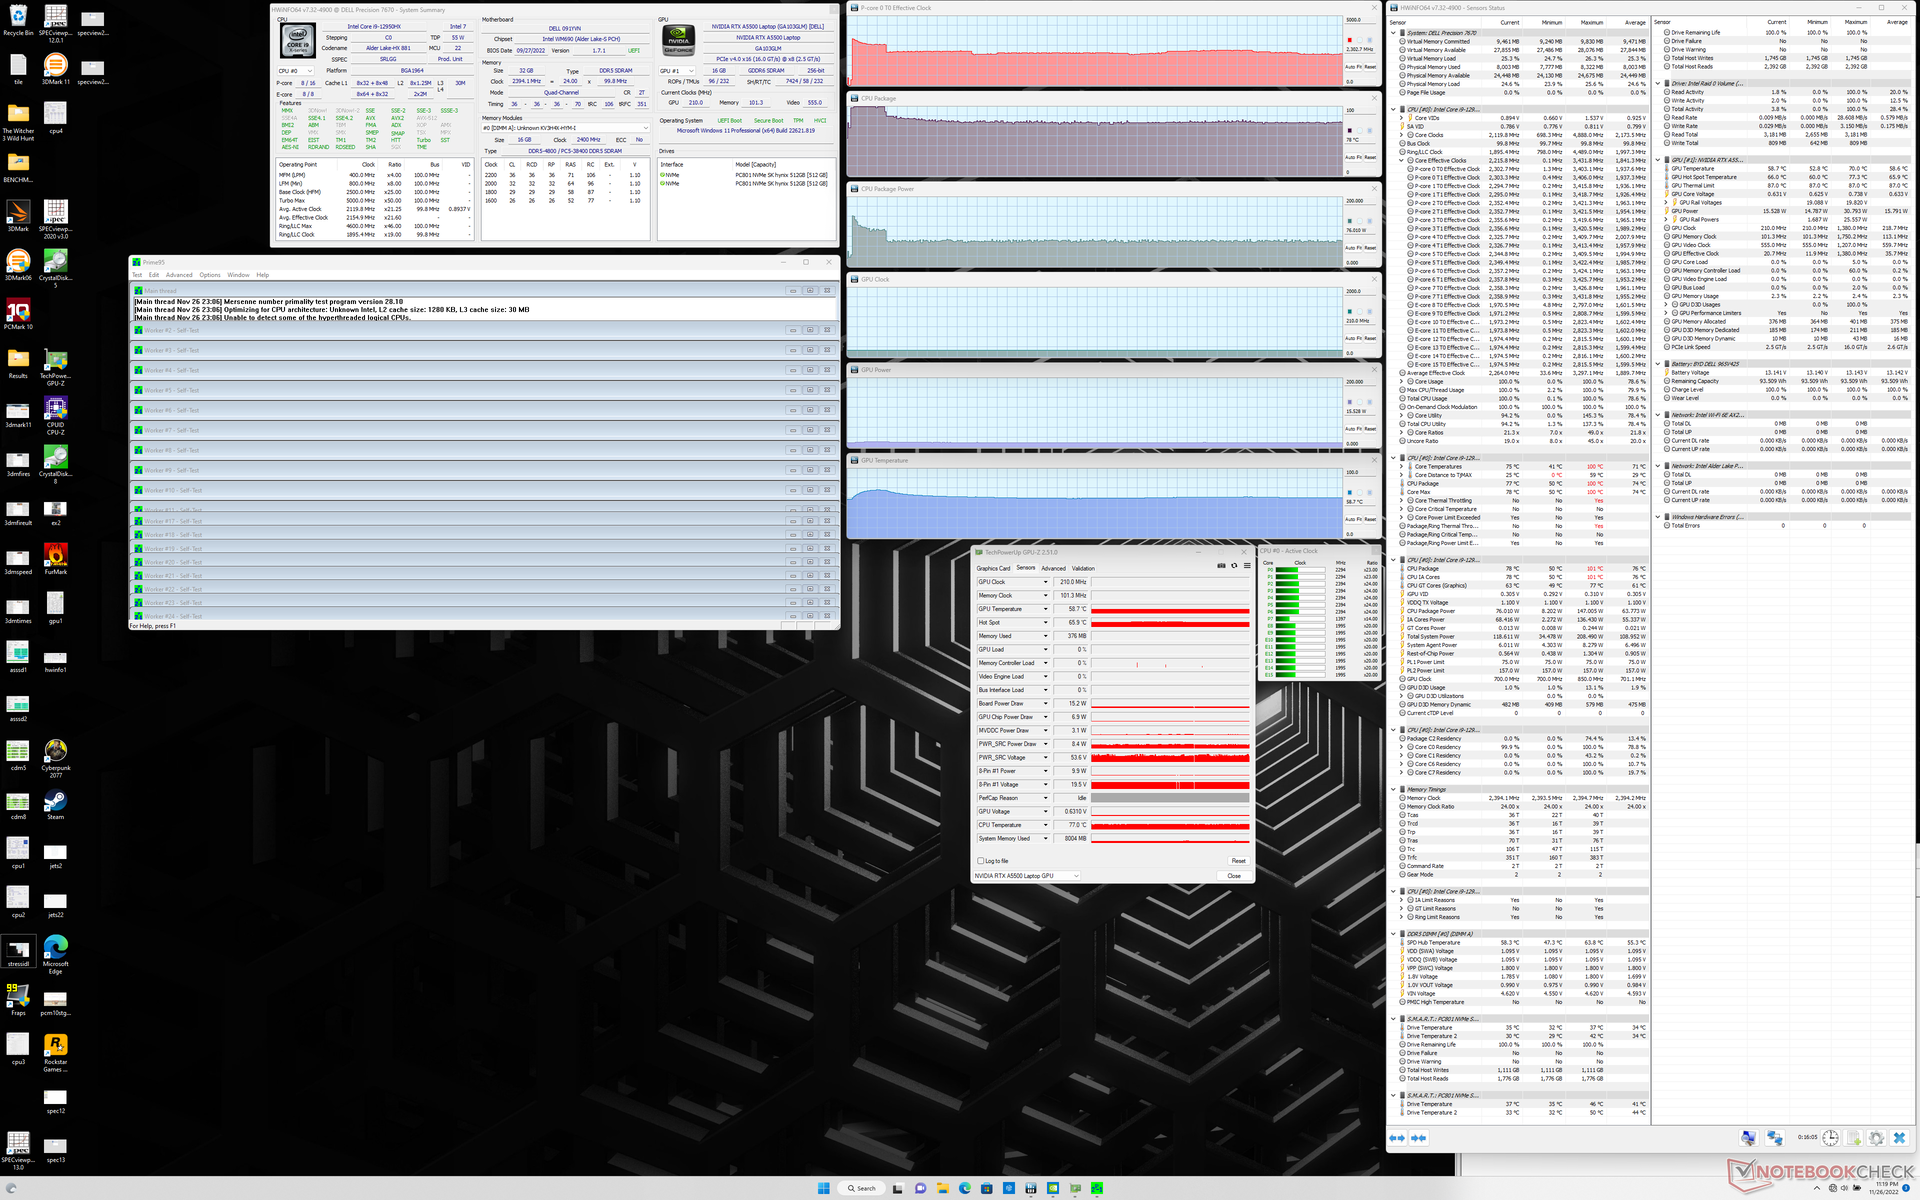
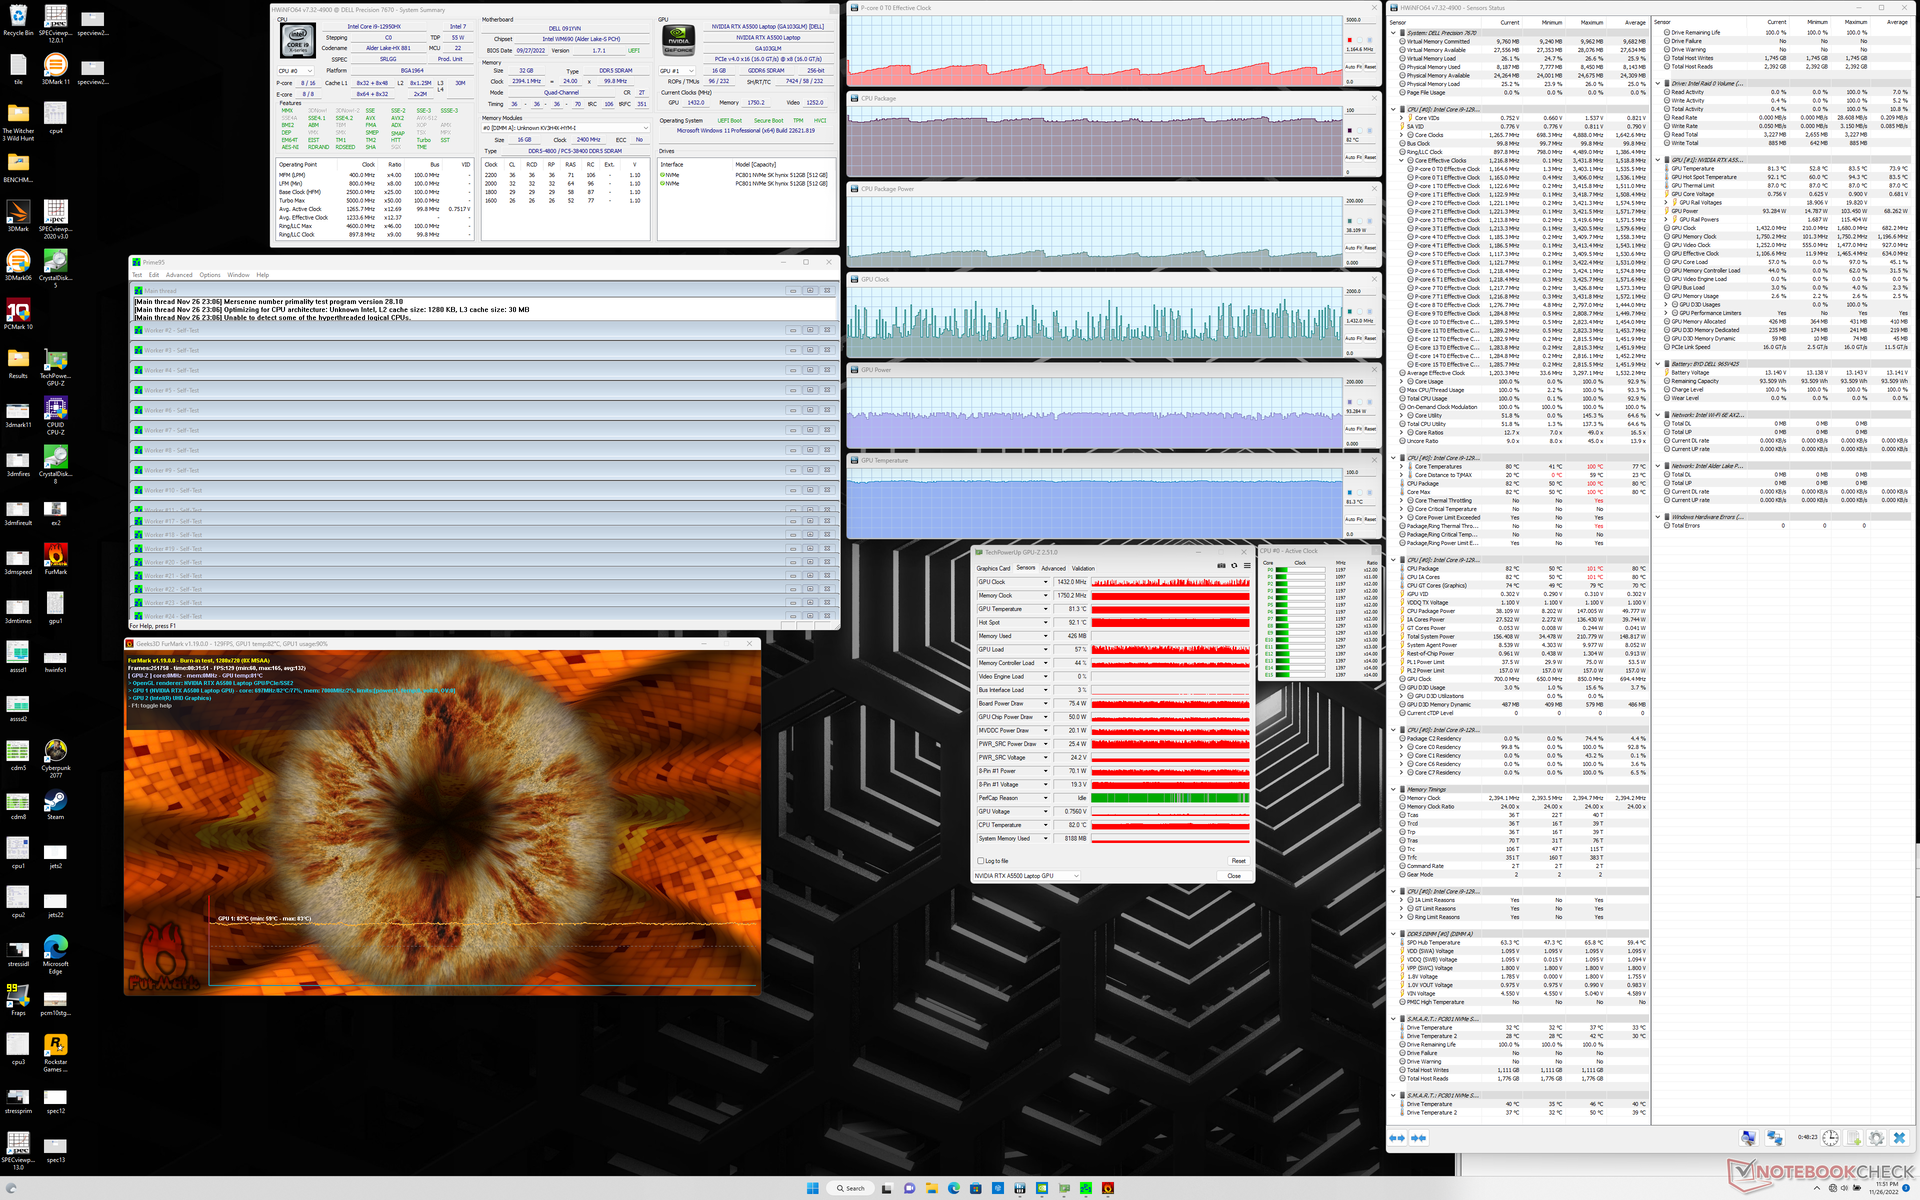
| Clock della CPU (GHz) | Clock della GPU (MHz) | Temperatura media della CPU (°C) | Temperatura media della GPU (°C) | |
| Sistema inattivo | -- | -- | 50 | 53 |
| Stress Prime95 | 2,3 | -- | 78 | 59 |
| Prime95 + FurMark Stress | 0,8 - 1,4 | 500 - 1555 | 79 - 83 | 81 |
| Witcher 3 Stress | 1,1 | 1417 | 77 | 82 |
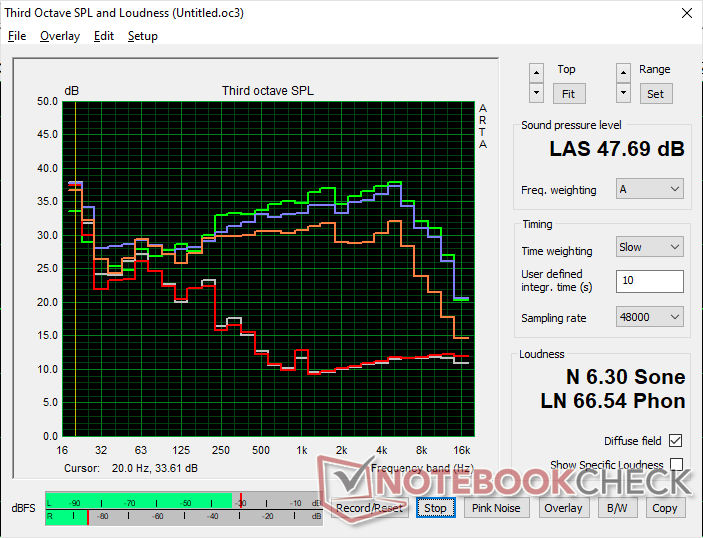
Altoparlanti
Controllare il suono degli altoparlanti integrati (suono, rumore, bassi, volume massimo,...) in diversi generi musicali/telefonici, confrontare la categoria del dispositivo, le caratteristiche speciali (software),... Come si possono collegare i dispositivi audio esterni? Testare le interfacce audio, se necessario. Analizzare il grafico del rumore rosa.
Breve recensione: Analisi altoparlante. circa 250 caratteri
Dell Precision 7000 7670 Performance analisi audio
(+) | gli altoparlanti sono relativamente potenti (91.1 dB)
Bassi 100 - 315 Hz
(-) | quasi nessun basso - in media 15.1% inferiori alla media
(±) | la linearità dei bassi è media (7.1% delta rispetto alla precedente frequenza)
Medi 400 - 2000 Hz
(+) | medi bilanciati - solo only 2.9% rispetto alla media
(+) | medi lineari (3.7% delta rispetto alla precedente frequenza)
Alti 2 - 16 kHz
(+) | Alti bilanciati - appena 3.5% dalla media
(+) | alti lineari (1.6% delta rispetto alla precedente frequenza)
Nel complesso 100 - 16.000 Hz
(+) | suono nel complesso lineare (10.4% differenza dalla media)
Rispetto alla stessa classe
» 4% di tutti i dispositivi testati in questa classe è stato migliore, 4% simile, 92% peggiore
» Il migliore ha avuto un delta di 7%, medio di 18%, peggiore di 35%
Rispetto a tutti i dispositivi testati
» 4% di tutti i dispositivi testati in questa classe è stato migliore, 1% similare, 95% peggiore
» Il migliore ha avuto un delta di 4%, medio di 25%, peggiore di 134%
Apple MacBook Pro 16 2021 M1 Pro analisi audio
(+) | gli altoparlanti sono relativamente potenti (84.7 dB)
Bassi 100 - 315 Hz
(+) | bassi buoni - solo 3.8% dalla media
(+) | bassi in lineaa (5.2% delta rispetto alla precedente frequenza)
Medi 400 - 2000 Hz
(+) | medi bilanciati - solo only 1.3% rispetto alla media
(+) | medi lineari (2.1% delta rispetto alla precedente frequenza)
Alti 2 - 16 kHz
(+) | Alti bilanciati - appena 1.9% dalla media
(+) | alti lineari (2.7% delta rispetto alla precedente frequenza)
Nel complesso 100 - 16.000 Hz
(+) | suono nel complesso lineare (4.6% differenza dalla media)
Rispetto alla stessa classe
» 0% di tutti i dispositivi testati in questa classe è stato migliore, 0% simile, 100% peggiore
» Il migliore ha avuto un delta di 5%, medio di 18%, peggiore di 45%
Rispetto a tutti i dispositivi testati
» 0% di tutti i dispositivi testati in questa classe è stato migliore, 0% similare, 100% peggiore
» Il migliore ha avuto un delta di 4%, medio di 25%, peggiore di 134%
Gestione dell'energia
Consumo di energia
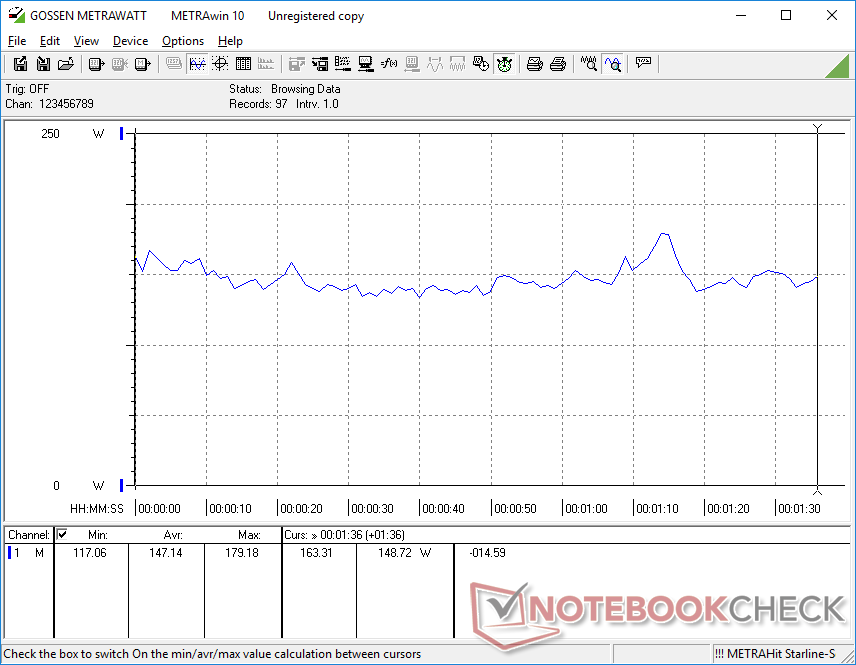
Il normale Precision 7670 è già una macchina avida di energia e il Precision 7670 Performance lo è ancora di più. Il semplice funzionamento al minimo sul desktop richiede tra i 16 e i 47 W, a seconda del livello di luminosità, del profilo energetico e dei colori OLED sullo schermo. La maggior parte delle altre workstation si aggira in genere nella fascia media dei 15 W
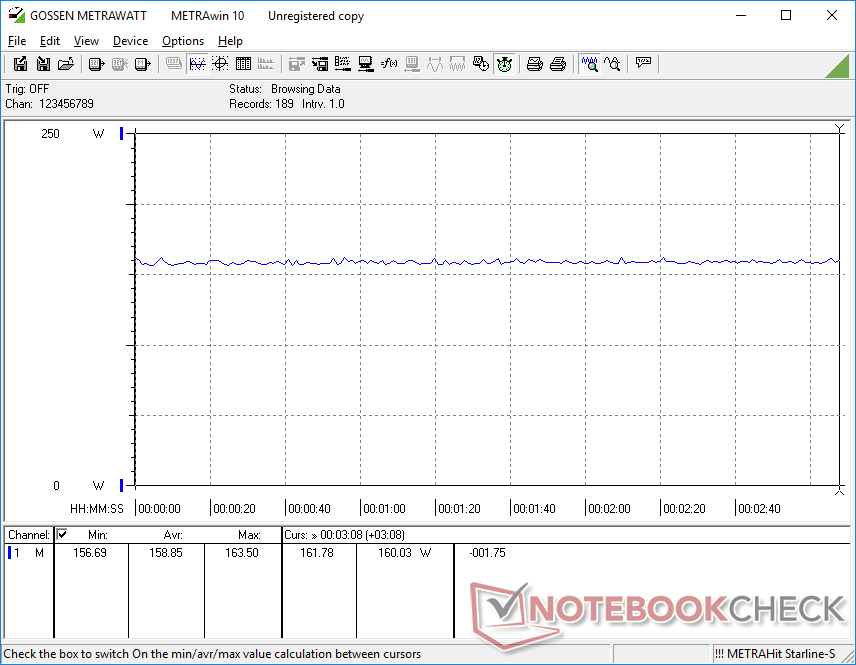
Quando si eseguono carichi impegnativi come i giochi, la nostra unità consuma circa 159 W rispetto ai 134 W del normale Precision 7670. L'aumento del 19 percento del consumo energetico è relativamente contenuto se si considera l'aumento del 70-80 percento del potenziale grafico rispetto alla Quadro A2000
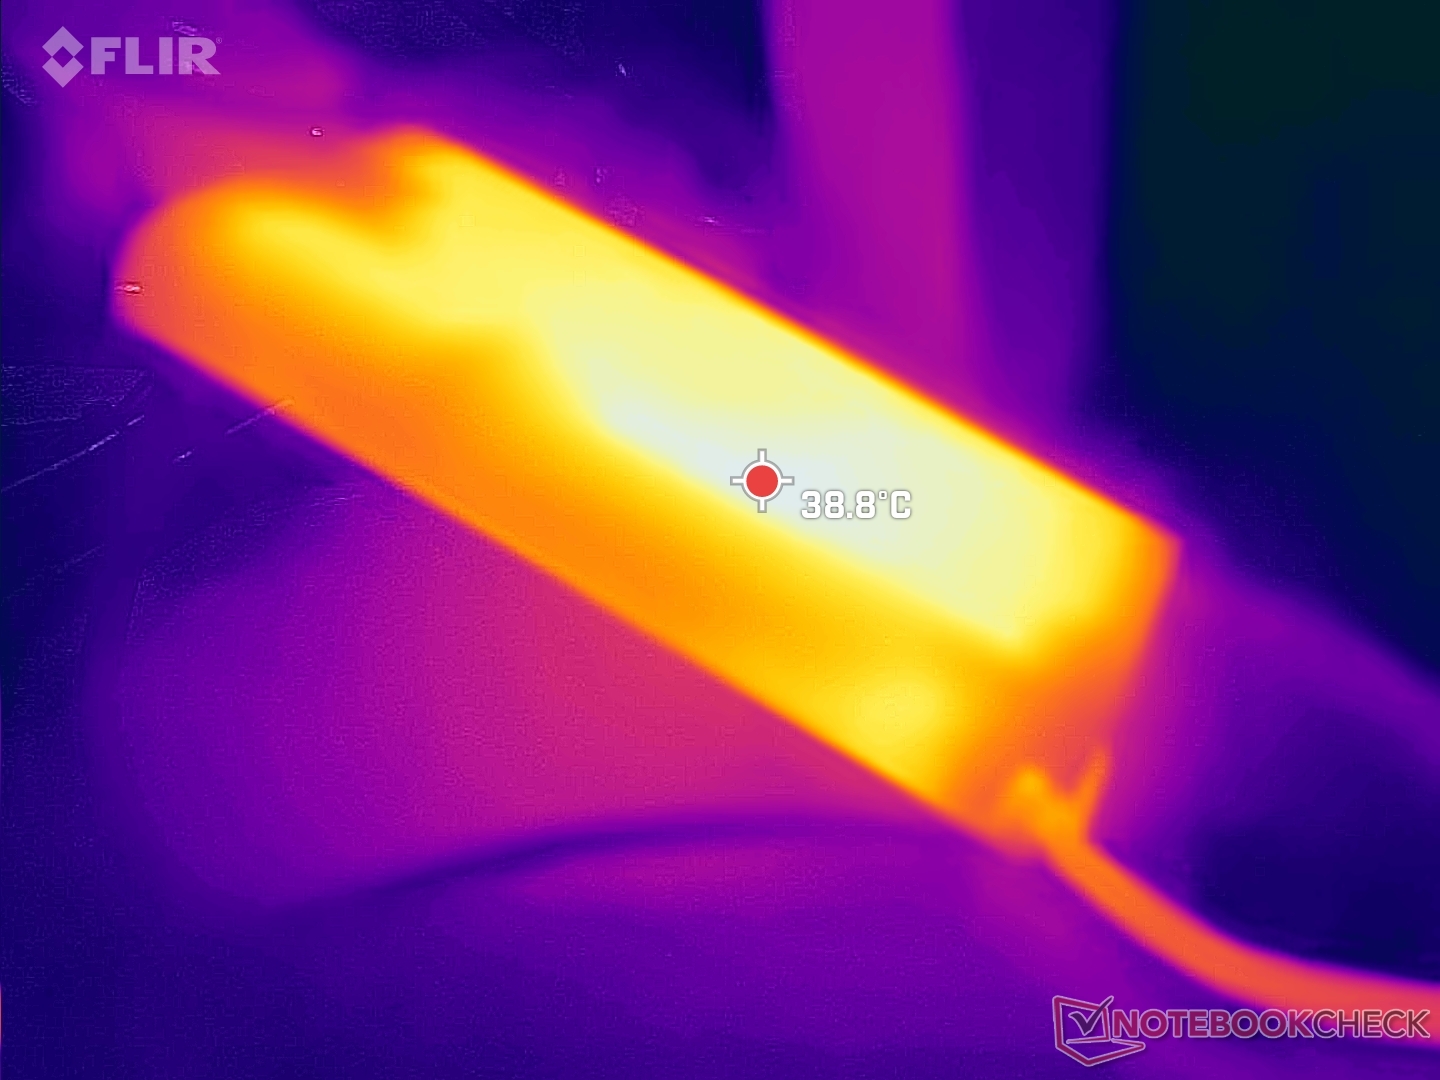
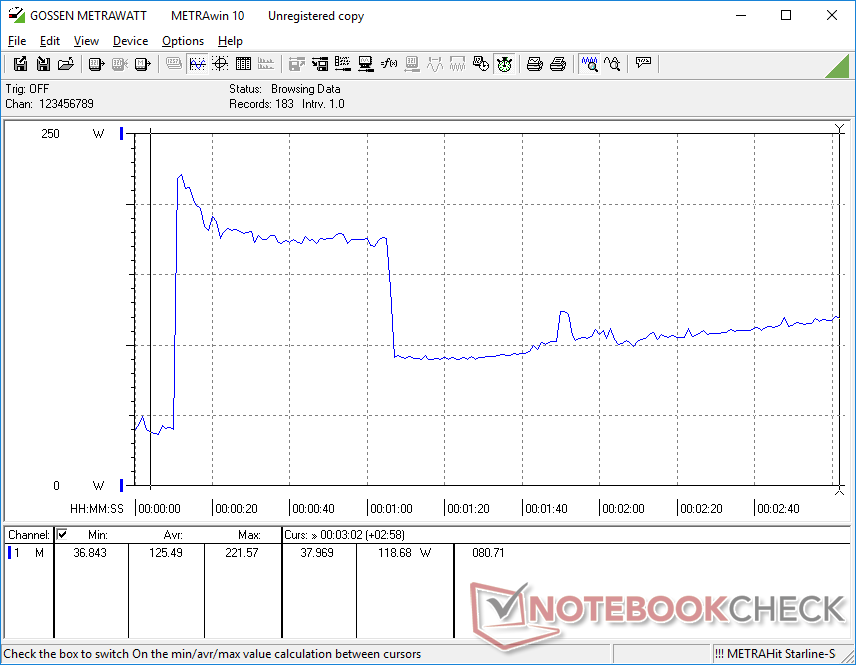
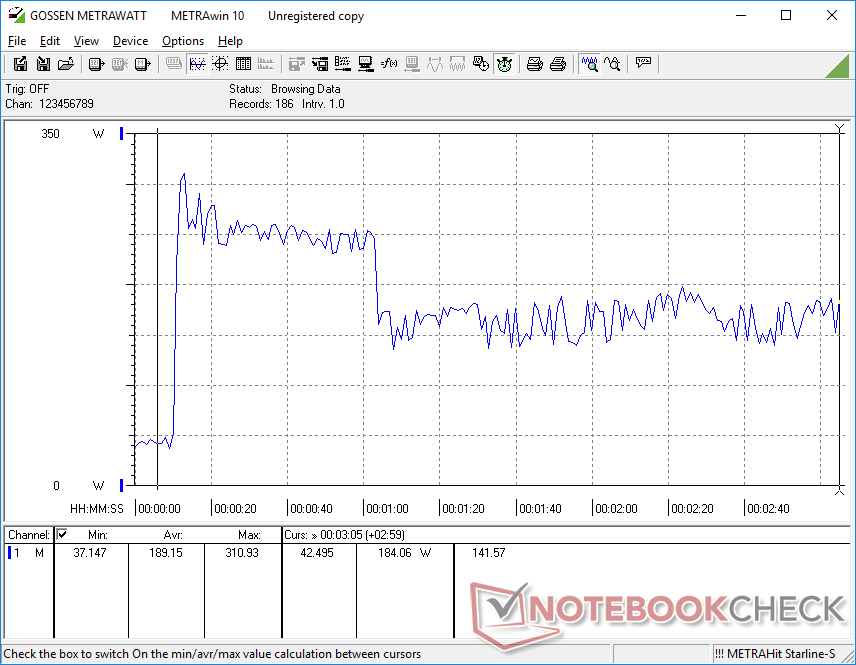
È incluso un adattatore AC di medie dimensioni (~15,2 x 7,8 x 2,3 cm) da 240 W, mentre il normale Precision 7670 viene fornito con un adattatore AC più piccolo da 180 W. Siamo riusciti a registrare un consumo massimo temporaneo di 311 W dall'adattatore quando sia la CPU che la GPU sono al 100% di utilizzo, come mostrano gli screenshot qui sotto. Questo suggerisce sia prestazioni Turbo Boost limitate che un adattatore potenzialmente sottopotenziato, visto quanto possono essere esigenti i componenti interni.
| Off / Standby | |
| Idle | |
| Sotto carico |
|
Leggenda:
min: Attualmente utilizziamo il Metrahit Energy, un multimetro digitale professionale per la misurazione della qualità della potenza e dell'energia monofase, per le nostre misurazioni. | |
| Dell Precision 7000 7670 Performance i9-12950HX, RTX A5500 Laptop GPU, , OLED, 3840x2400, 16.00 | MSI CreatorPro Z16P B12UKST i7-12700H, RTX A3000 Laptop GPU, Samsung PM9A1 MZVL21T0HCLR, IPS, 2560x1600, 16.00 | HP ZBook Studio 16 G9 62U04EA i7-12800H, RTX A2000 Laptop GPU, Micron 3400 1TB MTFDKBA1T0TFH, IPS, 3840x2400, 16.00 | HP ZBook Firefly 16 G9-6B897EA i7-1265U, T550 Laptop GPU, Samsung PM9A1 MZVL21T0HCLR, IPS, 1920x1200, 16.00 | Lenovo ThinkPad P1 G4-20Y4Z9DVUS i7-11800H, T1200 Laptop GPU, Samsung PM9A1 MZVL2512HCJQ, IPS, 2560x1600, 16.00 | Dell Precision 7670 i7-12850HX, RTX A2000 Laptop GPU, SK Hynix HFS001TEJ9X115N, OLED, 3840x2400, 16.00 | MSI WE76 11UM-456 i9-11980HK, RTX A5000 Laptop GPU, Samsung PM9A1 MZVL22T0HBLB, IPS, 3840x2160, 17.30 | |
|---|---|---|---|---|---|---|---|
| Power Consumption | 37% | 44% | 73% | 48% | 36% | 19% | |
| Idle Minimum * | 16.4 | 10.8 34% | 7.2 56% | 4.5 73% | 9.9 40% | 7.5 54% | 10.5 36% |
| Idle Average * | 35.9 | 16.3 55% | 18.1 50% | 8 78% | 13.9 61% | 9.5 74% | 18.6 48% |
| Idle Maximum * | 47 | 16.9 64% | 18.5 61% | 8.7 81% | 14.6 69% | 28.4 40% | 20 57% |
| Load Average * | 147.1 | 111.7 24% | 112.8 23% | 48.3 67% | 95 35% | 139.1 5% | 132.4 10% |
| Witcher 3 ultra * | 158.8 | 152.1 4% | 106.7 33% | 45.3 71% | 98.9 38% | 134 16% | 232 -46% |
| Load Maximum * | 311 | 177.4 43% | 186 40% | 94.7 70% | 170.8 45% | 220.8 29% | 281.6 9% |
* ... Meglio usare valori piccoli
Power Consumption Witcher 3 / Stresstest
Power Consumption external Monitor
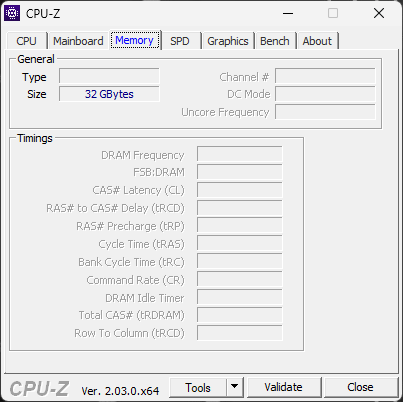
Durata della batteria
La capacità della batteria è leggermente superiore: 93 Wh rispetto agli 83 Wh del più sottile Precision 7670. Ciononostante, l'autonomia WLAN è più breve di quasi un'ora sul nostro modello Performance a causa della maggiore potenza interna.
La ricarica da vuoto a pieno regime rimane lenta, con circa 2,5 ore.
| Dell Precision 7000 7670 Performance i9-12950HX, RTX A5500 Laptop GPU, 93 Wh | MSI CreatorPro Z16P B12UKST i7-12700H, RTX A3000 Laptop GPU, 90 Wh | HP ZBook Studio 16 G9 62U04EA i7-12800H, RTX A2000 Laptop GPU, 86 Wh | HP ZBook Firefly 16 G9-6B897EA i7-1265U, T550 Laptop GPU, 76 Wh | Lenovo ThinkPad P1 G4-20Y4Z9DVUS i7-11800H, T1200 Laptop GPU, 90 Wh | Dell Precision 7670 i7-12850HX, RTX A2000 Laptop GPU, 83 Wh | |
|---|---|---|---|---|---|---|
| Autonomia della batteria | 24% | 35% | 178% | 89% | 27% | |
| WiFi v1.3 | 280 | 348 24% | 377 35% | 779 178% | 529 89% | 355 27% |
| H.264 | 509 | 1104 | ||||
| Load | 63 | 118 | 75 | |||
| Reader / Idle | 472 |
Pro
Contro
Il verdetto
Il modello Precision 7670 Performance è solo leggermente più spesso e pesante rispetto al modello Precision 7670 standardma offre prestazioni della CPU e della GPU superiori rispettivamente del 10% e dell'80% rispetto al modello standard se configurato con le opzioni di processore più elevate. Se non si intende sfruttare i vantaggi della GPU in particolare, non c'è motivo di possedere il modello Performance rispetto al modello standard, poiché gli altri vantaggi sono relativamente minori.
Precision 7670 Performance offre opzioni e caratteristiche da processore di fascia alta. Tuttavia, le limitate potenzialità del Turbo Boost, le elevate temperature dei core e i problemi di latenza DPC sono piuttosto deludenti.
C'è un ampio margine di miglioramento per quanto riguarda le prestazioni complessive. Nonostante sia il modello Performance più spesso, le temperature del core non sono migliori di quelle del modello standard. Di conseguenza, il Turbo Boost della CPU dura molto meno del previsto, cosa che il pubblico di appassionati potrebbe non apprezzare. Le elevate latenze DPC, le prestazioni WiFi non uniformi, l'elevato consumo di energia al minimo e l'adattatore CA sottodimensionato sono altri problemi che non dovrebbero assolutamente verificarsi su una workstation professionale come questa.
Prezzo e disponibilità
Dell distribuisce ora Precision 7670 Performance a partire da 5300 dollari per la configurazione base fino a oltre 7000 dollari se configurato con la stessa CPU e GPU della nostra unità di test.
Dell Precision 7000 7670 Performance
-
12/03/2022 v7
Allen Ngo
Pricecompare

