 Deutsch
 English
 Español
 Français
 Italiano
 Nederlands
 Polski
 Português
 Русский
 Türkçe
 Svenska
 Chinese
 Magyar
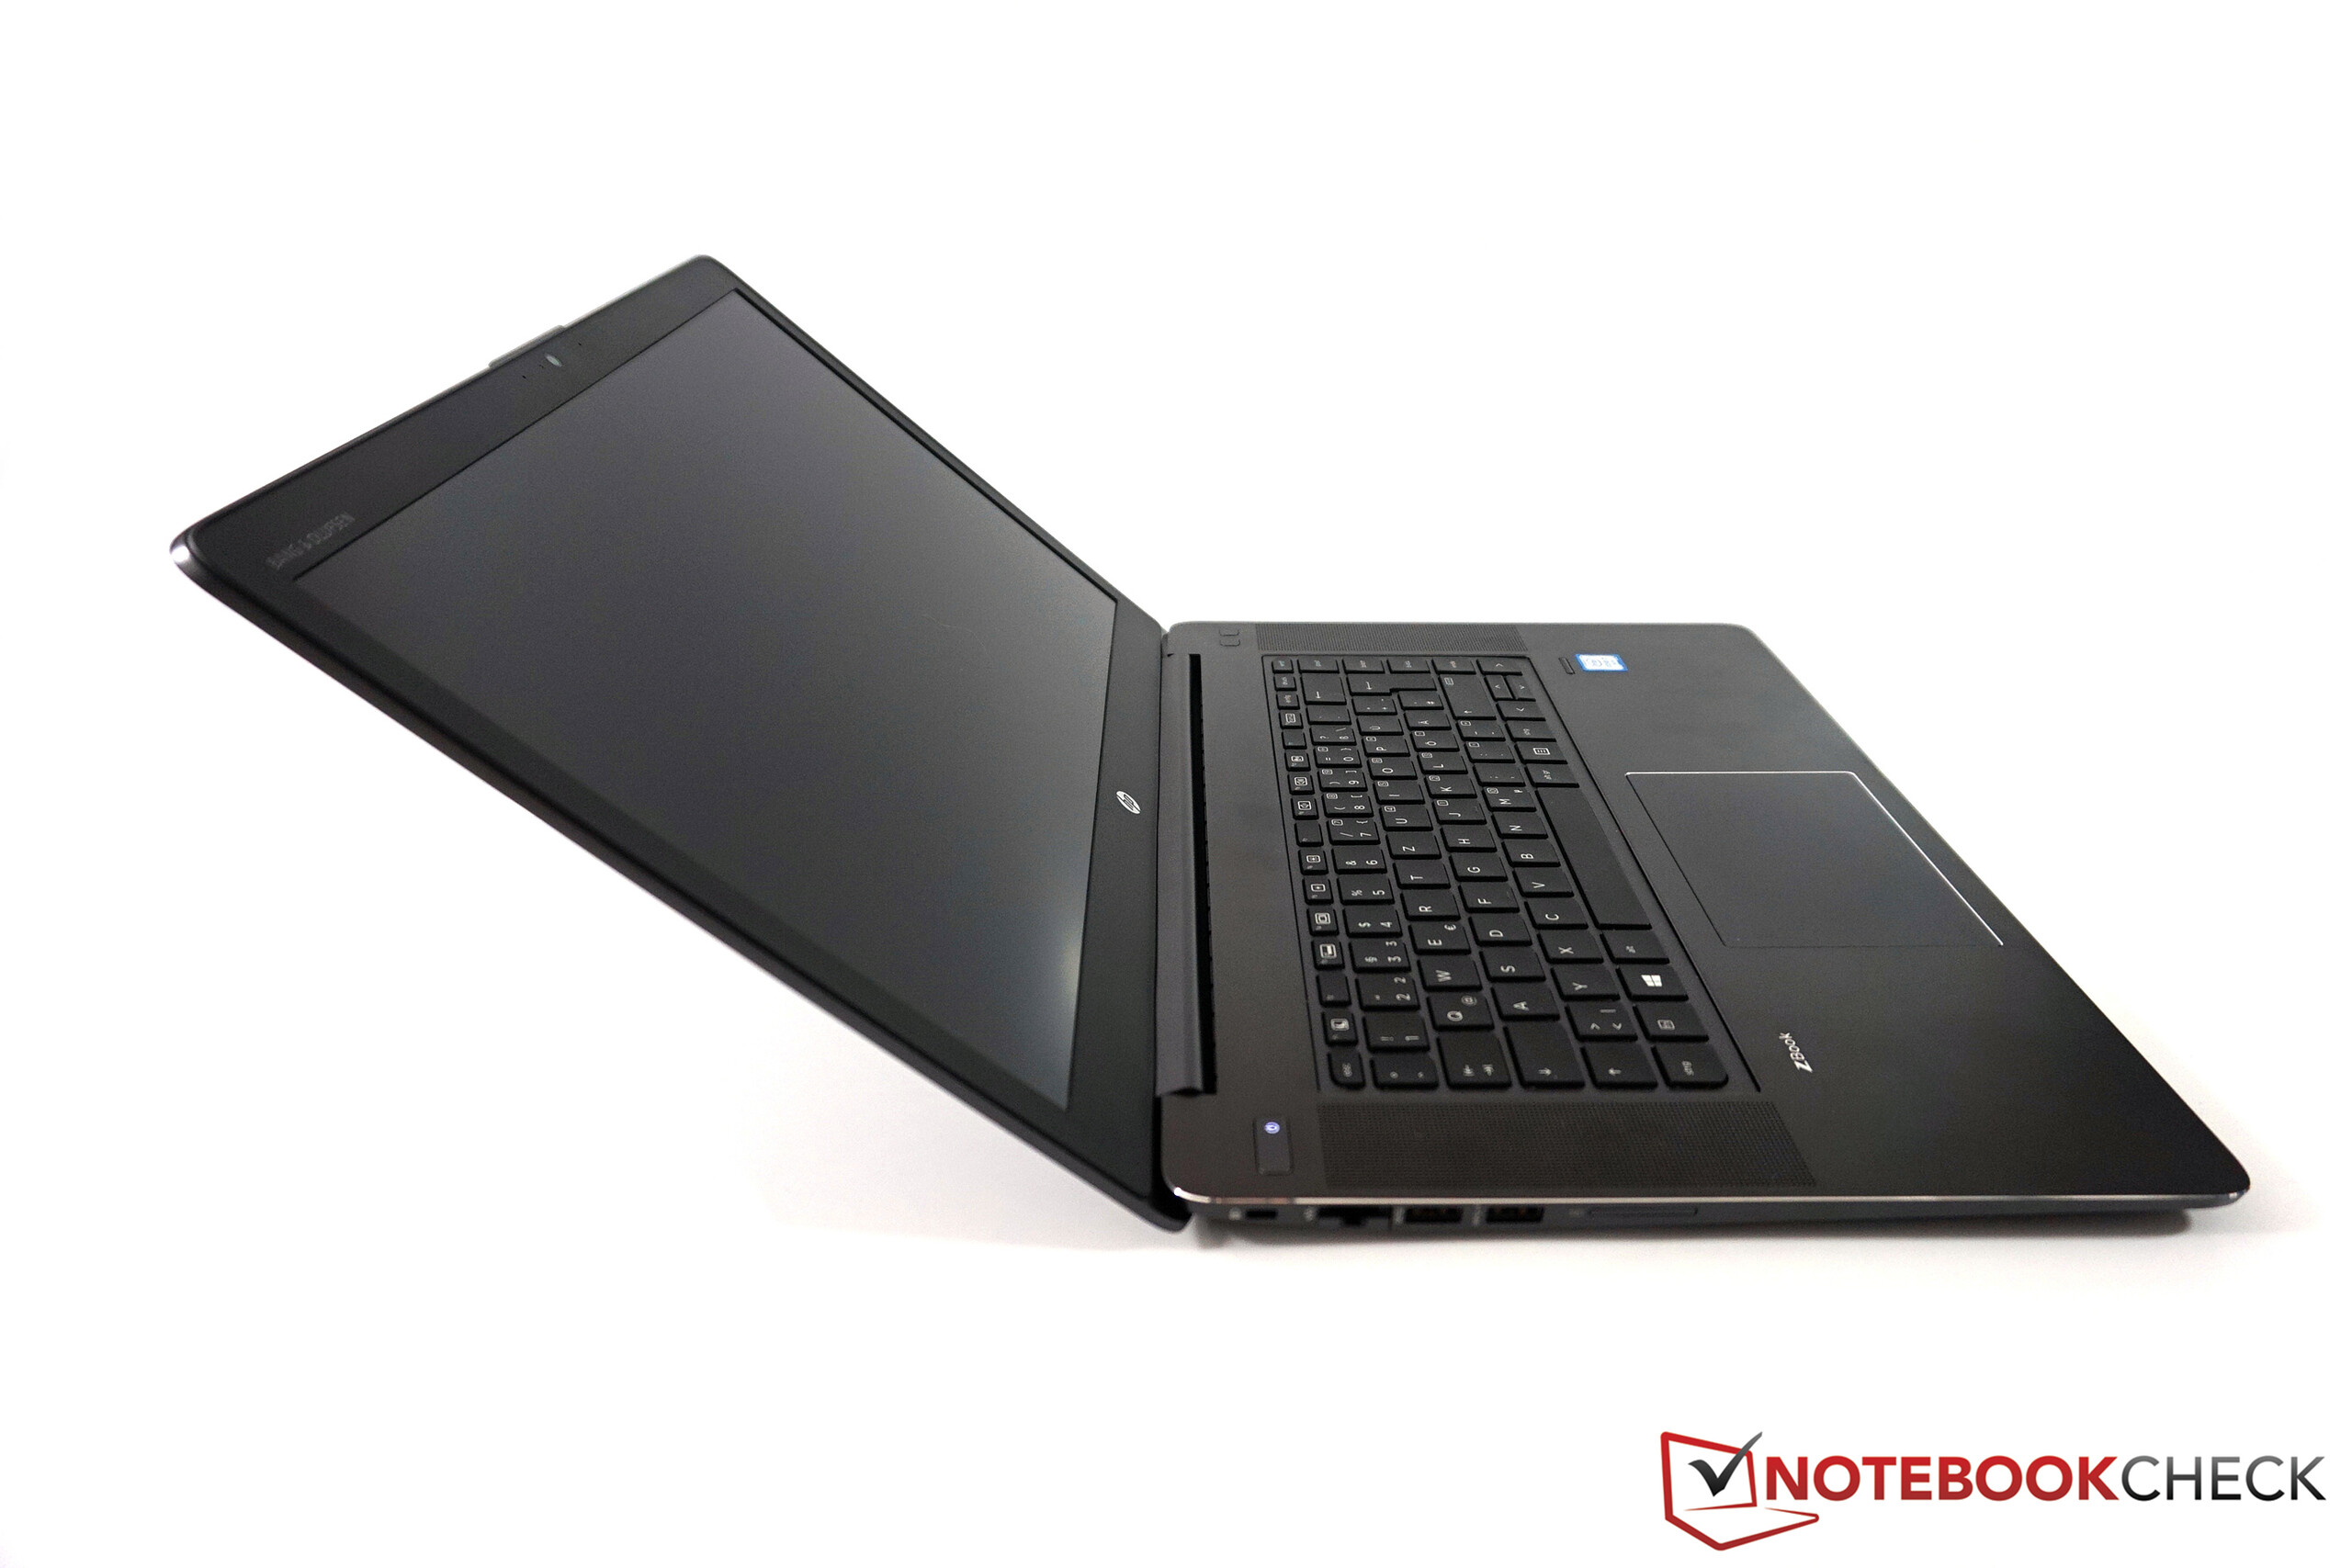
Recensione breve della Workstation HP ZBook Studio G3
| |||||||||||||||||||||||||
Distribuzione della luminosità: 86 %
Al centro con la batteria: 307 cd/m²
Contrasto: 1069:1 (Nero: 0.29 cd/m²)
ΔE Color 5.9 | 0.5-29.43 Ø5
ΔE Greyscale 5.5 | 0.57-98 Ø5.3
99.9% sRGB (Calman 2D)
99% sRGB (Argyll 1.6.3 3D)
85% AdobeRGB 1998 (Argyll 1.6.3 3D)
98% AdobeRGB 1998 (Argyll 2.2.0 3D)
98.9% sRGB (Argyll 2.2.0 3D)
86% Display P3 (Argyll 2.2.0 3D)
Gamma: 2.09
| HP ZBook Studio G3 15.60, 3840x2160, IPS | Dell Precision 5510 15.60, 3840x2160, IGZO LED | MSI WS60-6QJE316H11 15.60, 3840x2160, IPS | Lenovo ThinkPad P50 15.60, 1920x1080, IPS | Lenovo ThinkPad P50s-20FKS00400 15.50, 2880x1620, IPS | HP ZBook 15 G3 15.60, 1920x1080, UWVA-IPS | HP ZBook 15u G3 15.60, 1920x1080, TN LED | Apple MacBook Pro Retina 15 inch 2015-05 15.40, 2880x1800, IPS-Panel | |
|---|---|---|---|---|---|---|---|---|
| Display | 2% | -31% | -51% | -24% | -18% | -34% | -24% | |
| Display P3 Coverage | 86 | 88.4 3% | 55.1 -36% | 39.13 -54% | 63.7 -26% | 66.8 -22% | 53.2 -38% | 61.4 -29% |
| sRGB Coverage | 98.9 | 100 1% | 83 -16% | 58.5 -41% | 87.6 -11% | 95.5 -3% | 80.1 -19% | 90.8 -8% |
| AdobeRGB 1998 Coverage | 98 | 99.5 2% | 56.9 -42% | 40.45 -59% | 63.8 -35% | 69 -30% | 54.9 -44% | 62.9 -36% |
| Response Times | -38% | 193% | -9% | 0% | -26% | -18% | ||
| Response Time Grey 50% / Grey 80% * | 44 ? | 56.4 ? -28% | 34 ? 23% | 46 ? -5% | 38 ? 14% | 54 ? -23% | 45.6 ? -4% | |
| Response Time Black / White * | 23.2 ? | 34 ? -47% | 24 ? -3% | 26 ? -12% | 28.8 ? -24% | 35.6 ? -53% | 34.4 ? -48% | |
| PWM Frequency | 200 ? | 1316 ? 558% | 219 ? 10% | 198 ? -1% | 198.4 ? -1% | |||
| Screen | 7% | -6% | -10% | -2% | -8% | -48% | 15% | |
| Brightness middle | 310 | 391 26% | 237 -24% | 263 -15% | 319 3% | 306 -1% | 297.8 -4% | 341 10% |
| Brightness | 299 | 361 21% | 208 -30% | 236 -21% | 290 -3% | 289 -3% | 284 -5% | 315 5% |
| Brightness Distribution | 86 | 87 1% | 77 -10% | 78 -9% | 82 -5% | 85 -1% | 89 3% | 82 -5% |
| Black Level * | 0.29 | 0.4 -38% | 0.26 10% | 0.34 -17% | 0.31 -7% | 0.34 -17% | 0.849 -193% | 0.34 -17% |
| Contrast | 1069 | 978 -9% | 912 -15% | 774 -28% | 1029 -4% | 900 -16% | 351 -67% | 1003 -6% |
| Colorchecker dE 2000 * | 5.9 | 4.85 18% | 4.42 25% | 2.35 60% | 4.8 19% | 5.1 14% | 8.68 -47% | 2.07 65% |
| Colorchecker dE 2000 max. * | 10.7 | 8.54 20% | 7.8 27% | 9.9 7% | 14.98 -40% | 3.27 69% | ||
| Greyscale dE 2000 * | 5.5 | 4.01 27% | 4.43 19% | 3.33 39% | 5.7 -4% | 7.4 -35% | 9.3 -69% | 1.9 65% |
| Gamma | 2.09 105% | 2.18 101% | 2.23 99% | 2.38 92% | 2.07 106% | 2.37 93% | 2.27 97% | 2.62 84% |
| CCT | 5980 109% | 7340 89% | 6133 106% | 6917 94% | 6260 104% | 7263 89% | 10585 61% | 6514 100% |
| Color Space (Percent of AdobeRGB 1998) | 85 | 96 13% | 52.5 -38% | 37 -56% | 56.9 -33% | 63 -26% | 50.99 -40% | 58 -32% |
| Color Space (Percent of sRGB) | 99 | 100 1% | 82.9 -16% | 58 -41% | 87.4 -12% | 95 -4% | 80.42 -19% | 91 -8% |
| Media totale (Programma / Settaggio) | -10% /
-1% | 52% /
27% | -23% /
-19% | -9% /
-6% | -17% /
-13% | -33% /
-40% | -5% /
6% |
* ... Meglio usare valori piccoli
Tempi di risposta del Display
| ↔ Tempi di risposta dal Nero al Bianco | ||
|---|---|---|
| 23.2 ms ... aumenta ↗ e diminuisce ↘ combinato | ↗ 6 ms Incremento | 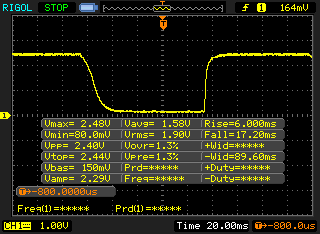 |
| ↘ 17.2 ms Calo | ||
| Lo schermo mostra buoni tempi di risposta durante i nostri tests, ma potrebbe essere troppo lento per i gamers competitivi. In confronto, tutti i dispositivi di test variano da 0.1 (minimo) a 240 (massimo) ms. » 47 % di tutti i dispositivi è migliore. Questo significa che i tempi di risposta rilevati sono simili alla media di tutti i dispositivi testati (21.5 ms). | ||
| ↔ Tempo di risposta dal 50% Grigio all'80% Grigio | ||
| 44 ms ... aumenta ↗ e diminuisce ↘ combinato | ↗ 17 ms Incremento | 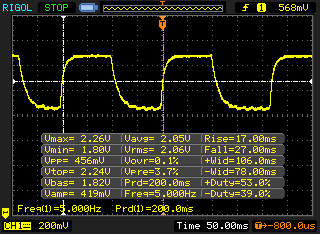 |
| ↘ 27 ms Calo | ||
| Lo schermo mostra tempi di risposta lenti nei nostri tests e sarà insoddisfacente per i gamers. In confronto, tutti i dispositivi di test variano da 0.2 (minimo) a 636 (massimo) ms. » 70 % di tutti i dispositivi è migliore. Questo significa che i tempi di risposta rilevati sono peggiori rispetto alla media di tutti i dispositivi testati (33.7 ms). | ||
Sfarfallio dello schermo / PWM (Pulse-Width Modulation)
| flickering dello schermo / PWM rilevato | 200 Hz | ≤ 55 % settaggio luminosita' | 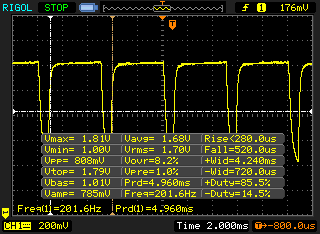 |
Il display sfarfalla a 200 Hz (Probabilmente a causa dell'uso di PWM) Flickering rilevato ad una luminosita' di 55 % o inferiore. Non dovrebbe verificarsi flickering o PWM sopra questo valore di luminosita'. La frequenza di 200 Hz è relativamente bassa, quindi gli utenti sensibili potrebbero notare il flickering ed accusare stanchezza agli occhi a questo livello di luminosità e a livelli inferiori. In confronto: 53 % di tutti i dispositivi testati non utilizza PWM per ridurre la luminosita' del display. Se è rilevato PWM, una media di 17900 (minimo: 5 - massimo: 3846000) Hz è stata rilevata. | |||
| PCMark 7 - Score | |
| HP ZBook 15 G3 | |
| HP ZBook 15u G3 | |
| Apple MacBook Pro Retina 15 inch 2015-05 | |
| MSI WS60-6QJE316H11 | |
| HP ZBook Studio G3 | |
| Dell Precision 5510 | |
| Lenovo ThinkPad P50s-20FKS00400 | |
| Lenovo ThinkPad P50 | |
| PCMark 7 Score | 5336 punti | |
| PCMark 8 Home Score Accelerated v2 | 3262 punti | |
| PCMark 8 Creative Score Accelerated v2 | 4235 punti | |
| PCMark 8 Work Score Accelerated v2 | 4301 punti | |
Aiuto | ||

| SiSoft Sandra 2016 | |
| Image Processing | |
| HP ZBook 15 G3 | |
| HP ZBook Studio G3 | |
| MSI WS60-6QJE316H11 | |
| Lenovo ThinkPad P50 | |
| Dell Precision 5510 | |
| Lenovo ThinkPad P50s-20FKS00400 | |
| GP Cryptography (Higher Security AES256+SHA2-512) | |
| Lenovo ThinkPad P50 | |
| HP ZBook 15 G3 | |
| MSI WS60-6QJE316H11 | |
| HP ZBook Studio G3 | |
| Dell Precision 5510 | |
| Lenovo ThinkPad P50s-20FKS00400 | |
| GP Financial Analysis (FP High/Double Precision) | |
| HP ZBook 15 G3 | |
| Lenovo ThinkPad P50 | |
| MSI WS60-6QJE316H11 | |
| Dell Precision 5510 | |
| HP ZBook Studio G3 | |
| Lenovo ThinkPad P50s-20FKS00400 | |
| Unigine Heaven 3.0 | |
| 1920x1080 DX 11, Normal Tessellation, High Shaders AA:Off AF:Off | |
| MSI WS60-6QJE316H11 | |
| Lenovo ThinkPad P50 | |
| HP ZBook 15 G3 | |
| Dell Precision 5510 | |
| HP ZBook Studio G3 | |
| Lenovo ThinkPad P50s-20FKS00400 | |
| 1920x1080 OpenGL, Normal Tessellation, High Shaders AA:Off AF:Off | |
| HP ZBook 15 G3 | |
| HP ZBook Studio G3 | |
| Dell Precision 5510 | |
| MSI WS60-6QJE316H11 | |
| Lenovo ThinkPad P50 | |
| Lenovo ThinkPad P50s-20FKS00400 | |
| Unigine Valley 1.0 | |
| 1920x1080 Extreme HD DirectX AA:x8 | |
| Lenovo ThinkPad P50 | |
| HP ZBook 15 G3 | |
| MSI WS60-6QJE316H11 | |
| HP ZBook Studio G3 | |
| Dell Precision 5510 | |
| Lenovo ThinkPad P50s-20FKS00400 | |
| 1920x1080 Extreme HD Preset OpenGL AA:x8 | |
| HP ZBook 15 G3 | |
| HP ZBook Studio G3 | |
| Dell Precision 5510 | |
| MSI WS60-6QJE316H11 | |
| Lenovo ThinkPad P50 | |
| Lenovo ThinkPad P50s-20FKS00400 | |
| 3DMark 06 Standard Score | 24393 punti | |
| 3DMark 11 Performance | 4673 punti | |
| 3DMark Ice Storm Standard Score | 42096 punti | |
| 3DMark Cloud Gate Standard Score | 15717 punti | |
| 3DMark Fire Strike Score | 3302 punti | |
Aiuto | ||
| basso | medio | alto | ultra | 4K | |
| BioShock Infinite (2013) | 176.7 | 115 | 100.1 | 37 | |
| The Witcher 3 (2015) | 59.4 | 36.5 | 20.8 | 10.8 | 7.7 |
| Rainbow Six Siege (2015) | 137.8 | 79.9 | 43.5 | 32 | 13.2 |
Rumorosità
| Idle |
| 30 / 30 / 30 dB(A) |
| Sotto carico |
| 51 / 52.8 dB(A) |
 | ||
30 dB silenzioso 40 dB(A) udibile 50 dB(A) rumoroso |
||
min: | ||
| HP ZBook Studio G3 6820HQ, Quadro M1000M | Dell Precision 5510 E3-1505M v5, Quadro M1000M | MSI WS60-6QJE316H11 E3-1505M v5, Quadro M2000M | Lenovo ThinkPad P50 6820HQ, Quadro M2000M | Lenovo ThinkPad P50s-20FKS00400 6500U, Quadro M500M | HP ZBook 15 G3 E3-1505M v5, Quadro M2000M | HP ZBook 15u G3 6600U, FirePro W4190M | Apple MacBook Pro Retina 15 inch 2015-05 4870HQ, Radeon R9 M370X | |
|---|---|---|---|---|---|---|---|---|
| Noise | 6% | -10% | 10% | 11% | 3% | 9% | 7% | |
| off /ambiente * | 30 | 30 -0% | ||||||
| Idle Minimum * | 30 | 30 -0% | 37.2 -24% | 30 -0% | 30 -0% | 30 -0% | 29.8 1% | 28.9 4% |
| Idle Average * | 30 | 30 -0% | 37.2 -24% | 30 -0% | 30 -0% | 30 -0% | 29.8 1% | 28.9 4% |
| Idle Maximum * | 30 | 30 -0% | 37.2 -24% | 30 -0% | 30 -0% | 30 -0% | 29.8 1% | 28.9 4% |
| Load Average * | 51 | 42.08 17% | 42.1 17% | 34.5 32% | 33.5 34% | 45.3 11% | 39.5 23% | 46 10% |
| Load Maximum * | 52.8 | 46.78 11% | 50.7 4% | 42.1 20% | 41.9 21% | 49.7 6% | 43.2 18% | 46 13% |
* ... Meglio usare valori piccoli
(-) La temperatura massima sul lato superiore è di 69.8 °C / 158 F, rispetto alla media di 38.1 °C / 101 F, che varia da 22.2 a 69.8 °C per questa classe Workstation.
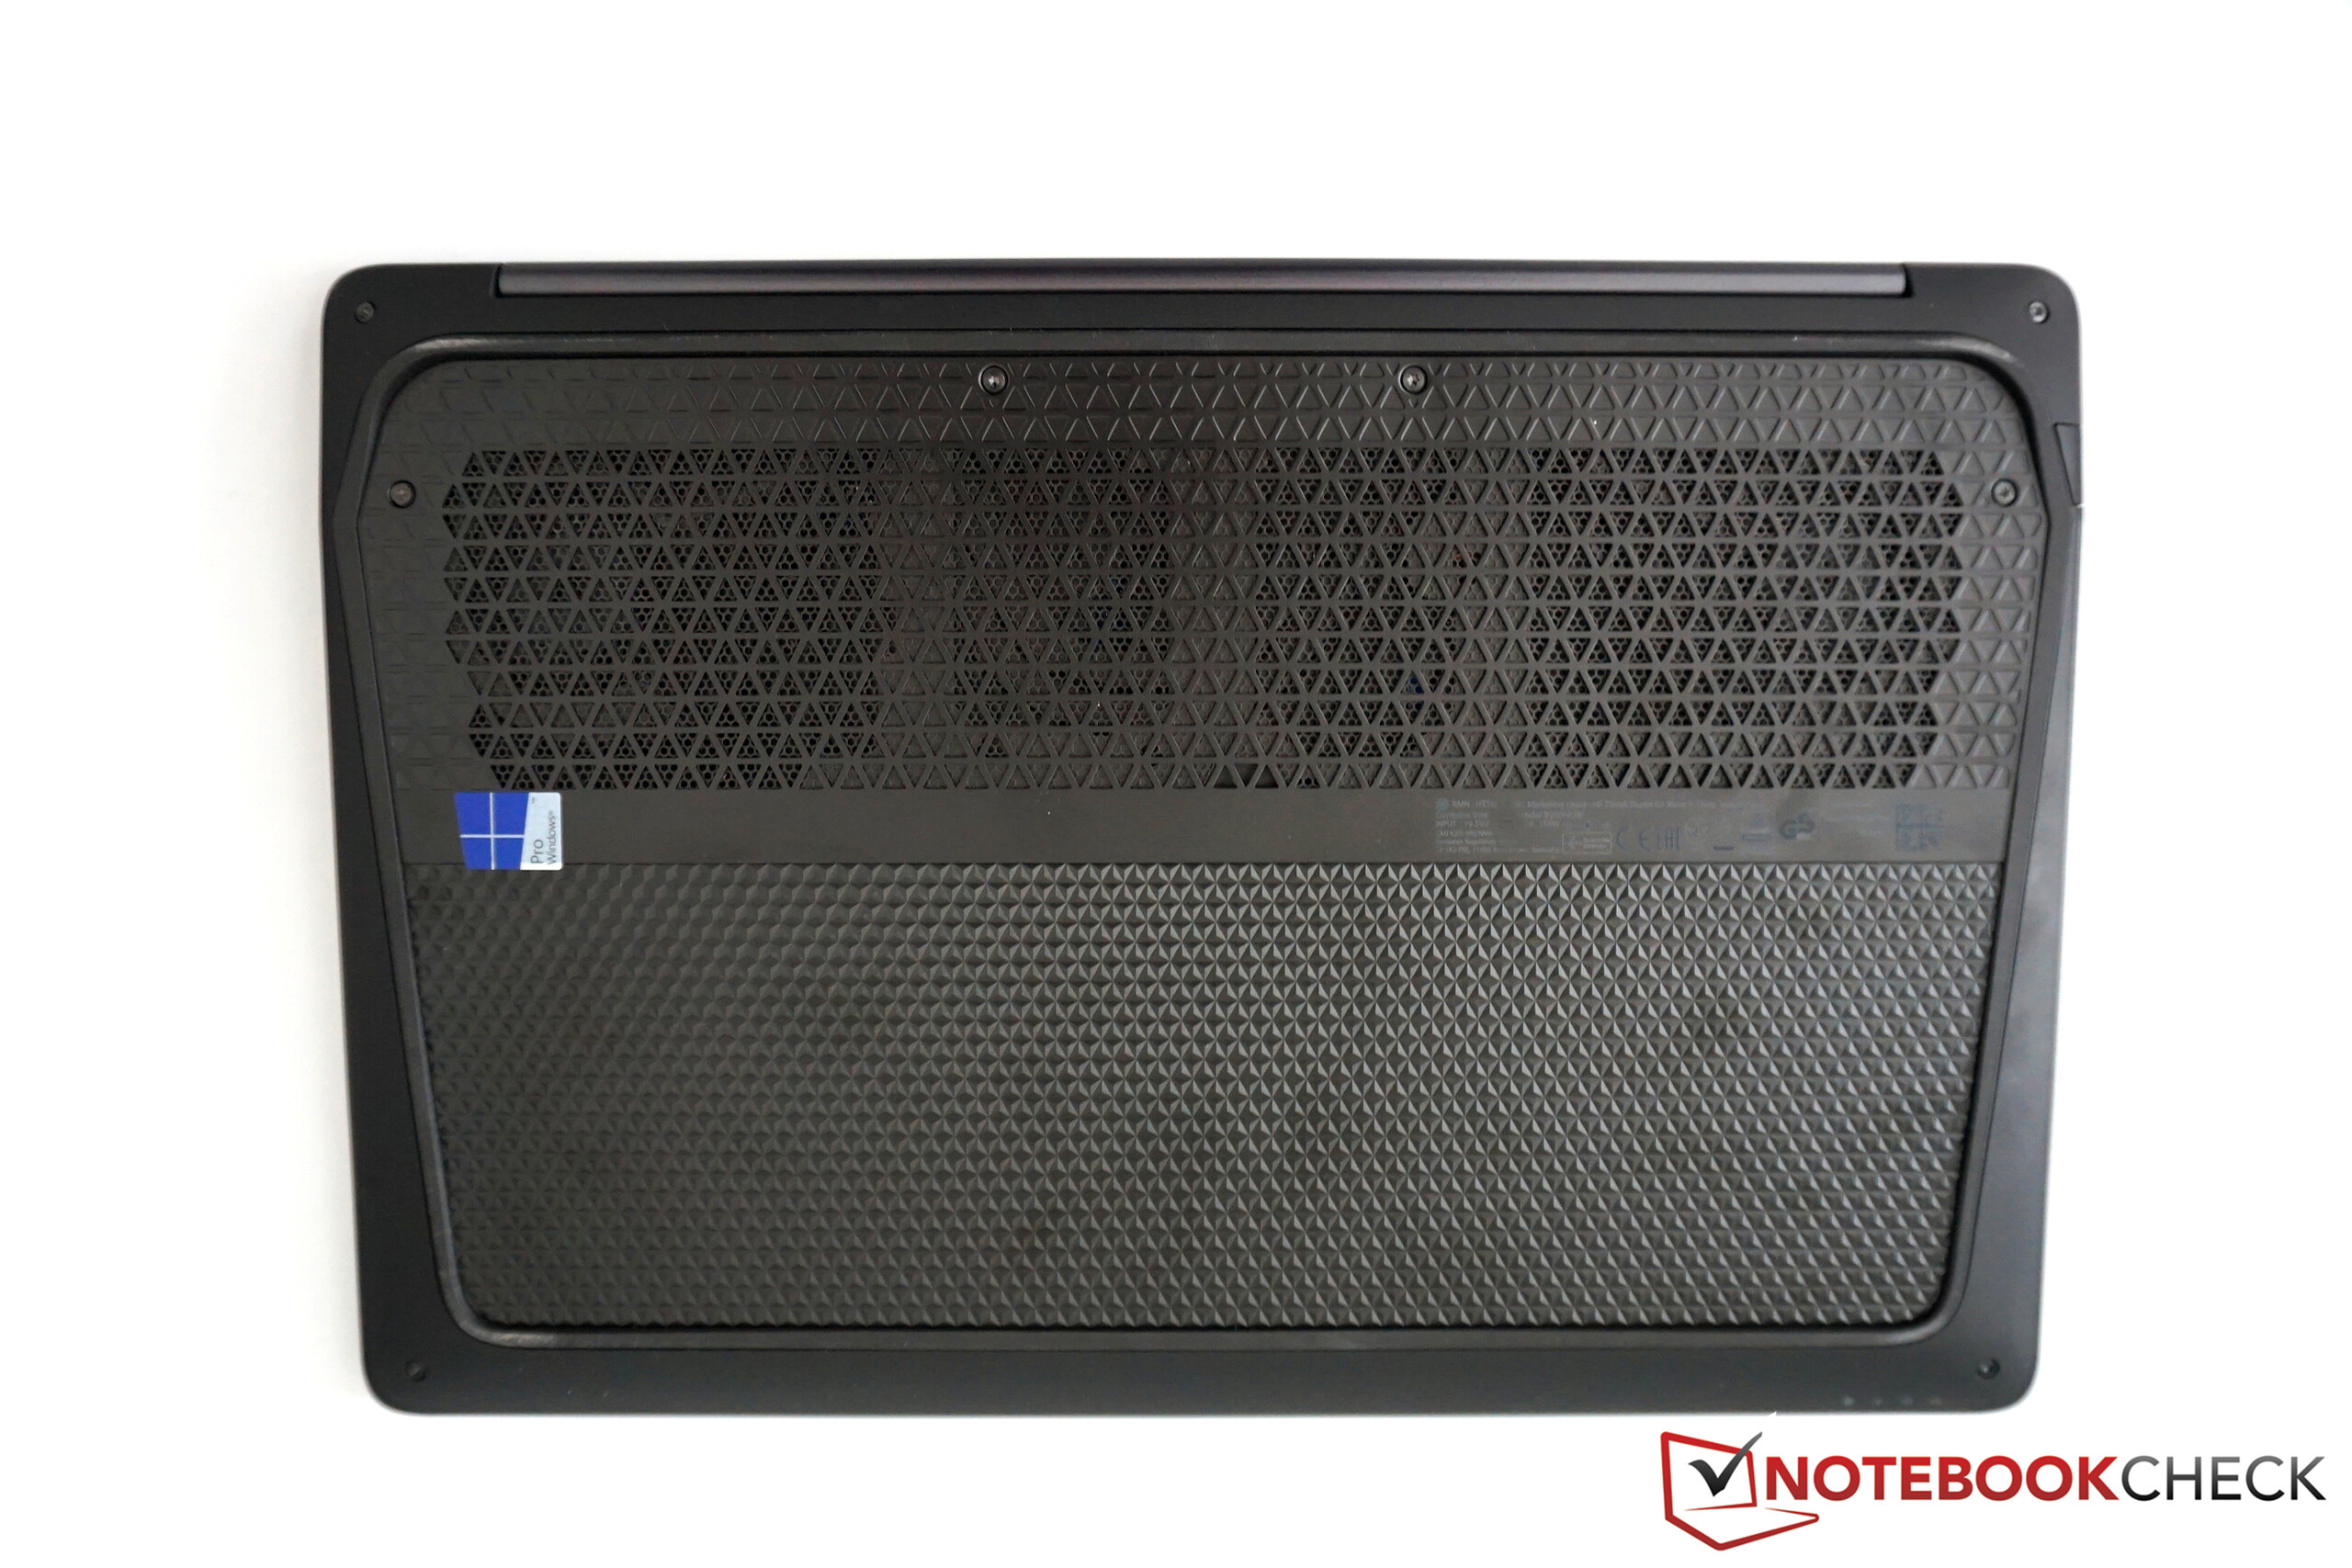
(-) Il lato inferiore si riscalda fino ad un massimo di 77.3 °C / 171 F, rispetto alla media di 41.3 °C / 106 F
(+) In idle, la temperatura media del lato superiore è di 30.1 °C / 86 F, rispetto alla media deld ispositivo di 32 °C / 90 F.
(±) I poggiapolsi e il touchpad possono diventare molto caldi al tatto con un massimo di 38 °C / 100.4 F.
(-) La temperatura media della zona del palmo della mano di dispositivi simili e'stata di 27.8 °C / 82 F (-10.2 °C / -18.4 F).
| HP ZBook Studio G3 6820HQ, Quadro M1000M | Dell Precision 5510 E3-1505M v5, Quadro M1000M | MSI WS60-6QJE316H11 E3-1505M v5, Quadro M2000M | Lenovo ThinkPad P50 6820HQ, Quadro M2000M | Lenovo ThinkPad P50s-20FKS00400 6500U, Quadro M500M | HP ZBook 15 G3 E3-1505M v5, Quadro M2000M | HP ZBook 15u G3 6600U, FirePro W4190M | Apple MacBook Pro Retina 15 inch 2015-05 4870HQ, Radeon R9 M370X | |
|---|---|---|---|---|---|---|---|---|
| Heat | 22% | 17% | 24% | 26% | 16% | 30% | 29% | |
| Maximum Upper Side * | 69.8 | 45.8 34% | 42.3 39% | 36.7 47% | 44.2 37% | 54.6 22% | 44.6 36% | 43.2 38% |
| Maximum Bottom * | 77.3 | 46.7 40% | 60.1 22% | 41.3 47% | 57.8 25% | 60.8 21% | 46 40% | 39 50% |
| Idle Upper Side * | 37.8 | 31.2 17% | 32.7 13% | 31.1 18% | 26.4 30% | 30.3 20% | 25.8 32% | 30 21% |
| Idle Bottom * | 31.4 | 31.9 -2% | 33.1 -5% | 36.2 -15% | 28.1 11% | 30.7 2% | 27.4 13% | 29.3 7% |
* ... Meglio usare valori piccoli
| Off / Standby | |
| Idle | |
| Sotto carico |
|
Leggenda:
min: Attualmente utilizziamo il Metrahit Energy, un multimetro digitale professionale per la misurazione della qualità della potenza e dell'energia monofase, per le nostre misurazioni. | |
| HP ZBook Studio G3 64 Wh, 3840x2160 | Dell Precision 5510 56 Wh, 3840x2160 | MSI WS60-6QJE316H11 47 Wh, 3840x2160 | Lenovo ThinkPad P50 90 Wh, 1920x1080 | Lenovo ThinkPad P50s-20FKS00400 67 Wh, 2880x1620 | HP ZBook 15 G3 90 Wh, 1920x1080 | HP ZBook 15u G3 90 Wh, 1920x1080 | Apple MacBook Pro Retina 15 inch 2015-05 100 Wh, 2880x1800 | |
|---|---|---|---|---|---|---|---|---|
| Power Consumption | -5% | -71% | 25% | 43% | 11% | 42% | 16% | |
| Idle Minimum * | 8.7 | 8.6 1% | 18.8 -116% | 5.6 36% | 4.3 51% | 5.7 34% | 4.3 51% | 6 31% |
| Idle Average * | 14.2 | 16.2 -14% | 29.6 -108% | 8.6 39% | 9.7 32% | 12.2 14% | 7.9 44% | 12.8 10% |
| Idle Maximum * | 14.4 | 16.7 -16% | 30.3 -110% | 9.3 35% | 10.2 29% | 12.6 12% | 11.5 20% | 13.3 8% |
| Load Average * | 85.6 | 82.6 4% | 90.4 -6% | 89.5 -5% | 45.7 47% | 83.1 3% | 43.3 49% | 82.4 4% |
| Load Maximum * | 129.7 | 131.8 -2% | 150.2 -16% | 105 19% | 55.8 57% | 138.2 -7% | 72.3 44% | 91.8 29% |
* ... Meglio usare valori piccoli
| HP ZBook Studio G3 64 Wh | Dell Precision 5510 56 Wh | MSI WS60-6QJE316H11 47 Wh | Lenovo ThinkPad P50 90 Wh | Lenovo ThinkPad P50s-20FKS00400 67 Wh | HP ZBook 15 G3 90 Wh | HP ZBook 15u G3 90 Wh | Apple MacBook Pro Retina 15 inch 2015-05 100 Wh | |
|---|---|---|---|---|---|---|---|---|
| Autonomia della batteria | 19% | -45% | 104% | 112% | 78% | 72% | 89% | |
| Reader / Idle | 511 | 428 -16% | 160 -69% | 860 68% | 1107 117% | 822 61% | 756 48% | 1039 103% |
| H.264 | 228 | 197 -14% | 141 -38% | 533 134% | 537 136% | 449 97% | 413 81% | |
| WiFi v1.3 | 208 | 286 38% | 106 -49% | 498 139% | 408 96% | 386 86% | 312 50% | 432 108% |
| Load | 65 | 109 68% | 51 -22% | 113 74% | 129 98% | 110 69% | 141 117% | 105 62% |
| WiFi | 298 |
Pro
Contro
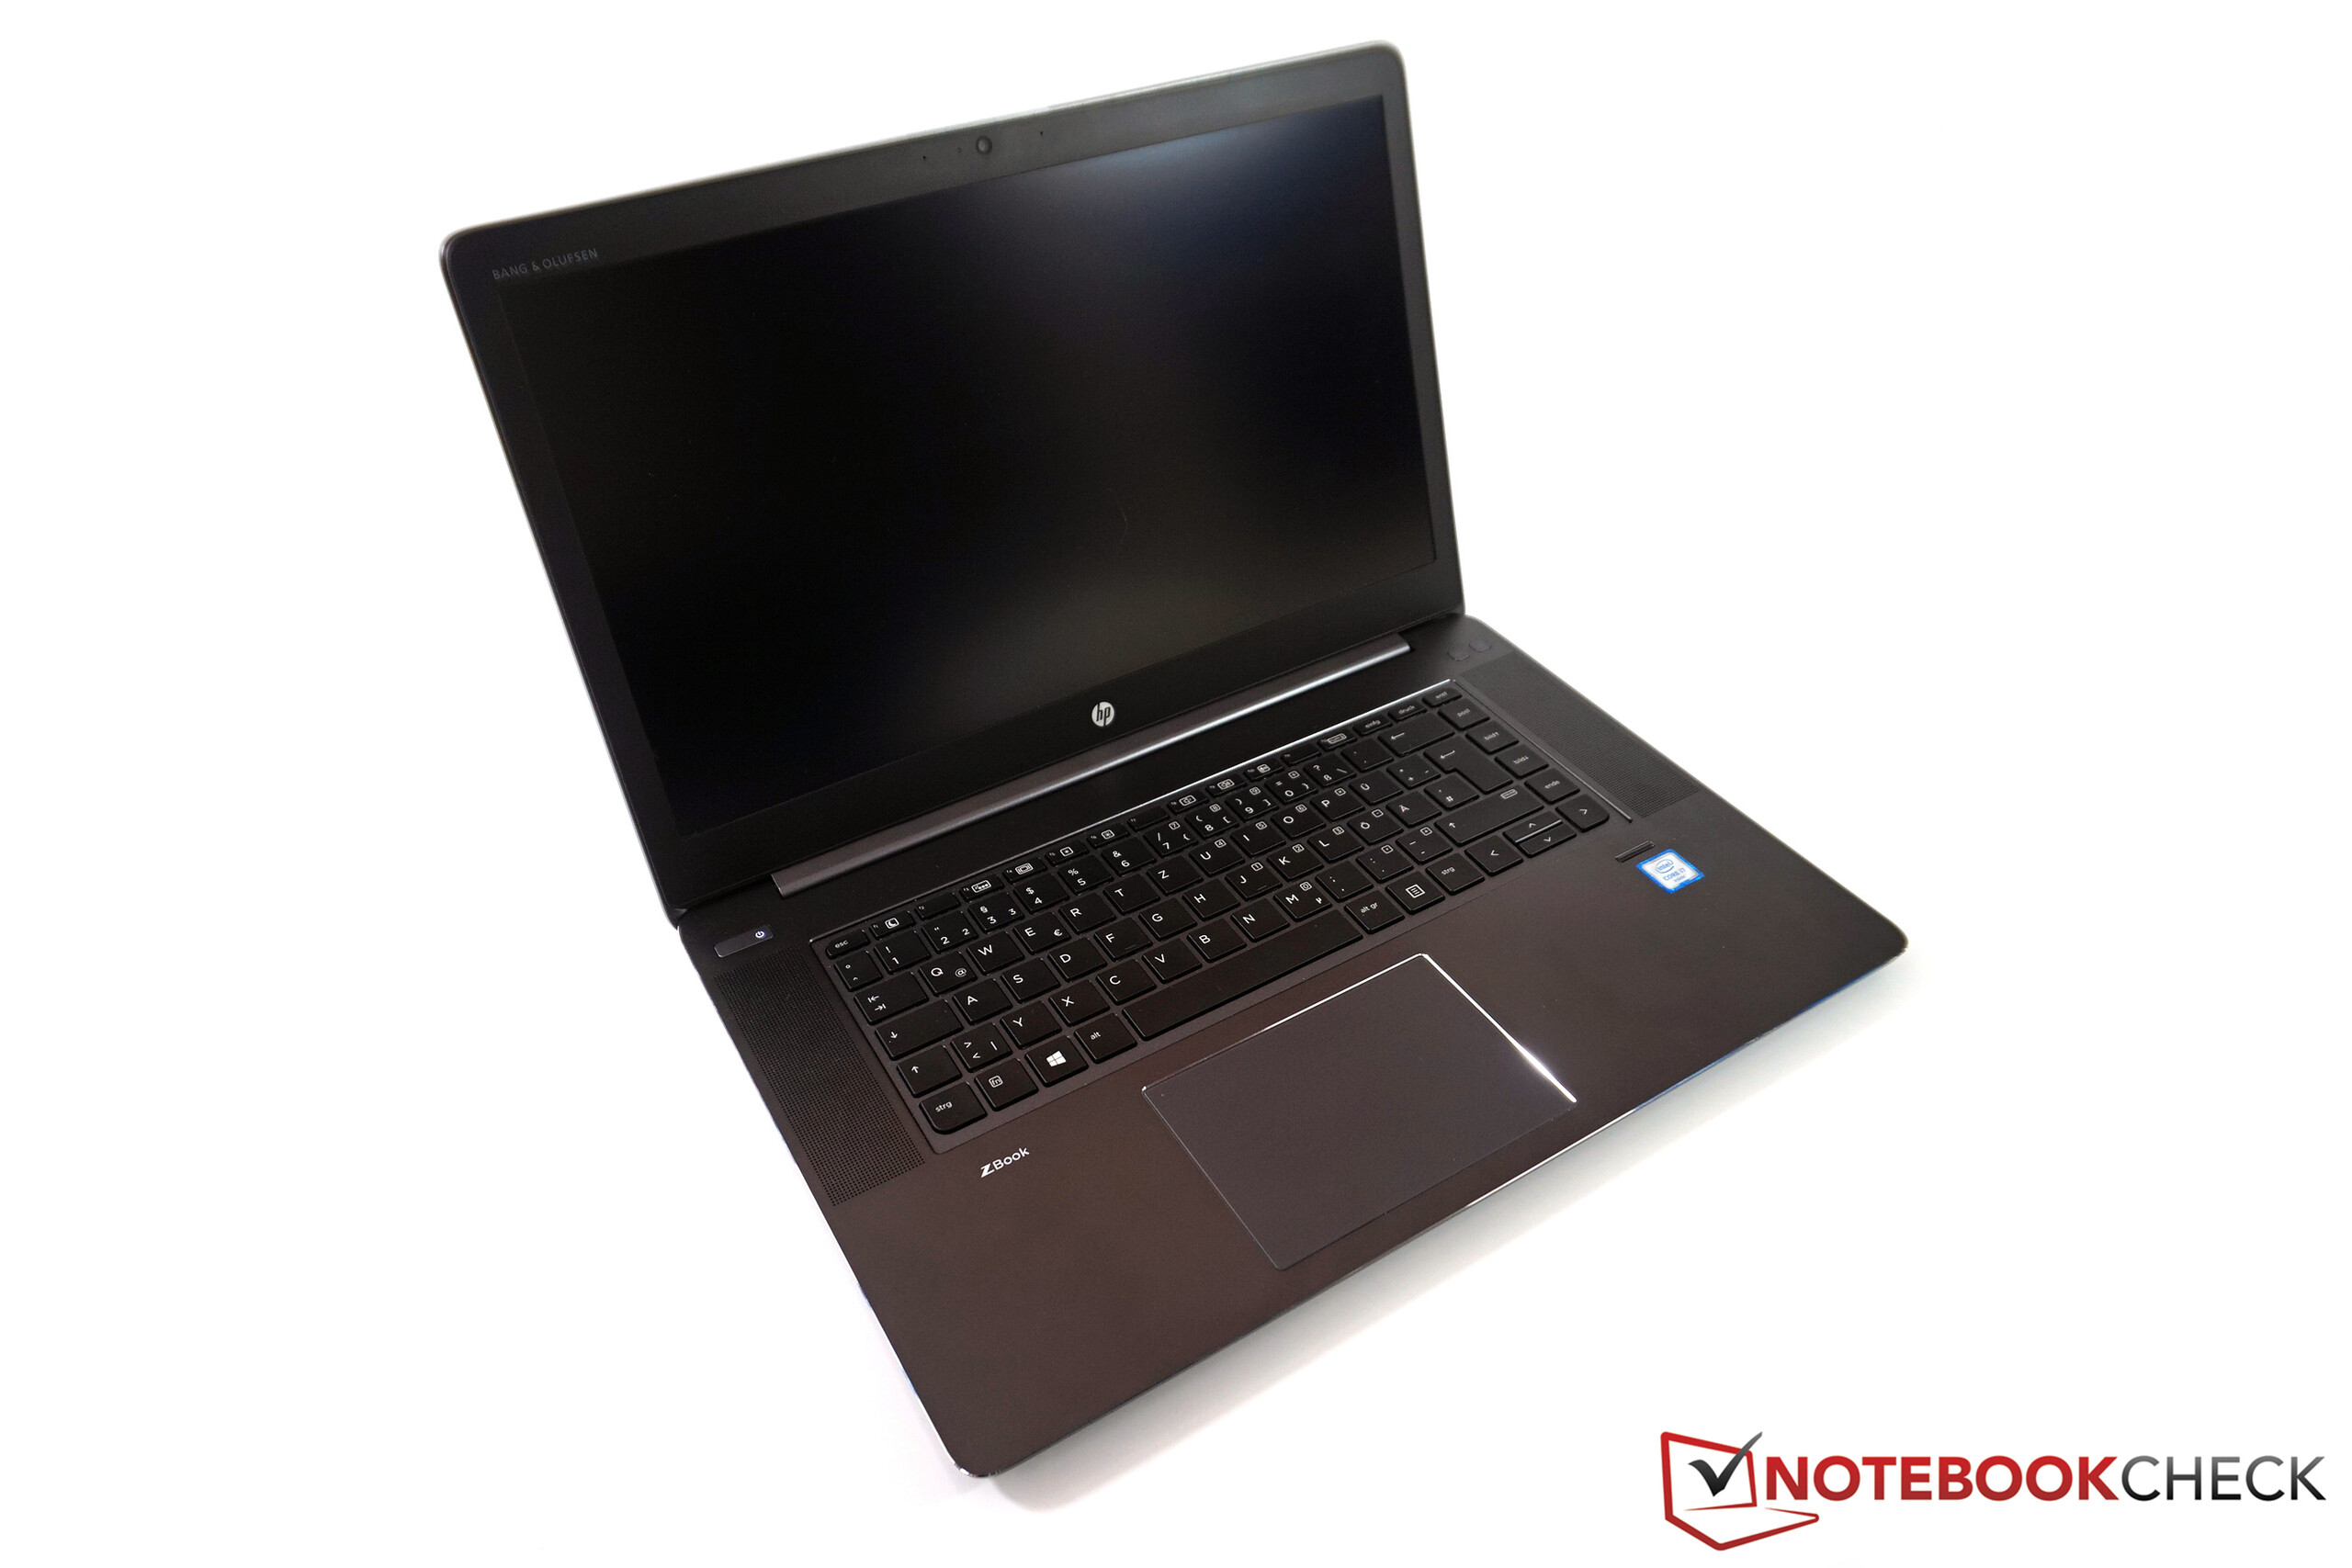
Lo ZBook Studio G3 è per noi un piccolo mistero. HP realizza un prodotto eccellente per certi aspetti, e deludente per altri. Purtroppo, nel complesso la nostra impressione su questa ambiziosa workstation è negativa. Questo dipende innanzitutto dai risultati delle emissioni e dall'autonomia. Le superfici raggiungono temperature allarmanti anche con carichi di lavoro normale. Il comportamento della ventola è altrettanto fastidioso, in quanto le due ventole ruotano in modo indipendente, e pulsano in modo evidente. L'autonomia pratica di meno di 4 ore è difficile da giustificare per un dispositivo che si propone come mobile. Per il resto, ci sono solo piccole pecche, come l'assenza di uno SmartCard reader e di un modulo WWAN.
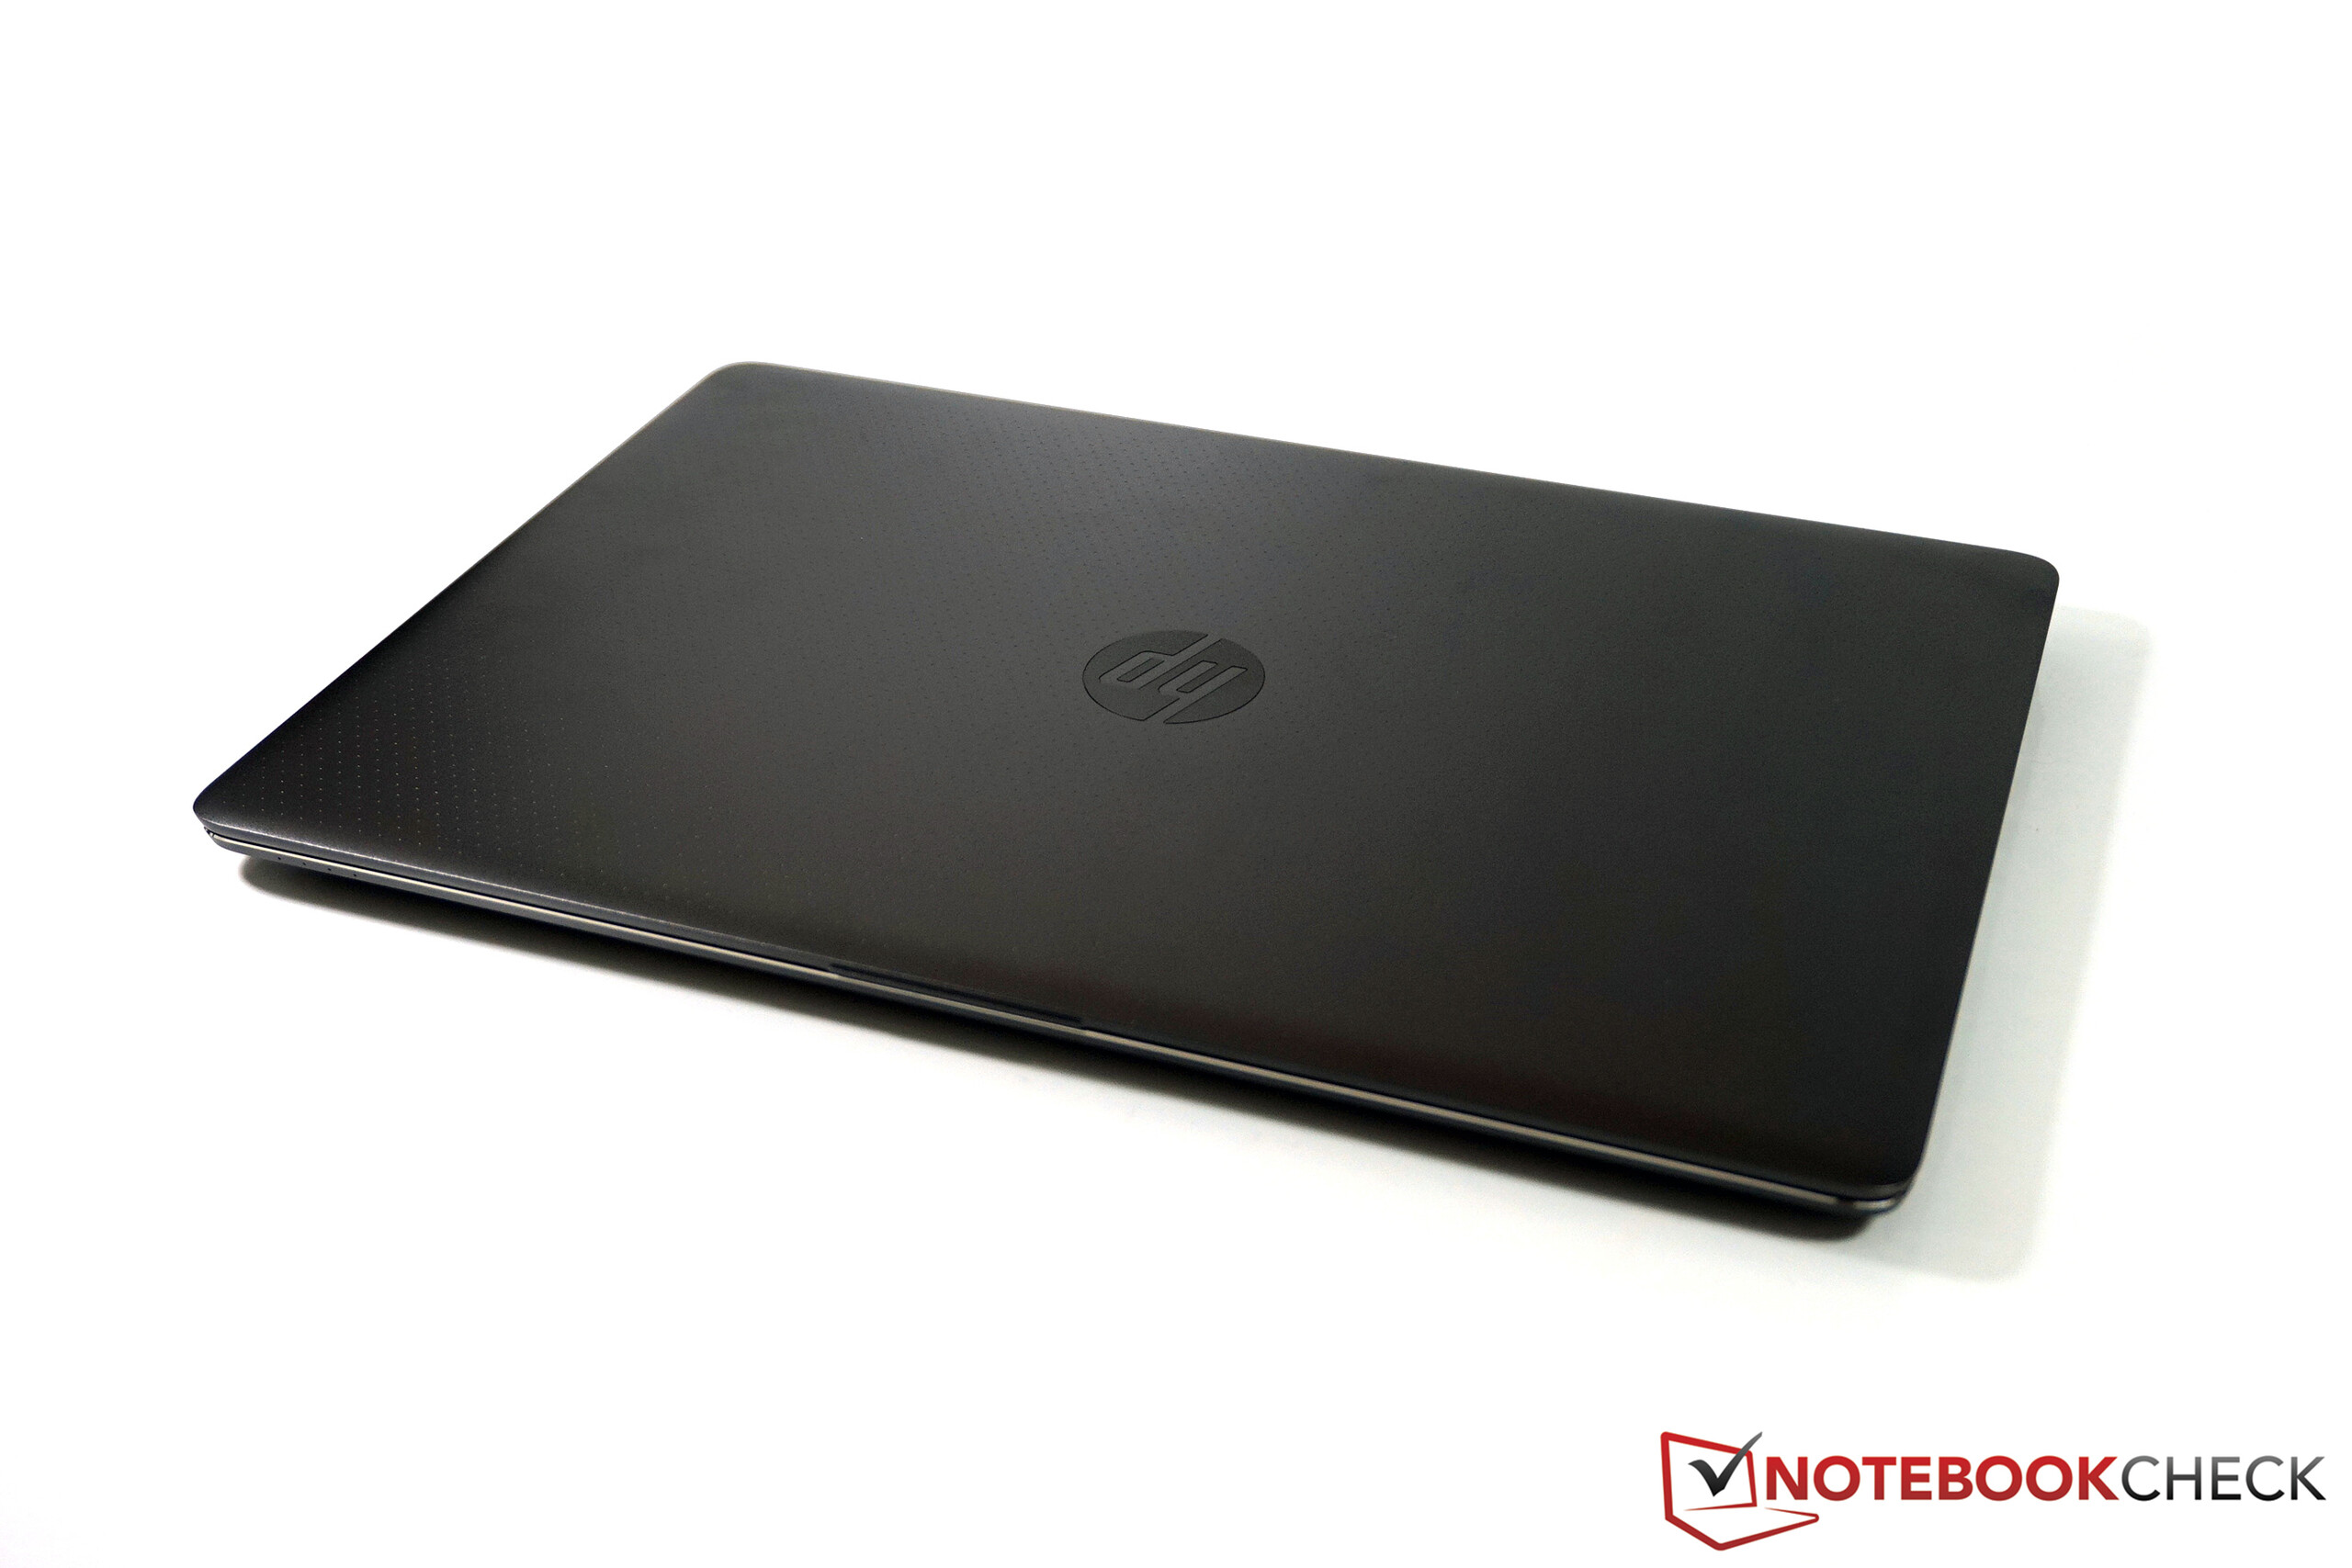
Lo ZBook Studio è un progetto ambizioso. Avremo molte prestazioni in un pacchetto compatto, ma avremo anche temperature estreme e ventole fastidiose. Questo non dovrebbe accadere con un prezzo al dettaglio di circa 3800 Euro (~$4237).
Lo ZBook Studio convince per molti aspetti: molte prestazioni in uno chassis eccellente, unitamente ad uno schermo 4K ottimo e buoni dispositivi di input. Continuiamo a pensare che le limitazioni siano eccessive. Poi bisogna considerare anche il prezzo elevato di circa 3800 Euro (~$4237) per la nostra configurazione, che difficilmente è giustificabile visti i problemi. Gli aggiornamenti del BIOS non hanno migliorato la situazione sino ad ora, ma speriamo che HP possa almeno migliorare il controllo delle ventole a breve. Per adesso, le workstations più grandi sono in vantaggio in termini di emissioni e possono essere dotate anche di componenti più potenti.
Nota: si tratta di una recensione breve, con alcune sezioni non tradotte, per la versione integrale in inglese guardate qui.
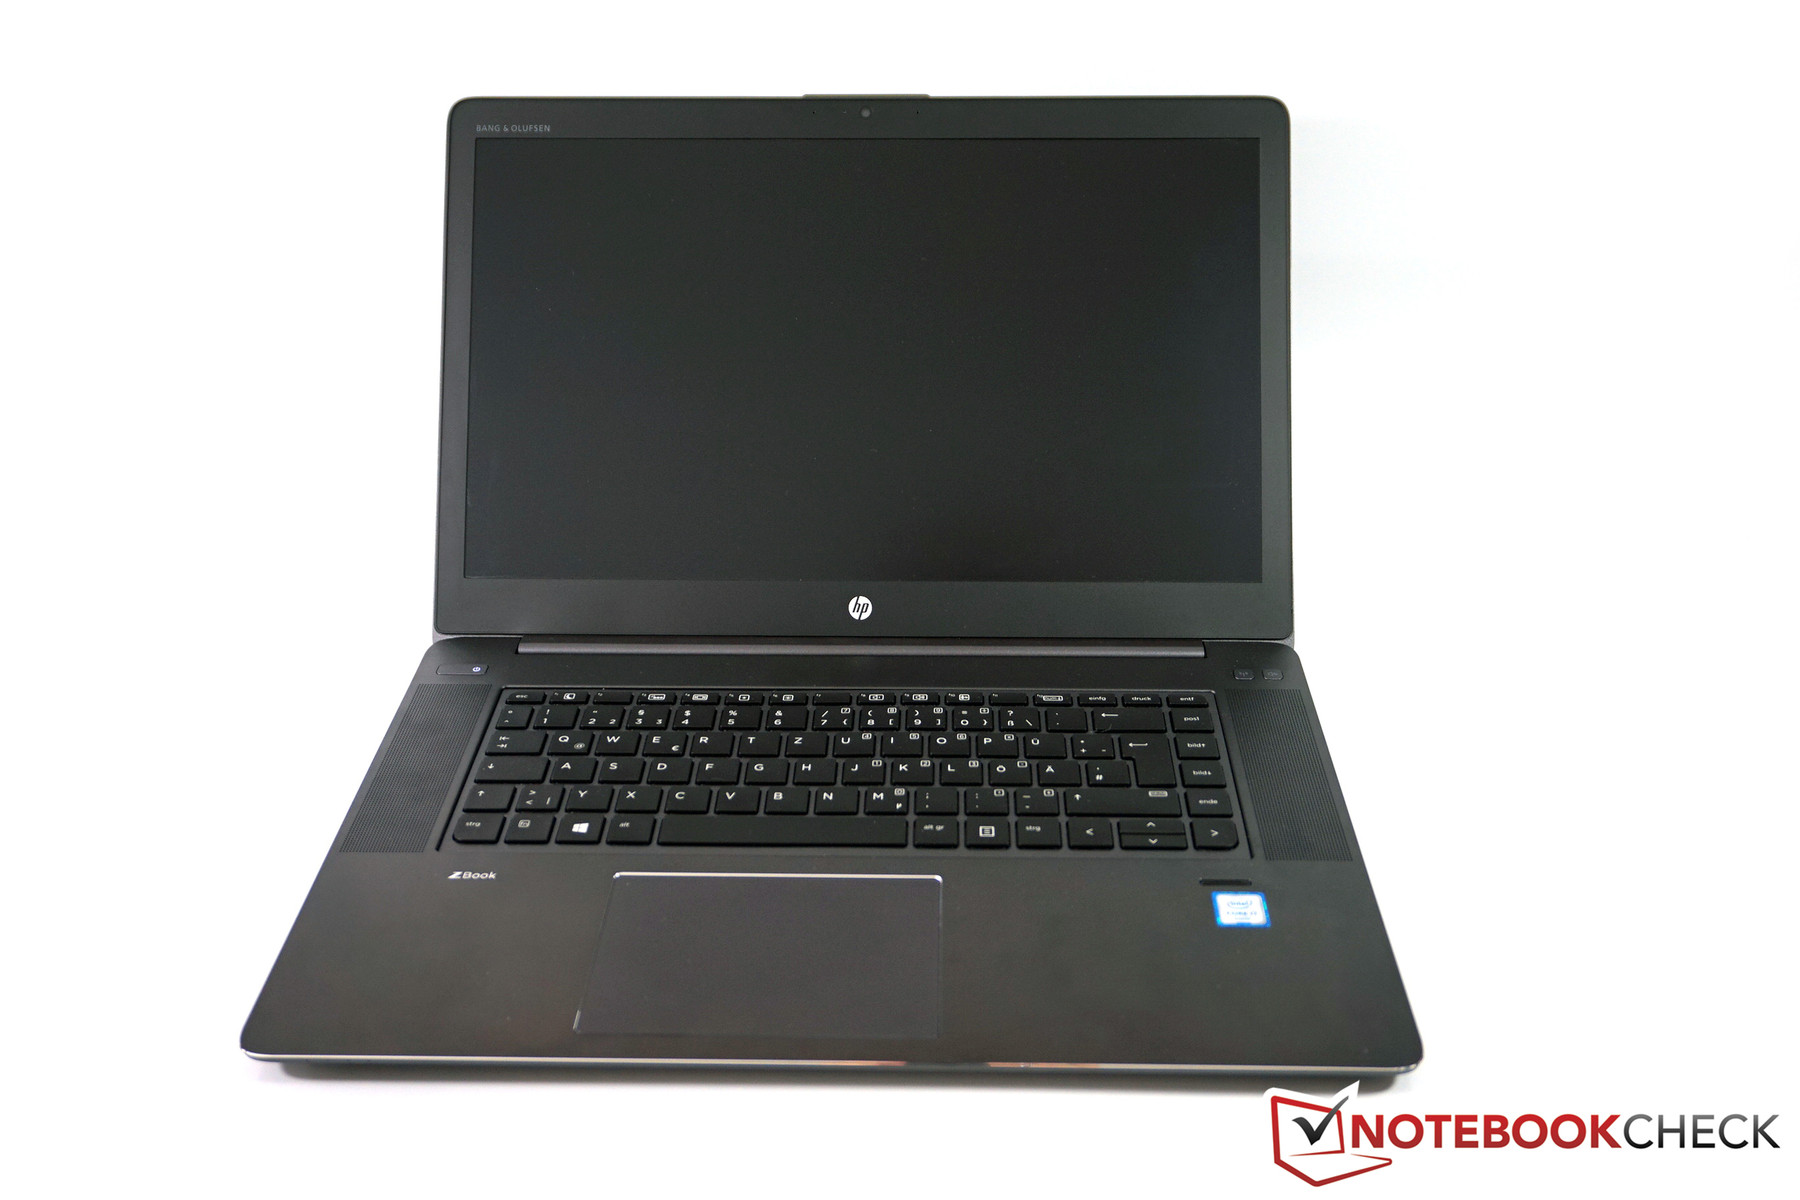
HP ZBook Studio G3
-
05/19/2016 v5.1(old)
Andreas Osthoff
Pricecompare
