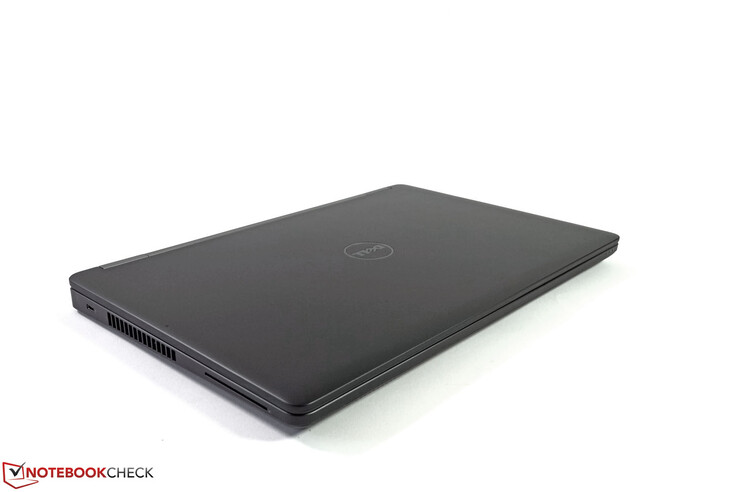
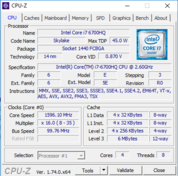
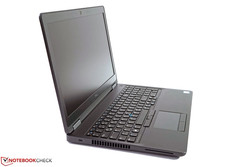
Recensione breve della Workstation Dell Precision 3510
I nostri Top 10
» Top 10 Portatili Multimedia
» Top 10 Portatili Gaming
» Top 10 Portatili Gaming Leggeri
» Top 10 Portatili da Ufficio e Business economici
» Top 10 Portatili Premium da Ufficio/Business
» Top 10 Portatili sotto i 300 Euro
» Top 10 Portatili sotto i 500 Euro
» Top 10 dei Portatili Workstation
» Top 10 Subnotebooks
» Top 10 Ultrabooks
» Top 10 Convertibili
» Top 10 Tablets
» Top 10 Tablets Windows
» Top 10 Smartphones
Size Comparison
| SD Card Reader | |
| average JPG Copy Test (av. of 3 runs) | |
| Dell Precision 3510 | |
| HP ZBook 15 G3 | |
| Lenovo ThinkPad P50 | |
| maximum AS SSD Seq Read Test (1GB) | |
| HP ZBook 15 G3 | |
| Dell Precision 3510 | |
| Lenovo ThinkPad P50 | |
| Networking | |
| WiFi Speed Client 1m | |
| WiFi Speed Server 1m |
| |||||||||||||||||||||||||
Distribuzione della luminosità: 83 %
Al centro con la batteria: 199 cd/m²
Contrasto: 498:1 (Nero: 0.4 cd/m²)
ΔE Color 9 | 0.5-29.43 Ø5
ΔE Greyscale 9.6 | 0.57-98 Ø5.3
73.7% sRGB (Calman 2D)
62.4% sRGB (Argyll 1.6.3 3D)
39.6% AdobeRGB 1998 (Argyll 1.6.3 3D)
42.86% AdobeRGB 1998 (Argyll 2.2.0 3D)
62.4% sRGB (Argyll 2.2.0 3D)
41.48% Display P3 (Argyll 2.2.0 3D)
Gamma: 2.41
| Dell Precision 3510 LGD04AF, K96D2_156WHU, , 1366x768, 15.60 | Dell Precision 3510 52452051.2 LG Display LGD049B / 156WF6, Dell P/N: F7HH2, , 1920x1080, 15.60 | Dell Precision 7510 (4K IGZO) Sharp LQ156D1, , 3840x2160, 15.60 | Dell Precision 5510 SHP143E, 7PHPT_LQ156D1, , 3840x2160, 15.60 | Lenovo ThinkPad P50 LQ156D1JW05, , 3840x2160, 15.60 | HP ZBook 15 G3 Samsung SDC5344, , 1920x1080, 15.60 | |
|---|---|---|---|---|---|---|
| Display | 54% | 100% | 102% | 98% | 58% | |
| Display P3 Coverage | 41.48 | 68.9 66% | 86.2 108% | 88.4 113% | 85.8 107% | 66.8 61% |
| sRGB Coverage | 62.4 | 88.9 42% | 99.7 60% | 100 60% | 98.6 58% | 95.5 53% |
| AdobeRGB 1998 Coverage | 42.86 | 65.4 53% | 99 131% | 99.5 132% | 98.2 129% | 69 61% |
| Response Times | 15% | -11% | 26% | -12% | ||
| Response Time Grey 50% / Grey 80% * | 56 ? | 40.4 ? 28% | 56.4 ? -1% | 39.2 ? 30% | 54 ? 4% | |
| Response Time Black / White * | 28 ? | 27.6 ? 1% | 34 ? -21% | 22 ? 21% | 35.6 ? -27% | |
| PWM Frequency | 198.4 ? | 217 | 198 ? | |||
| Screen | 47% | 57% | 65% | 42% | 40% | |
| Brightness middle | 199 | 364.6 83% | 279.2 40% | 391 96% | 250 26% | 306 54% |
| Brightness | 201 | 335 67% | 271 35% | 361 80% | 250 24% | 289 44% |
| Brightness Distribution | 83 | 83 0% | 83 0% | 87 5% | 86 4% | 85 2% |
| Black Level * | 0.4 | 0.4 -0% | 0.266 33% | 0.4 -0% | 0.31 22% | 0.34 15% |
| Contrast | 498 | 912 83% | 1050 111% | 978 96% | 806 62% | 900 81% |
| Colorchecker dE 2000 * | 9 | 4.14 54% | 4.85 46% | 4.5 50% | 5.1 43% | |
| Colorchecker dE 2000 max. * | 13.3 | 6.56 51% | 9.3 30% | 9.9 26% | ||
| Greyscale dE 2000 * | 9.6 | 3.26 66% | 4.01 58% | 7.2 25% | 7.4 23% | |
| Gamma | 2.41 91% | 2.19 100% | 2.18 101% | 2.31 95% | 2.37 93% | |
| CCT | 10695 61% | 6375 102% | 7340 89% | 6399 102% | 7263 89% | |
| Color Space (Percent of AdobeRGB 1998) | 39.6 | 85.68 116% | 96 142% | 85 115% | 63 59% | |
| Color Space (Percent of sRGB) | 62.4 | 99.72 60% | 100 60% | 98.6 58% | 95 52% | |
| Media totale (Programma / Settaggio) | 51% /
49% | 57% /
60% | 52% /
62% | 55% /
51% | 29% /
37% |
* ... Meglio usare valori piccoli
Tempi di risposta del Display
| ↔ Tempi di risposta dal Nero al Bianco | ||
|---|---|---|
| 28 ms ... aumenta ↗ e diminuisce ↘ combinato | ↗ 11 ms Incremento | |
| ↘ 17 ms Calo | ||
| Lo schermo mostra tempi di risposta relativamente lenti nei nostri tests e potrebbe essere troppo lento per i gamers. In confronto, tutti i dispositivi di test variano da 0.1 (minimo) a 240 (massimo) ms. » 67 % di tutti i dispositivi è migliore. Questo significa che i tempi di risposta rilevati sono peggiori rispetto alla media di tutti i dispositivi testati (21.5 ms). | ||
| ↔ Tempo di risposta dal 50% Grigio all'80% Grigio | ||
| 56 ms ... aumenta ↗ e diminuisce ↘ combinato | ↗ 27 ms Incremento | |
| ↘ 29 ms Calo | ||
| Lo schermo mostra tempi di risposta lenti nei nostri tests e sarà insoddisfacente per i gamers. In confronto, tutti i dispositivi di test variano da 0.2 (minimo) a 636 (massimo) ms. » 91 % di tutti i dispositivi è migliore. Questo significa che i tempi di risposta rilevati sono peggiori rispetto alla media di tutti i dispositivi testati (33.7 ms). | ||
Sfarfallio dello schermo / PWM (Pulse-Width Modulation)
| flickering dello schermo / PWM non rilevato | ||
In confronto: 53 % di tutti i dispositivi testati non utilizza PWM per ridurre la luminosita' del display. Se è rilevato PWM, una media di 17915 (minimo: 5 - massimo: 3846000) Hz è stata rilevata. | ||
| PCMark 8 | |
| Home Score Accelerated v2 | |
| Dell Precision 3510 | |
| Lenovo ThinkPad P50 | |
| Dell Precision 7510 (4K IGZO) | |
| HP ZBook 15u G3 | |
| HP ZBook 15 G3 | |
| Dell Precision 5510 | |
| Work Score Accelerated v2 | |
| Dell Precision 3510 | |
| HP ZBook 15 G3 | |
| Dell Precision 5510 | |
| HP ZBook 15u G3 | |
| Lenovo ThinkPad P50 | |
| Dell Precision 7510 (4K IGZO) | |
| PCMark 8 Home Score Accelerated v2 | 4405 punti | |
| PCMark 8 Creative Score Accelerated v2 | 5244 punti | |
| PCMark 8 Work Score Accelerated v2 | 5258 punti | |
Aiuto | ||
| Dell Precision 3510 Samsung SM951 MZVPV256HDGL m.2 PCI-e | Dell Precision 5510 SK hynix SC920 512 GB | Dell Precision 7510 (4K IGZO) Samsung SSD SM951a 512GB M.2 PCIe 3.0 x4 NVMe (MZVKV512) | Lenovo ThinkPad P50 Samsung SM951 MZVPV256HDGL m.2 PCI-e | HP ZBook 15u G3 Samsung SM951 MZVPV256HDGL m.2 PCI-e | HP ZBook 15 G3 Samsung SM951 MZVPV512HDGL m.2 PCI-e | |
|---|---|---|---|---|---|---|
| AS SSD | -58% | 18% | 16% | 13% | 13% | |
| Seq Write | 1093 | 389 -64% | 1484 36% | 1252 15% | 1106 1% | 1181 8% |
| Seq Read | 1897 | 474 -75% | 1953 3% | 1930 2% | 1859 -2% | 1841 -3% |
| 4K-64 Write | 294.1 | 257 -13% | 375.7 28% | 340.7 16% | 335.6 14% | 257 -13% |
| 4K-64 Read | 1114 | 327 -71% | 1067 -4% | 1077 -3% | 1781 60% | 1066 -4% |
| 4K Write | 121.7 | 82.2 -32% | 145.1 19% | 212.2 74% | 126.2 4% | 173.1 42% |
| 4K Read | 46.76 | 17.95 -62% | 49.22 5% | 54.2 16% | 48.7 4% | 52.5 12% |
| Access Time Read * | 0.059 | 0.111 -88% | 0.036 39% | 0.062 -5% | 0.053 10% | 0.031 47% |
* ... Meglio usare valori piccoli
| SPECviewperf 11 | |
| 1920x1080 Siemens NX | |
| Lenovo ThinkPad P50 | |
| HP ZBook 15 G3 | |
| Dell Precision 5510 | |
| Dell Precision 3510 | |
| Asus GL552VW-DK725T | |
| 1920x1080 Tcvis | |
| HP ZBook 15 G3 | |
| Lenovo ThinkPad P50 | |
| Dell Precision 5510 | |
| Dell Precision 3510 | |
| Asus GL552VW-DK725T | |
| 1920x1080 SolidWorks | |
| Lenovo ThinkPad P50 | |
| Dell Precision 5510 | |
| HP ZBook 15 G3 | |
| Dell Precision 3510 | |
| Asus GL552VW-DK725T | |
| 1920x1080 Pro/ENGINEER | |
| HP ZBook 15 G3 | |
| Lenovo ThinkPad P50 | |
| Dell Precision 5510 | |
| Dell Precision 3510 | |
| Asus GL552VW-DK725T | |
| 1920x1080 Maya | |
| HP ZBook 15 G3 | |
| Lenovo ThinkPad P50 | |
| Dell Precision 5510 | |
| Dell Precision 3510 | |
| Asus GL552VW-DK725T | |
| 1920x1080 Lightwave | |
| Lenovo ThinkPad P50 | |
| Dell Precision 5510 | |
| HP ZBook 15 G3 | |
| Dell Precision 3510 | |
| Asus GL552VW-DK725T | |
| 1920x1080 Ensight | |
| HP ZBook 15 G3 | |
| Lenovo ThinkPad P50 | |
| Dell Precision 5510 | |
| Asus GL552VW-DK725T | |
| Dell Precision 3510 | |
| 1920x1080 Catia | |
| Lenovo ThinkPad P50 | |
| Dell Precision 5510 | |
| HP ZBook 15 G3 | |
| Asus GL552VW-DK725T | |
| Dell Precision 3510 | |
| 3DMark 11 - 1280x720 Performance GPU | |
| Lenovo ThinkPad P50 | |
| Dell Precision 7510 (4K IGZO) | |
| HP ZBook 15 G3 | |
| Dell Precision 5510 | |
| HP ZBook 15u G3 | |
| 3DMark | |
| 1280x720 Cloud Gate Standard Graphics | |
| HP ZBook 15 G3 | |
| Dell Precision 7510 (4K IGZO) | |
| Lenovo ThinkPad P50 | |
| Dell Precision 5510 | |
| Dell Precision 3510 | |
| HP ZBook 15u G3 | |
| 1920x1080 Fire Strike Graphics | |
| Dell Precision 7510 (4K IGZO) | |
| HP ZBook 15 G3 | |
| Lenovo ThinkPad P50 | |
| Dell Precision 5510 | |
| Dell Precision 3510 | |
| HP ZBook 15u G3 | |
| 3DMark 06 Standard Score | 15680 punti | |
| 3DMark Cloud Gate Standard Score | 11740 punti | |
| 3DMark Fire Strike Score | 2001 punti | |
Aiuto | ||
| basso | medio | alto | ultra | |
| Tomb Raider (2013) | 158 | 75 | 58 | 25 |
| BioShock Infinite (2013) | 137 | 66 | 57 | 22 |
| Total War: Rome II (2013) | 106 | 80 | 66 | 23 |
| Middle-earth: Shadow of Mordor (2014) | 66 | 41 | 23 | 21 |
| Dirt Rally (2015) | 216 | 71 | 47 | 19 |
| The Witcher 3 (2015) | 31 | 21 | 10 |
Rumorosità
| Idle |
| 30 / 30 / 30 dB(A) |
| Sotto carico |
| 38.1 / 44.4 dB(A) |
 | ||
30 dB silenzioso 40 dB(A) udibile 50 dB(A) rumoroso |
||
min: | ||
(-) La temperatura massima sul lato superiore è di 54.6 °C / 130 F, rispetto alla media di 38.1 °C / 101 F, che varia da 22.2 a 69.8 °C per questa classe Workstation.
(-) Il lato inferiore si riscalda fino ad un massimo di 59.4 °C / 139 F, rispetto alla media di 41.3 °C / 106 F
(+) In idle, la temperatura media del lato superiore è di 28 °C / 82 F, rispetto alla media deld ispositivo di 32 °C / 90 F.
(+) I poggiapolsi e il touchpad sono piu' freddi della temperatura della pelle con un massimo di 31.5 °C / 88.7 F e sono quindi freddi al tatto.
(-) La temperatura media della zona del palmo della mano di dispositivi simili e'stata di 27.8 °C / 82 F (-3.7 °C / -6.7 F).
| Off / Standby | |
| Idle | |
| Sotto carico |
|
Leggenda:
min: Attualmente utilizziamo il Metrahit Energy, un multimetro digitale professionale per la misurazione della qualità della potenza e dell'energia monofase, per le nostre misurazioni. | |
| Dell Precision 3510 6700HQ, FirePro W5130M, Samsung SM951 MZVPV256HDGL m.2 PCI-e, TN LED, 1366x768, 15.60 | Dell Precision 5510 E3-1505M v5, Quadro M1000M, SK hynix SC920 512 GB, IGZO LED, 3840x2160, 15.60 | Dell Precision 7510 (4K IGZO) E3-1535M v5, Quadro M2000M, Samsung SSD SM951a 512GB M.2 PCIe 3.0 x4 NVMe (MZVKV512), IGZO IPS, 3840x2160, 15.60 | Lenovo ThinkPad P50 E3-1505M v5, Quadro M2000M, Samsung SM951 MZVPV256HDGL m.2 PCI-e, IPS, 3840x2160, 15.60 | HP ZBook 15 G3 E3-1505M v5, Quadro M2000M, Samsung SM951 MZVPV512HDGL m.2 PCI-e, UWVA-IPS, 1920x1080, 15.60 | |
|---|---|---|---|---|---|
| Power Consumption | -89% | -247% | -102% | -52% | |
| Idle Minimum * | 4.2 | 8.6 -105% | 23.9 -469% | 10.2 -143% | 5.7 -36% |
| Idle Average * | 6.5 | 16.2 -149% | 28.9 -345% | 17.8 -174% | 12.2 -88% |
| Idle Maximum * | 7.1 | 16.7 -135% | 30 -323% | 18.3 -158% | 12.6 -77% |
| Load Average * | 74.6 | 82.6 -11% | 95.2 -28% | 76.9 -3% | 83.1 -11% |
| Load Maximum * | 92.2 | 131.8 -43% | 157.1 -70% | 123.5 -34% | 138.2 -50% |
* ... Meglio usare valori piccoli
| Dell Precision 3510 6700HQ, FirePro W5130M, 84 Wh | Dell Precision 5510 E3-1505M v5, Quadro M1000M, 56 Wh | Dell Precision 7510 (4K IGZO) E3-1535M v5, Quadro M2000M, 91 Wh | Lenovo ThinkPad P50 E3-1505M v5, Quadro M2000M, 90 Wh | HP ZBook 15 G3 E3-1505M v5, Quadro M2000M, 90 Wh | HP ZBook 15u G3 6600U, FirePro W4190M, 90 Wh | |
|---|---|---|---|---|---|---|
| Autonomia della batteria | -46% | -58% | -41% | -23% | -18% | |
| Reader / Idle | 1168 | 428 -63% | 268 -77% | 539 -54% | 822 -30% | 756 -35% |
| H.264 | 605 | 197 -67% | 331 -45% | 449 -26% | ||
| WiFi v1.3 | 591 | 286 -52% | 239 -60% | 288 -51% | 386 -35% | 312 -47% |
| Load | 111 | 109 -2% | 70 -37% | 98 -12% | 110 -1% | 141 27% |
| WiFi | 298 |
Pro
Contro
Il Dell Precision 3510 è un dispositivo professionale che punta chiaramente sulla mobilità. Grazie alla sua sottile costruzione, all'ampia autonomia ed al robusto chassis, è una opzione molto interessante per il settore staff. Altri vantaggi di questa workstation mobile sono la ampia selezione di porte e le opzioni di garanzia e supporto.
Anche il prezzo della serie è attraente e consente un economico accesso nel settore delle workstations mobile.
Tuttavia, dovrete accettare alcuni compromessi in termini di aspetti fondamentali, le performance calano nettamente sotto carico sostenuto e le emissioni raggiungono livelli eccessivi in questo scenario. Un altro punto non ideale è la limitata possibilità di upgrade e le prestazioni CAD in generale. Alcuni concorrenti offrono di più.
Se anche doveste riuscire a convivere con questi aspetti in base allo scenario di utilizzo, il display del nostro modello non è una scelta popolare tra gli utenti. Considerando l'orientamento professionale del dispositivo, nessuna delle caratteristiche del display (risoluzione, luminosità, contrasto, gamma di colore, distribuzione della luminosità, stabilità degli angoli di visuale) rispecchia le attese del gruppo di utenti target.
Fortunatamente, Dell offre altre versioni di display nel suo negozio online, quindi questo problema può essere evitato completamente ed il dispositivo riesce a dare un'impressione nettamente migliore.
Nota: si tratta di una recensione breve, con alcune sezioni non tradotte, per la versione integrale in inglese guardate qui.
Dell Precision 3510
-
07/17/2016 v5.1(old)
Tobias Winkler


 Deutsch
 English
 Español
 Français
 Italiano
 Nederlands
 Polski
 Português
 Русский
 Türkçe
 Svenska
 Chinese
 Magyar