Notebookcheck Logo

Recensione breve dell Workstation Fujitsu Celsius H760

Grande successo. Il Fujitsu Celsius H760 è un esempio di successo di una classica workstation. Perfomance, flessibilità, qualità e ergonomia sono le caratteristiche più importanti. La nostra recensione mostra cosa altro ci si può aspettare da questo modello.
bene (86%) Fujitsu Celsius H760 Intel Xeon E3-1505M v5NVIDIA Quadro M2000M Workstation - 10/12/2016 - v5.1
Dispositivo di test fornito da http://shop.fujitsu.com/de/notebooks/mobile-workstations
Scarica la tua immagine come PNG / SVG
Fujitsu Celsius H760 (Celsius H Serie)
Processore
Intel Xeon E3-1505M v5 4 x 2.8 - 3.7 GHz, Skylake
Scheda grafica
NVIDIA Quadro M2000M - 4 GB VRAM, 10.18.13.5459 - nVIDIA ForceWare 354.59, Nvidia Optimus mit Nvidia Quadro M2000M und Intel P530
Memoria
16 GB 
, Samsung DDR4 2x 8 GB, SO DIMM 2133 MHz / PC4-17000 ECC (M474A1G43EB1-CPB), 2 Slots free
Schermo
15.60 pollici 16:9, 1920 x 1080 pixel 141 PPI, LGD046F LP156WF6-SPP1, IPS LED, 88 % sRGB, lucido: no
Scheda madre
Intel CM236 (Skylake PCH-H)
Harddisk
Samsung SM951 MZVPV512 m.2 PCI-e, 512 GB 
, + 1 TB HDD Seagate ST1000LM 014-1EJ164
Scheda audio
Realtek ALC255 @ Intel Skylake PCH - High Definition Audio Controller
Porte di connessione
1 USB 2.0, 3 USB 3.0 / 3.1, 1 USB 3.1 Gen 2, 1 Thunderbolt, 1 VGA, 1 HDMI, 2 DisplayPort, 1 Kensington Lock, 1 Porta Docking, Connessioni Audio: line-in (microfono) + line-out separate (entrambe con jack da 3.5 mm), Lettore schede: Realtek PCIe-card reader SD, SDHC, SDXC, 1 SmartCard, 0 Lettore impronte digitali, Sensore luminosità, Sensori: PalmSecure biometrische Venenmustererkennung, TPM 2.0
Rete
Intel Ethernet Connection I219-LM (10/100/1000MBit/s), Intel Dual Band Wireless-AC 8260 (a/b/g/n = Wi-Fi 4/ac = Wi-Fi 5/), Bluetooth 4.2, Sierra Wireless Airprime EM7305 (LTE/ HSPA+), GPS
Drive ottico
HL-DT-ST DVDRAM GUD0N
Dimensioni
altezza x larghezza x profondità (in mm): 32 x 380 x 257
Batteria
72 Wh, 6400 mAh ioni di litio, removibile, 10.8V
Sistema Operativo
Microsoft Windows 7 Professional 64 Bit
Camera
Webcam: 2.0 MP
Altre caratteristiche
Casse: casse stereo, Tastiera: Chiclet, Illuminazione Tastiera: si, 36 Mesi Garanzia
Peso
2.98 kg
Prezzo
3700 Euro
Nota: il produttore potrebbe usare componenti di fornitori diversi pannelli dei diplay, drive o banchi di memoria con specifiche simili.


Size Comparison

380 mm 260 mm 33 mm 2.7 kg380 mm 257 mm 32 mm 3 kg386 mm 264 mm 26 mm 2.7 kg357 mm 235 mm 11.5 mm 2 kg297 mm 210 mm 1 mm 5.7 g
Front: status LEDs
Front: status LEDs
Rear: Fan exhaust, battery
Left: AC power, LAN, VGA; DisplayPort, Thunderbolt 3, 2x USB 3.0, SmartCard reader, card reader, audio in/out
Right: Optical drive, USB 2.0, slot for a Kensington Lock
SD Card Reader
average JPG Copy Test (av. of 3 runs)
Fujitsu Celsius H760
 
84 MB/s
maximum AS SSD Seq Read Test (1GB)
Fujitsu Celsius H760
 
171 MB/s
Networking
WiFi Speed Client 1m
WiFi Speed Server 1m
306
cd/m²
335
cd/m²
328
cd/m²
302
cd/m²
341
cd/m²
320
cd/m²
283
cd/m²
294
cd/m²
281
cd/m²
Distribuzione della luminosità
LGD046F LP156WF6-SPP1 tested with X-Rite i1Pro 2
Massima: 341 cd/m² (Nits) Media: 310 cd/m² Minimum: 17.5 cd/m²
Distribuzione della luminosità: 82 %
Al centro con la batteria: 342 cd/m²
Contrasto: 1003:1 (Nero: 0.34 cd/m²)
ΔE Color 3.8 | 0.5-29.43 Ø5
ΔE Greyscale 2 | 0.57-98 Ø5.3
88% sRGB (Calman 2D)
82.2% sRGB (Argyll 1.6.3 3D)
54% AdobeRGB 1998 (Argyll 1.6.3 3D)
60.3% AdobeRGB 1998 (Argyll 2.2.0 3D)
82.4% sRGB (Argyll 2.2.0 3D)
63.9% Display P3 (Argyll 2.2.0 3D)
Gamma: 2.17
Fujitsu Celsius H760
LGD046F LP156WF6-SPP1, , 1920x1080, 15.60
HP ZBook 15 G3
Samsung SDC5344, , 1920x1080, 15.60
Lenovo ThinkPad P50
LP156WF6-SPK1, , 1920x1080, 15.60
Dell Precision 7510 (4K IGZO)
Sharp LQ156D1, , 3840x2160, 15.60
Display
12%
-34%
40%
Display P3 Coverage
63.9
66.8
5%
39.13
-39%
86.2
35%
sRGB Coverage
82.4
95.5
16%
58.5
-29%
99.7
21%
AdobeRGB 1998 Coverage
60.3
69
14%
40.45
-33%
99
64%
Response Times
-40%
-11%
-6%
Response Time Grey 50% / Grey 80% *
38 ?(15, 23)
54 ?(24.4, 29.6)
-42%
46 ?(17, 29)
-21%
40.4 ?(19.6, 20.8)
-6%
Response Time Black / White *
26 ?(7, 19)
35.6 ?(11.6, 24)
-37%
26 ?(9, 17)
-0%
27.6 ?(6.8, 20.8)
-6%
PWM Frequency
198 ?(95)
198.4 ?(29)
Screen
-29%
-18%
4%
Brightness middle
341
306
-10%
263
-23%
279.2
-18%
Brightness
310
289
-7%
236
-24%
271
-13%
Brightness Distribution
82
85
4%
78
-5%
83
1%
Black Level *
0.34
0.34
-0%
0.34
-0%
0.266
22%
Contrast
1003
900
-10%
774
-23%
1050
5%
Colorchecker dE 2000 *
3.8
5.1
-34%
2.35
38%
4.14
-9%
Colorchecker dE 2000 max. *
10.8
9.9
8%
6.56
39%
Greyscale dE 2000 *
2
7.4
-270%
3.33
-67%
3.26
-63%
Gamma
2.17 101%
2.37 93%
2.38 92%
2.19 100%
CCT
6581 99%
7263 89%
6917 94%
6375 102%
Color Space (Percent of AdobeRGB 1998)
54
63
17%
37
-31%
85.68
59%
Color Space (Percent of sRGB)
82.2
95
16%
58
-29%
99.72
21%
Media totale (Programma / Settaggio)
-19% / -22%
-21% / -20%
13% / 10%

* ... Meglio usare valori piccoli

Tempi di risposta del Display

I tempi di risposta del display mostrano quanto sia veloce lo schermo a cambaire da un colore all'altro. Tempi di risposta lenti possono creare sovrapposizioni negloi oggetti in movimento. Specialmente i giocatori patiti del 3D dovrebbero usare uno schermo con tempi di risposta bassi.
       Tempi di risposta dal Nero al Bianco
26 ms ... aumenta ↗ e diminuisce ↘ combinato↗ 7 ms Incremento
↘ 19 ms Calo
Lo schermo mostra tempi di risposta relativamente lenti nei nostri tests e potrebbe essere troppo lento per i gamers.
In confronto, tutti i dispositivi di test variano da 0.1 (minimo) a 240 (massimo) ms. » 57 % di tutti i dispositivi è migliore.
Questo significa che i tempi di risposta rilevati sono peggiori rispetto alla media di tutti i dispositivi testati (21.5 ms).
       Tempo di risposta dal 50% Grigio all'80% Grigio
38 ms ... aumenta ↗ e diminuisce ↘ combinato↗ 15 ms Incremento
↘ 23 ms Calo
Lo schermo mostra tempi di risposta lenti nei nostri tests e sarà insoddisfacente per i gamers.
In confronto, tutti i dispositivi di test variano da 0.2 (minimo) a 636 (massimo) ms. » 49 % di tutti i dispositivi è migliore.
Questo significa che i tempi di risposta rilevati sono peggiori rispetto alla media di tutti i dispositivi testati (33.7 ms).

Sfarfallio dello schermo / PWM (Pulse-Width Modulation)

Per ridurre la luminosità dello schermo, alcuni portatili accendono e spengono la retroilluminazione in rapida successione - un metodo chiamato Pulse Width Modulation (PWM). Questa frequenza di ciclo a livello ideale non dovrebbe essere percepibile dall'occhi umano. Se tale frequenza è troppo bassa, gli utenti con occhi sensibili potrebbero stancarsi gli occhi o avere mal di testa o anche notare uno sfarfallio.
flickering dello schermo / PWM non rilevato

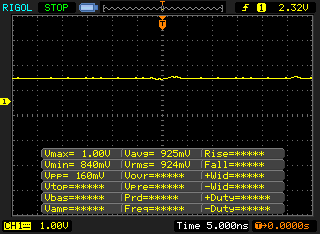
In confronto: 53 % di tutti i dispositivi testati non utilizza PWM per ridurre la luminosita' del display. Se è rilevato PWM, una media di 17924 (minimo: 5 - massimo: 3846000) Hz è stata rilevata.


Cinebench R15
CPU Single 64Bit
MSI WS60-6QJE316H11
Intel Xeon E3-1505M v5
158 Points 0%
Fujitsu Celsius H760
Intel Xeon E3-1505M v5
158 Points
Lenovo ThinkPad P50
Intel Xeon E3-1505M v5
157 Points -1%
HP ZBook Studio G3
Intel Core i7-6820HQ
149 Points -6%
Dell Precision 3510
Intel Core i7-6700HQ
144 Points -9%
CPU Multi 64Bit
Lenovo ThinkPad P50
Intel Xeon E3-1505M v5
729 Points +3%
Fujitsu Celsius H760
Intel Xeon E3-1505M v5
710 Points
HP ZBook Studio G3
Intel Core i7-6820HQ
706 Points -1%
MSI WS60-6QJE316H11
Intel Xeon E3-1505M v5
674 Points -5%
Dell Precision 3510
Intel Core i7-6700HQ
601 Points -15%
Cinebench R11.5
CPU Single 64Bit
Fujitsu Celsius H760
Intel Xeon E3-1505M v5
1.79 Points
MSI WS60-6QJE316H11
Intel Xeon E3-1505M v5
1.78 Points -1%
Lenovo ThinkPad P50
Intel Xeon E3-1505M v5
1.78 Points -1%
HP ZBook Studio G3
Intel Core i7-6820HQ
1.74 Points -3%
Dell Precision 3510
Intel Core i7-6700HQ
1.69 Points -6%
CPU Multi 64Bit
Lenovo ThinkPad P50
Intel Xeon E3-1505M v5
7.99 Points +3%
Fujitsu Celsius H760
Intel Xeon E3-1505M v5
7.73 Points
HP ZBook Studio G3
Intel Core i7-6820HQ
7.7 Points 0%
MSI WS60-6QJE316H11
Intel Xeon E3-1505M v5
7.42 Points -4%
Dell Precision 3510
Intel Core i7-6700HQ
6.79 Points -12%
Cinebench R11.5 OpenGL 64Bit
94.5 fps
Cinebench R11.5 CPU Multi 64Bit
7.73 Points
Cinebench R11.5 CPU Single 64Bit
1.79 Points
Cinebench R15 OpenGL 64Bit
114 fps
Cinebench R15 Ref. Match 64Bit
99.6 %
Cinebench R15 CPU Multi 64Bit
710 Points
Cinebench R15 CPU Single 64Bit
158 Points
Aiuto
PCMark 8
Home Score Accelerated v2
Fujitsu Celsius H760
4028 Points
Lenovo ThinkPad P50
4023 Points 0%
Dell Precision 7510 (4K IGZO)
4020 Points 0%
HP ZBook 15 G3
3959 Points -2%
Creative Score Accelerated v2
Dell Precision 7510 (4K IGZO)
5537 Points +27%
HP ZBook 15 G3
4392 Points +1%
Fujitsu Celsius H760
4345 Points
Lenovo ThinkPad P50
4291 Points -1%
Work Score Accelerated v2
Fujitsu Celsius H760
5301 Points
HP ZBook 15 G3
5221 Points -2%
Lenovo ThinkPad P50
4372 Points -18%
Dell Precision 7510 (4K IGZO)
4246 Points -20%

Legenda

 
Fujitsu Celsius H760 Intel Xeon E3-1505M v5, NVIDIA Quadro M2000M, Samsung SM951 MZVPV512 m.2 PCI-e
 
HP ZBook 15 G3 Intel Xeon E3-1505M v5, NVIDIA Quadro M2000M, Samsung SM951 MZVPV512HDGL m.2 PCI-e
 
Lenovo ThinkPad P50 Intel Xeon E3-1505M v5, NVIDIA Quadro M2000M, Samsung SM951 MZVPV256HDGL m.2 PCI-e
 
Dell Precision 7510 (4K IGZO) Intel Xeon E3-1535M v5, NVIDIA Quadro M2000M, Samsung SSD SM951a 512GB M.2 PCIe 3.0 x4 NVMe (MZVKV512)
Fujitsu Celsius H760
Samsung SM951 MZVPV512 m.2 PCI-e
Dell Precision 7510 (4K IGZO)
Samsung SSD SM951a 512GB M.2 PCIe 3.0 x4 NVMe (MZVKV512)
Lenovo ThinkPad P50
Samsung SSD PM871 MZNLN256HCHP
HP ZBook Studio G3
Samsung SM951 MZVPV512HDGL m.2 PCI-e
Dell Precision 5510
SK hynix SC920 512 GB
MSI WS60 6QJ-535VPL
2x Plextor PX512M6GV-2280 (RAID 0)
AS SSD
3%
-69%
-10%
-515%
-48%
Copy Game MB/s
978
1045
7%
206.7
-79%
1104
13%
349
-64%
Copy Program MB/s
571
480.1
-16%
171.3
-70%
593
4%
221
-61%
Copy ISO MB/s
1325
1391
5%
269.3
-80%
1280
-3%
387
-71%
Access Time Read *
0.036
0.036
-0%
0.058
-61%
0.046
-28%
0.111
-208%
0.054
-50%
Access Time Write *
0.018
0.025
-39%
0.038
-111%
0.025
-39%
0.74
-4011%
0.041
-128%
4K-64 Read
801
1067
33%
381.2
-52%
1050
31%
327
-59%
437.1
-45%
4K-64 Write
285
375.7
32%
258.3
-9%
230.6
-19%
257
-10%
375.8
32%
Seq Read
1916
1953
2%
515
-73%
1713
-11%
474
-75%
880
-54%
Seq Write
1492
1484
-1%
272.8
-82%
947
-37%
389
-74%
821
-45%

* ... Meglio usare valori piccoli

Samsung SM951 MZVPV512 m.2 PCI-e
Sequential Read: 1916MB/s
Sequential Write: 1492MB/s
4K Read: 34MB/s
4K Write: 188MB/s
4K-64 Read: 801MB/s
4K-64 Write: 285MB/s
Access Time Read: 0.036ms
Access Time Write: 0.018ms
Copy ISO: 1325MB/s
Copy Program: 571MB/s
Copy Game: 978MB/s
Score Read: 1048Points
Score Write: 623Points
Score Total: 2201Points
SPECviewperf 12
1900x1060 Solidworks (sw-03)
HP ZBook 17 G3 TZV66eA
84.8 fps +16%
Lenovo ThinkPad P50
74.7 fps +2%
Dell Precision 7710
73 fps 0%
Fujitsu Celsius H760
73 fps
Dell Precision 7510 (4K IGZO)
68.7 fps -6%
HP ZBook 15 G3
66 fps -10%
Dell Precision 3510
32 fps -56%
HP ZBook 15u G3
31.41 fps -57%
1900x1060 Siemens NX (snx-02)
HP ZBook 17 G3 TZV66eA
65.8 fps +96%
Dell Precision 7710
63 fps +88%
HP ZBook 15 G3
35.87 fps +7%
Fujitsu Celsius H760
33.6 fps
Lenovo ThinkPad P50
32.86 fps -2%
Dell Precision 7510 (4K IGZO)
32.41 fps -4%
Dell Precision 3510
26 fps -23%
HP ZBook 15u G3
19.89 fps -41%
1900x1060 Showcase (showcase-01)
HP ZBook 17 G3 TZV66eA
43.81 fps +95%
Dell Precision 7710
37 fps +64%
HP ZBook 15 G3
23.86 fps +6%
Fujitsu Celsius H760
22.5 fps
Dell Precision 7510 (4K IGZO)
21.15 fps -6%
Lenovo ThinkPad P50
20.58 fps -9%
Dell Precision 3510
14 fps -38%
HP ZBook 15u G3
4.98 fps -78%
1900x1060 Medical (medical-01)
Dell Precision 7710
27 fps +84%
HP ZBook 17 G3 TZV66eA
22.34 fps +52%
Dell Precision 7510 (4K IGZO)
18.19 fps +24%
HP ZBook 15 G3
15.03 fps +2%
Fujitsu Celsius H760
14.7 fps
Lenovo ThinkPad P50
14.43 fps -2%
HP ZBook 15u G3
6.09 fps -59%
Dell Precision 3510
5.9 fps -60%
1900x1060 Maya (maya-04)
HP ZBook 17 G3 TZV66eA
50.4 fps +42%
Dell Precision 7710
46 fps +30%
Lenovo ThinkPad P50
37.15 fps +5%
HP ZBook 15 G3
35.94 fps +1%
Dell Precision 7510 (4K IGZO)
35.55 fps 0%
Fujitsu Celsius H760
35.5 fps
Dell Precision 3510
22 fps -38%
HP ZBook 15u G3
16.38 fps -54%
1900x1060 Energy (energy-01)
HP ZBook 17 G3 TZV66eA
4.85 fps +52%
Dell Precision 7510 (4K IGZO)
3.98 fps +25%
HP ZBook 15 G3
3.29 fps +3%
Fujitsu Celsius H760
3.19 fps
Dell Precision 7710
3.17 fps -1%
Lenovo ThinkPad P50
3.13 fps -2%
HP ZBook 15u G3
0.41 fps -87%
Dell Precision 3510
0.38 fps -88%
1900x1060 Creo (creo-01)
HP ZBook 17 G3 TZV66eA
64.8 fps +62%
Dell Precision 7710
50 fps +25%
Dell Precision 7510 (4K IGZO)
45 fps +13%
HP ZBook 15 G3
40.61 fps +2%
Fujitsu Celsius H760
40 fps
Lenovo ThinkPad P50
39.39 fps -2%
Dell Precision 3510
20 fps -50%
HP ZBook 15u G3
16.87 fps -58%
1900x1060 Catia (catia-04)
HP ZBook 17 G3 TZV66eA
77.9 fps +66%
Dell Precision 7710
58 fps +23%
HP ZBook 15 G3
47.08 fps 0%
Fujitsu Celsius H760
47 fps
Dell Precision 7510 (4K IGZO)
45.28 fps -4%
Lenovo ThinkPad P50
44.98 fps -4%
Dell Precision 3510
23 fps -51%
HP ZBook 15u G3
18.62 fps -60%
1900x1060 3ds Max (3dsmax-05)
Fujitsu Celsius H760
40 fps
SPECviewperf 11
1920x1080 Siemens NX
HP ZBook 17 G3 TZV66eA
49.91 fps +16%
Dell Precision 7710
49 fps +14%
Lenovo ThinkPad P50
43.29 fps +1%
HP ZBook 15 G3
43.17 fps 0%
Fujitsu Celsius H760
43 fps
Dell Precision 3510
30 fps -30%
1920x1080 Tcvis
HP ZBook 17 G3 TZV66eA
56.3 fps +28%
HP ZBook 15 G3
44.89 fps +2%
Fujitsu Celsius H760
44 fps
Lenovo ThinkPad P50
43.79 fps 0%
Dell Precision 7710
36 fps -18%
Dell Precision 3510
8 fps -82%
1920x1080 SolidWorks
Dell Precision 7710
74 fps +40%
Lenovo ThinkPad P50
53 fps 0%
Fujitsu Celsius H760
53 fps
HP ZBook 15 G3
48.13 fps -9%
HP ZBook 17 G3 TZV66eA
48.01 fps -9%
Dell Precision 3510
30 fps -43%
1920x1080 Pro/ENGINEER
Fujitsu Celsius H760
23 fps
HP ZBook 17 G3 TZV66eA
22.46 fps -2%
HP ZBook 15 G3
21.57 fps -6%
Lenovo ThinkPad P50
21.27 fps -8%
Dell Precision 7710
11.7 fps -49%
Dell Precision 3510
4.3 fps -81%
1920x1080 Maya
Dell Precision 7710
106 fps +83%
Fujitsu Celsius H760
58 fps
HP ZBook 17 G3 TZV66eA
57.8 fps 0%
HP ZBook 15 G3
57.7 fps -1%
Lenovo ThinkPad P50
57.3 fps -1%
Dell Precision 3510
21 fps -64%
1920x1080 Lightwave
Dell Precision 7710
84 fps +53%
Lenovo ThinkPad P50
56.4 fps +3%
Fujitsu Celsius H760
55 fps
HP ZBook 15 G3
52 fps -5%
HP ZBook 17 G3 TZV66eA
51.9 fps -6%
Dell Precision 3510
36 fps -35%
1920x1080 Ensight
Dell Precision 7710
70 fps +52%
HP ZBook 17 G3 TZV66eA
59.1 fps +28%
HP ZBook 15 G3
46.68 fps +1%
Fujitsu Celsius H760
46 fps
Lenovo ThinkPad P50
45.8 fps 0%
Dell Precision 3510
24 fps -48%
1920x1080 Catia
Dell Precision 7710
61 fps +9%
Fujitsu Celsius H760
56 fps
Lenovo ThinkPad P50
54.1 fps -3%
HP ZBook 15 G3
53.5 fps -4%
HP ZBook 17 G3 TZV66eA
53.4 fps -5%
Dell Precision 3510
13 fps -77%

Legenda

 
Fujitsu Celsius H760 Intel Xeon E3-1505M v5, NVIDIA Quadro M2000M, Samsung SM951 MZVPV512 m.2 PCI-e
 
Lenovo ThinkPad P50 Intel Xeon E3-1505M v5, NVIDIA Quadro M2000M, Samsung SM951 MZVPV256HDGL m.2 PCI-e
 
Dell Precision 7510 (4K IGZO) Intel Xeon E3-1535M v5, NVIDIA Quadro M2000M, Samsung SSD SM951a 512GB M.2 PCIe 3.0 x4 NVMe (MZVKV512)
 
HP ZBook 15 G3 Intel Xeon E3-1505M v5, NVIDIA Quadro M2000M, Samsung SM951 MZVPV512HDGL m.2 PCI-e
 
Dell Precision 3510 Intel Core i7-6700HQ, AMD FirePro W5130M, Samsung SM951 MZVPV256HDGL m.2 PCI-e
 
HP ZBook 15u G3 Intel Core i7-6600U, AMD FirePro W4190M, Samsung SM951 MZVPV256HDGL m.2 PCI-e
 
HP ZBook 17 G3 TZV66eA Intel Xeon E3-1535M v5, NVIDIA Quadro M3000M, Samsung SM951 MZVPV256HDGL m.2 PCI-e
 
Dell Precision 7710 Intel Xeon E3-1535M v5, AMD FirePro W7170M, Samsung SM951 MZVPV256HDGL m.2 PCI-e
3DMark
1280x720 Cloud Gate Standard Graphics
Lenovo ThinkPad P50
NVIDIA Quadro M2000M, Intel Core i7-6820HQ
30495 Points +1%
Fujitsu Celsius H760
NVIDIA Quadro M2000M, Intel Xeon E3-1505M v5
30255 Points
HP ZBook 15 G3
NVIDIA Quadro M2000M, Intel Xeon E3-1505M v5
30236 Points 0%
Dell Precision 7510 (4K IGZO)
NVIDIA Quadro M2000M, Intel Xeon E3-1535M v5
26869 Points -11%
1920x1080 Fire Strike Graphics
Dell Precision 7510 (4K IGZO)
NVIDIA Quadro M2000M, Intel Xeon E3-1535M v5
4193 Points +3%
Lenovo ThinkPad P50
NVIDIA Quadro M2000M, Intel Core i7-6820HQ
4126 Points +2%
HP ZBook 15 G3
NVIDIA Quadro M2000M, Intel Xeon E3-1505M v5
4091 Points +1%
Fujitsu Celsius H760
NVIDIA Quadro M2000M, Intel Xeon E3-1505M v5
4053 Points
LuxMark v2.0 64Bit
Sala GPUs-only
HP ZBook 15 G3
NVIDIA Quadro M2000M, Intel Xeon E3-1505M v5
1556 Samples/s +62%
Lenovo ThinkPad P50
NVIDIA Quadro M2000M, Intel Core i7-6820HQ
1426 Samples/s +48%
Fujitsu Celsius H760
NVIDIA Quadro M2000M, Intel Xeon E3-1505M v5
961 Samples/s
Room GPUs-only
HP ZBook 15 G3
NVIDIA Quadro M2000M, Intel Xeon E3-1505M v5
930 Samples/s +49%
Lenovo ThinkPad P50
NVIDIA Quadro M2000M, Intel Core i7-6820HQ
791 Samples/s +26%
Fujitsu Celsius H760
NVIDIA Quadro M2000M, Intel Xeon E3-1505M v5
626 Samples/s
Cinebench R11.5 - OpenGL 64Bit
Fujitsu Celsius H760
NVIDIA Quadro M2000M, Intel Xeon E3-1505M v5
94.5 fps
HP ZBook 15 G3
NVIDIA Quadro M2000M, Intel Xeon E3-1505M v5
94 fps -1%
Dell Precision 7510 (4K IGZO)
NVIDIA Quadro M2000M, Intel Xeon E3-1535M v5
93.5 fps -1%
Lenovo ThinkPad P50
NVIDIA Quadro M2000M, Intel Core i7-6820HQ
43.32 fps -54%
3DMark Ice Storm Standard Score
90607 punti
3DMark Cloud Gate Standard Score
18192 punti
3DMark Fire Strike Score
3794 punti
Aiuto
basso medio alto ultra
Metro: Last Light (2013) 118.9 94.8 55.3 29.5
Dirt Rally (2015) 272 136 76 33
The Witcher 3 (2015) 68 49 22 15

Rumorosità

Idle
29 / 29 / 29 dB(A)
HDD
29 dB(A)
Sotto carico
43.1 / 49.2 dB(A)
  red to green bar
 
 
30 dB
silenzioso
40 dB(A)
udibile
50 dB(A)
rumoroso
 
min: dark, med: mid, max: light   Audix TM1 Arta (15 cm di distanza)   Rumorosità ambientale: 29 dB(A)
Carico massimo
 25.3 °C30.1 °C38.5 °C 
 26.8 °C32.5 °C35.1 °C 
 23.7 °C26.2 °C24.6 °C 
Massima: 38.5 °C
Media: 29.2 °C
29.3 °C42.8 °C27.1 °C
36.9 °C35.4 °C25.7 °C
25.3 °C31.4 °C24.2 °C
Massima: 42.8 °C
Media: 30.9 °C
Alimentazione (max)  45.9 °C | Temperatura della stanza 20 °C | Fennel FIRT 550-Pocket
(+) La temperatura media del lato superiore sotto carico massimo e' di 29.2 °C / 85 F, rispetto alla media di 32 °C / 90 F per i dispositivi di questa classe Workstation.
(+) La temperatura massima sul lato superiore è di 38.5 °C / 101 F, rispetto alla media di 38.1 °C / 101 F, che varia da 22.2 a 69.8 °C per questa classe Workstation.
(±) Il lato inferiore si riscalda fino ad un massimo di 42.8 °C / 109 F, rispetto alla media di 41.3 °C / 106 F
(+) In idle, la temperatura media del lato superiore è di 30 °C / 86 F, rispetto alla media deld ispositivo di 32 °C / 90 F.
(+) I poggiapolsi e il touchpad raggiungono la temperatura massima della pelle (32.1 °C / 89.8 F) e quindi non sono caldi.
(-) La temperatura media della zona del palmo della mano di dispositivi simili e'stata di 27.8 °C / 82 F (-4.3 °C / -7.8 F).
Consumo di corrente
Off / Standbydarklight 0.3 / 0.4 Watt
Idledarkmidlight 7.7 / 11.8 / 12.9 Watt
Sotto carico midlight 90.2 / 130.8 Watt
 color bar
Leggenda: min: dark, med: mid, max: light        Metrahit Energy
Attualmente utilizziamo il Metrahit Energy, un multimetro digitale professionale per la misurazione della qualità della potenza e dell'energia monofase, per le nostre misurazioni.
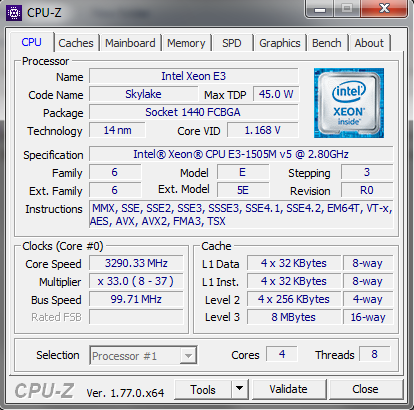
Fujitsu Celsius H760
E3-1505M v5, Quadro M2000M, Samsung SM951 MZVPV512 m.2 PCI-e, IPS LED, 1920x1080, 15.60
Dell Precision 7510 (4K IGZO)
E3-1535M v5, Quadro M2000M, Samsung SSD SM951a 512GB M.2 PCIe 3.0 x4 NVMe (MZVKV512), IGZO IPS, 3840x2160, 15.60
HP ZBook 15 G3
E3-1505M v5, Quadro M2000M, Samsung SM951 MZVPV512HDGL m.2 PCI-e, UWVA-IPS, 1920x1080, 15.60
Lenovo ThinkPad P50
6820HQ, Quadro M2000M, Samsung SSD PM871 MZNLN256HCHP, IPS, 1920x1080, 15.60
Dell Precision 3510
6700HQ, FirePro W5130M, Samsung SM951 MZVPV256HDGL m.2 PCI-e, TN LED, 1366x768, 15.60
Power Consumption
-103%
5%
21%
36%
Idle Minimum *
7.7
23.9
-210%
5.7
26%
5.6
27%
4.2
45%
Idle Average *
11.8
28.9
-145%
12.2
-3%
8.6
27%
6.5
45%
Idle Maximum *
12.9
30
-133%
12.6
2%
9.3
28%
7.1
45%
Load Average *
90.2
95.2
-6%
83.1
8%
89.5
1%
74.6
17%
Load Maximum *
130.8
157.1
-20%
138.2
-6%
105
20%
92.2
30%

* ... Meglio usare valori piccoli

Autonomia della batteria
Idle (senza WLAN, min luminosità)
9ore 17minuti
WiFi Websurfing
5ore 33minuti
Big Buck Bunny H.264 1080p
4ore 33minuti
Sotto carico (max luminosità)
1ore 46minuti
Fujitsu Celsius H760
E3-1505M v5, Quadro M2000M, 72 Wh
Dell Precision 7510 (4K IGZO)
E3-1535M v5, Quadro M2000M, 91 Wh
HP ZBook 15 G3
E3-1505M v5, Quadro M2000M, 90 Wh
Lenovo ThinkPad P50
6820HQ, Quadro M2000M, 90 Wh
Dell Precision 3510
6700HQ, FirePro W5130M, 84 Wh
Autonomia della batteria
-38%
33%
52%
79%
Reader / Idle
557
268
-52%
822
48%
860
54%
1168
110%
H.264
273
449
64%
533
95%
605
122%
WiFi v1.3
333
239
-28%
386
16%
498
50%
591
77%
Load
106
70
-34%
110
4%
113
7%
111
5%

Pro

+ stabilità del case
+ qualità di costruzione
+ Prestazioni CPU
+ Performance GPU
+ performance di sistema
+ stabilità delle prestazioni sotto sforzo
+ varietà di porte
+ possibilità di configurazione
+ bay modulare
+ opzioni di garanzia e supporto
+ accessori disponibili
+ emissioni

Contro

- riduzione delle performance con la sola batteria
- gamma del colore e precisione del display
- webcam e casse
- rumorosità con carico massimo

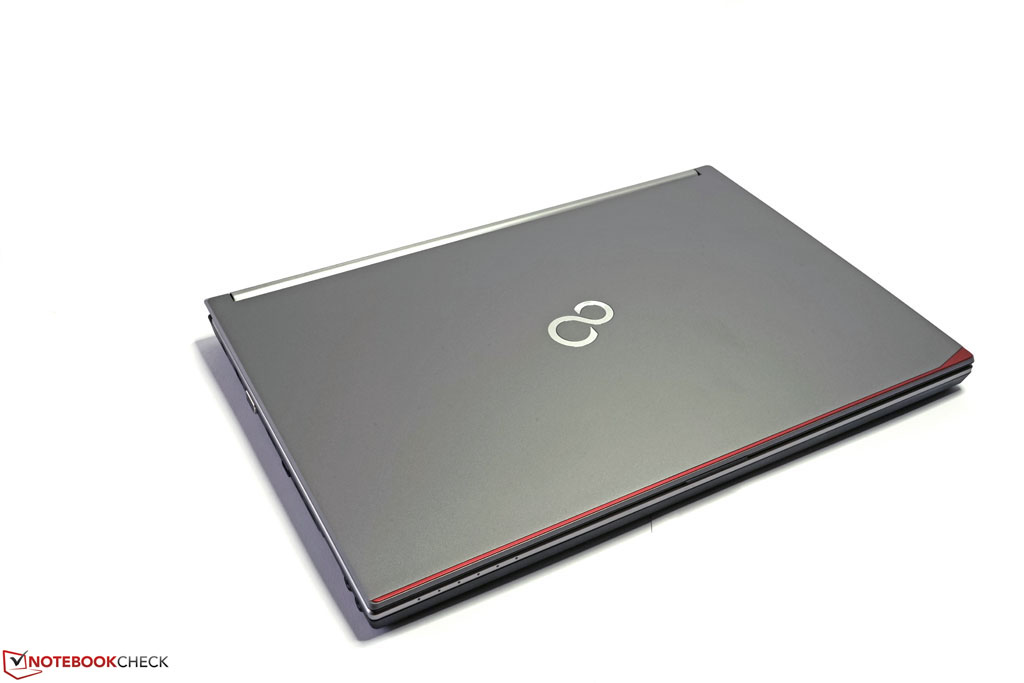
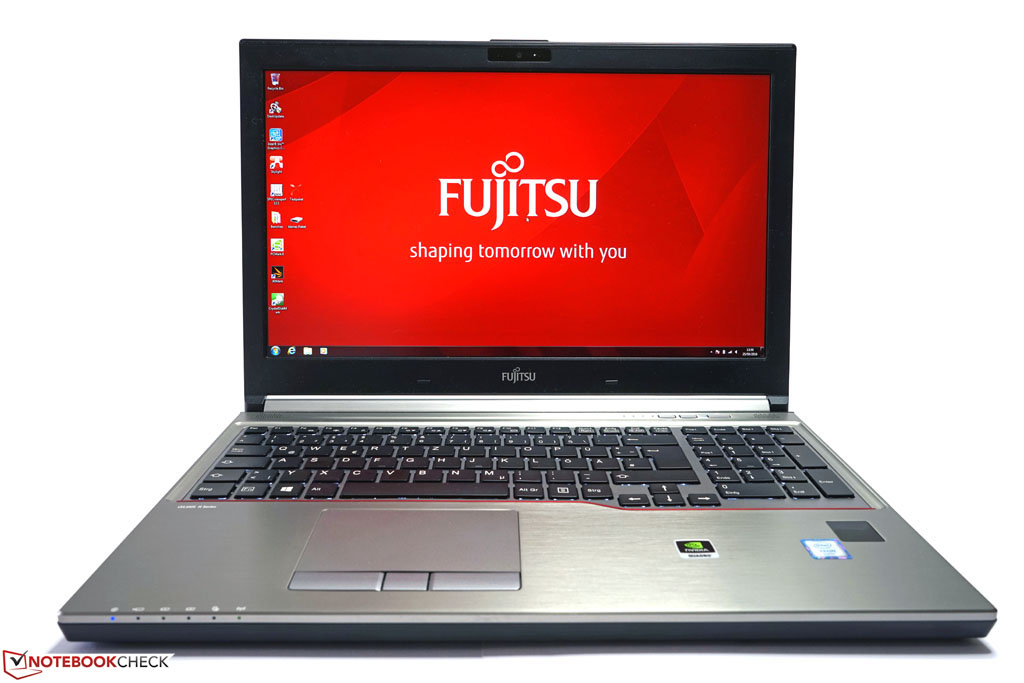
Il Fujitsu Celsius H760 è un netto sviluppo del precedente Celsius H740 e convince in quasi tutte le sezioni. Lo chassis è robusto, ben costruito e il design non sembra troppo male.

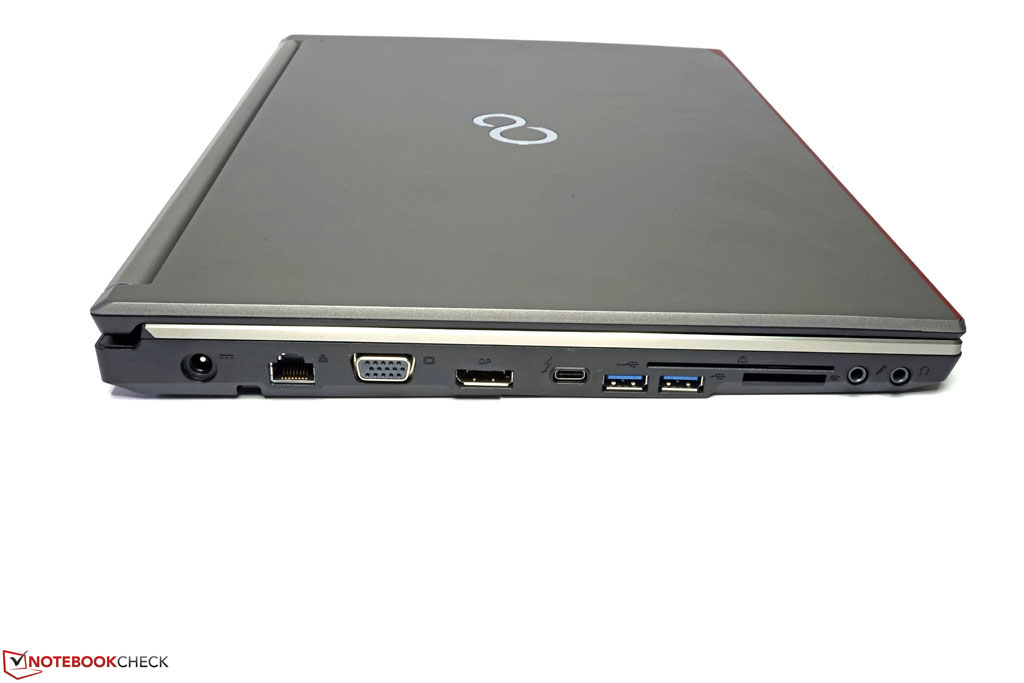
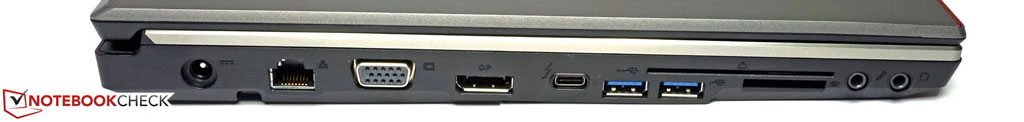
Sotto il cofano, ci piacciono le porte aggiornate, le configurazioni flessibili ed un adeguato livello di perfomance..

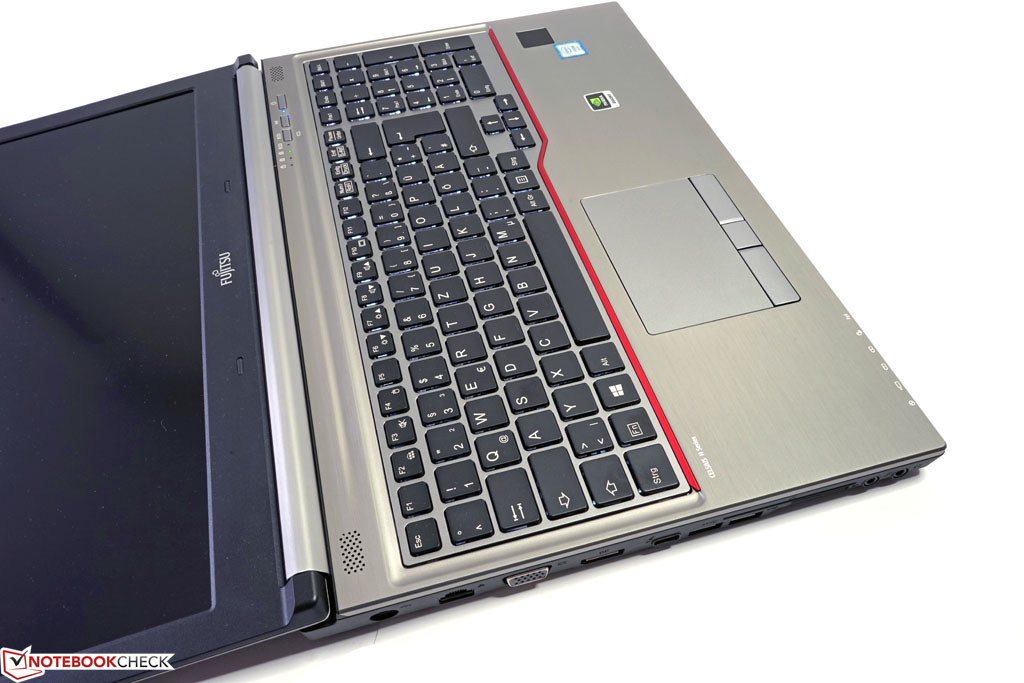
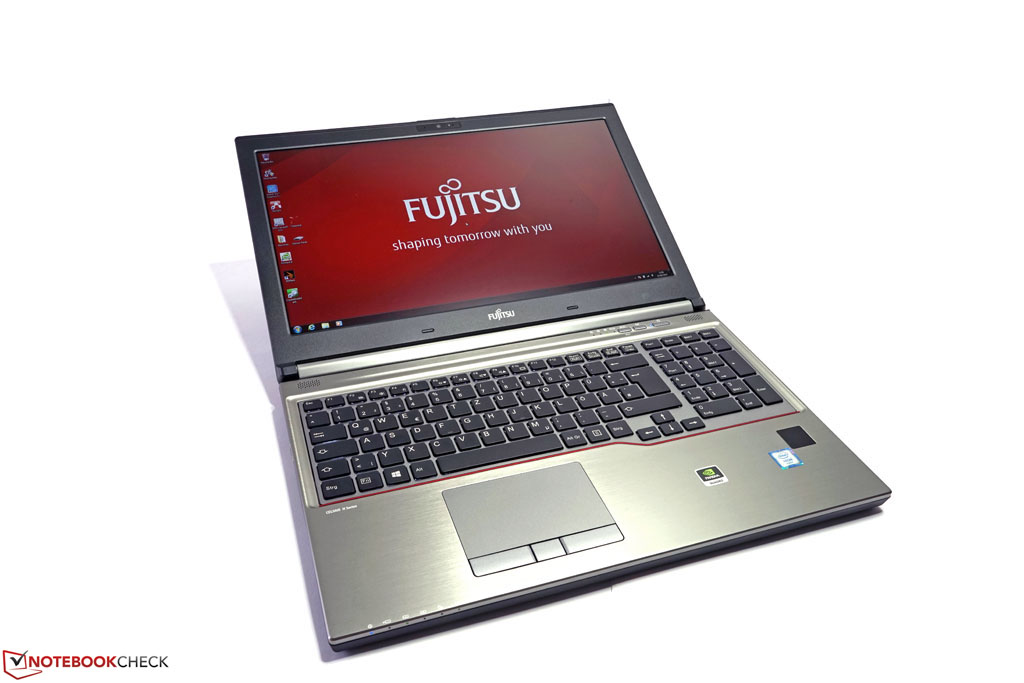
Naturalmente che, in questo esclusivo segmento workstation, non ci sia necessita di rinunciare alle tipiche funzioni di business con questo potente strumento è una questione implicita.  Un set completo di funzionalità di sicurezza, dispositivi di input buoni e optional di garanzia e servizi alternativi completano l'ottima impressione generale.

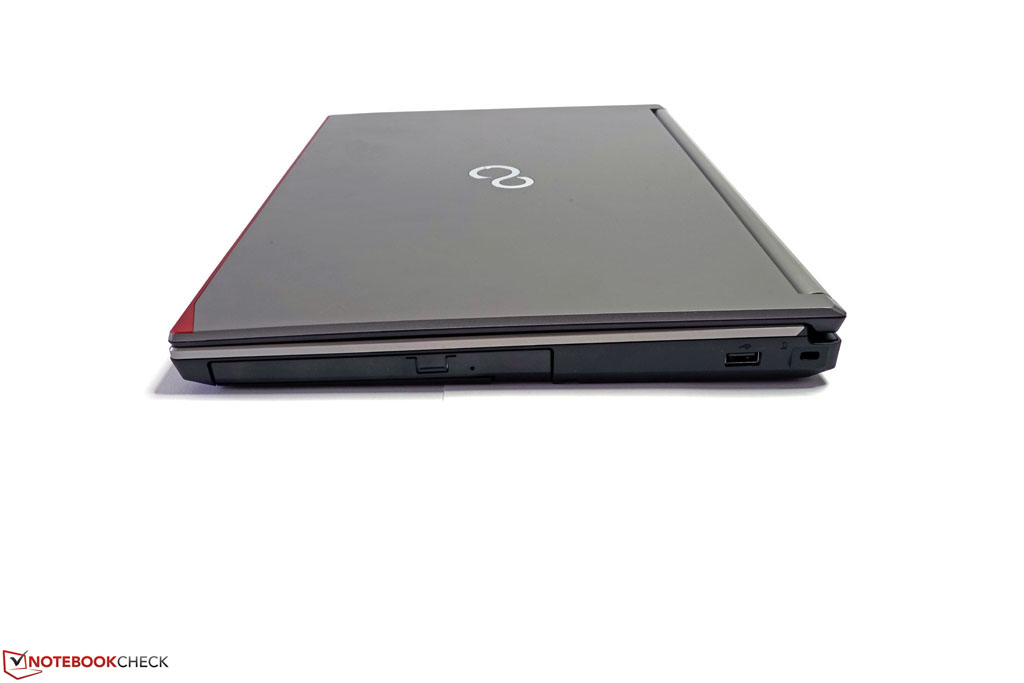
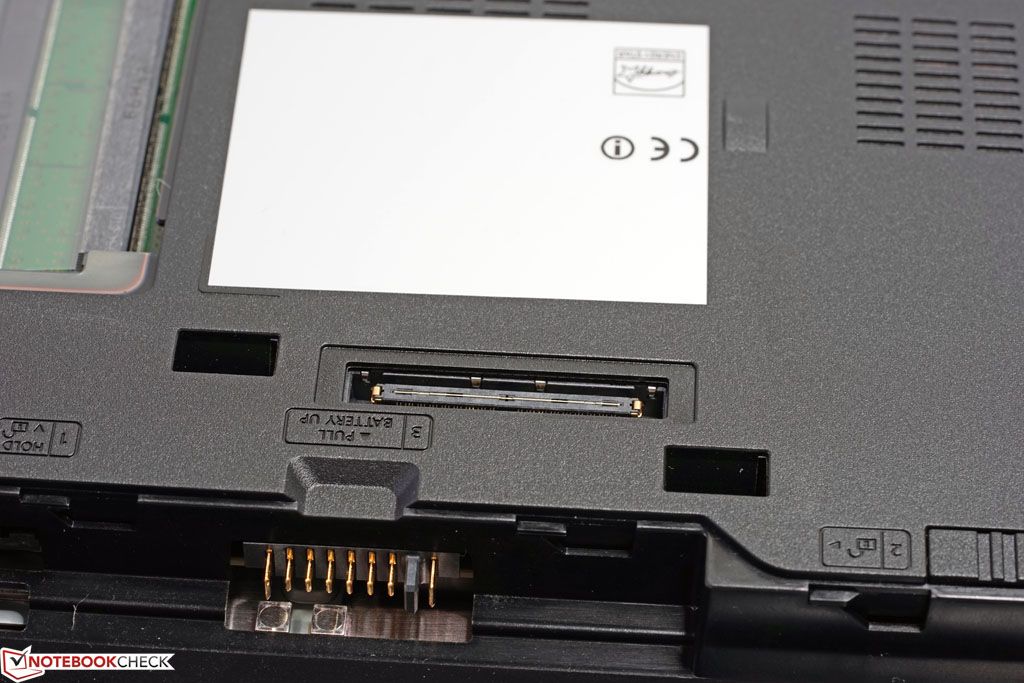
La piccola, ma comunque importante ciliegina sulla torta è lil bay modulare. Grazie ai moduli corrispondenti, si ottiene una maggiore flessibilità, che può fare la differenza importante rispetto ad alcuni dei concorrenti.

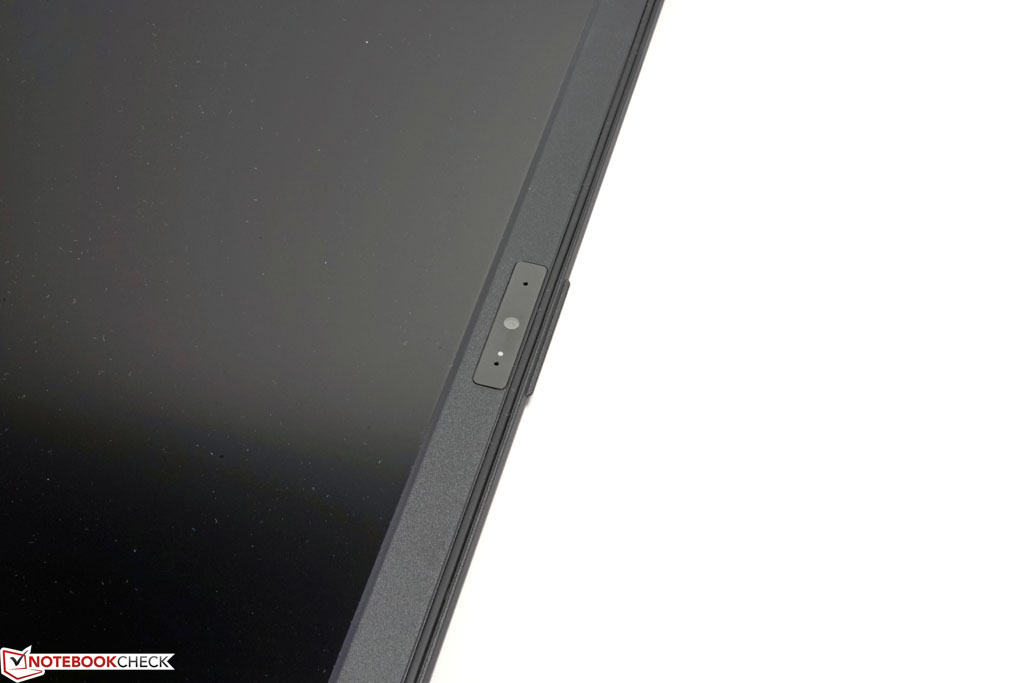
Mentre si potrebbe certamente vivere con la qualità media della webcam, l'alta rumorosità quando si trova sotto massimo sforzo e le perfomance throttling in modalità batteria oltre al display Full-HD saranno probabilmente il più grande problema. Si tratta di un buon display IPS con ampio angolo di visuale, ma in realtà non è adatto alla categoria di dispositivi costosi. La gamma di colore, la precisione dei colori e la griglia evidente, influiscono su di una buona perfomance e impediscono l'utilizzo in scenari professionali in cui è necessario avere colori accurati.

Tutto sommato, le workstation mobili Celsius H760 di Fujitsu sono una piacevole alternativa ai concorrenti simili, e può anche essere un attraente pacchetto valutato in base alla configurazione.

Nota: si tratta di una recensione breve, con alcune sezioni non tradotte, per la versione integrale in inglese guardate qui.

Fujitsu Celsius H760 - 10/12/2016 v5.1(old)
Tobias Winkler

Chassis
93 / 98 → 95%
Tastiera
97%
Dispositivo di puntamento
93%
Connettività
76 / 81 → 94%
Peso
57 / 10-66 → 84%
Batteria
81%
Display
87%
Prestazioni di gioco
86%
Prestazioni Applicazioni
93%
Temperatura
90 / 95 → 94%
Rumorosità
83 / 90 → 92%
Audio
63%
Fotocamera
21 / 85 → 25%
Media
78%
86%
Workstation - Media ponderata

Pricecompare

Please share our article, every link counts!
> Recensioni e prove di notebook, tablets e smartphones > Recensioni e prove > Recensioni e prove > Recensione breve dell Workstation Fujitsu Celsius H760
Tobias Winkler, 2016-10-26 (Update: 2016-10-26)