 Deutsch
 English
 Español
 Français
 Italiano
 Nederlands
 Polski
 Português
 Русский
 Türkçe
 Svenska
 Chinese
 Magyar
Recensione breve dell'Ultrabook Lenovo ThinkPad 13

Sfarfallio dello schermo / PWM (Pulse-Width Modulation)
| flickering dello schermo / PWM non rilevato | ||
In confronto: 53 % di tutti i dispositivi testati non utilizza PWM per ridurre la luminosita' del display. Se è rilevato PWM, una media di 17900 (minimo: 5 - massimo: 3846000) Hz è stata rilevata. | ||
| |||||||||||||||||||||||||
Distribuzione della luminosità: 86 %
Al centro con la batteria: 233 cd/m²
Contrasto: 1059:1 (Nero: 0.22 cd/m²)
ΔE Color 5.41 | 0.5-29.43 Ø5
ΔE Greyscale 4.15 | 0.57-98 Ø5.3
57.16% sRGB (Argyll 1.6.3 3D)
36.52% AdobeRGB 1998 (Argyll 1.6.3 3D)
39.66% AdobeRGB 1998 (Argyll 2.2.0 3D)
57.4% sRGB (Argyll 2.2.0 3D)
38.35% Display P3 (Argyll 2.2.0 3D)
Gamma: 2.45
| Lenovo ThinkPad 13-20GKS01100 1920x1080, LP133WF2-SPL1 | Lenovo ThinkPad T460-20FN003LGE IPS, 1920x1080, Lenovo LEN40A9 / N140HCE-EAA | Acer TravelMate P238-M-5575 TN LED, 1366x768, AU Optronics B133XTN01.6 | Asus Zenbook UX303UA-FN121T TN LED, 1366x768, BOE HF HB133WX1-402 | Acer Aspire S 13 S5-371-71QZ IPS, 1920x1080, AUO B133HAN04.1 | Dell XPS 13-9350 IPS, 1920x1080, SHP1420 | Lenovo ThinkPad T460s-20F9003SGE IPS, 1920x1080, N140HCE-EAA, LEN40A9 | |
|---|---|---|---|---|---|---|---|
| Display | 9% | -3% | 12% | 16% | 8% | ||
| Display P3 Coverage | 38.35 | 42.09 10% | 37.25 -3% | 43.08 12% | 44.53 16% | 41.65 9% | |
| sRGB Coverage | 57.4 | 62 8% | 56.1 -2% | 64.8 13% | 66.8 16% | 61.6 7% | |
| AdobeRGB 1998 Coverage | 39.66 | 43.6 10% | 38.49 -3% | 44.52 12% | 45.97 16% | 43.14 9% | |
| Response Times | 5% | -1% | 46% | -13% | -3% | ||
| Response Time Grey 50% / Grey 80% * | 43.2 ? | 42.4 ? 2% | 42 ? 3% | 23 ? 47% | 50 ? -16% | 42 ? 3% | |
| Response Time Black / White * | 26.8 ? | 24.8 ? 7% | 28 ? -4% | 15 ? 44% | 29.6 ? -10% | 29.2 ? -9% | |
| PWM Frequency | 192 ? | ||||||
| Screen | -16% | -64% | -4% | 20% | 14% | -8% | |
| Brightness middle | 233 | 230 -1% | 226 -3% | 203 -13% | 375 61% | 277.5 19% | 226 -3% |
| Brightness | 227 | 216 -5% | 216 -5% | 193 -15% | 358 58% | 276 22% | 211 -7% |
| Brightness Distribution | 86 | 85 -1% | 91 6% | 84 -2% | 87 1% | 88 2% | 89 3% |
| Black Level * | 0.22 | 0.26 -18% | 0.49 -123% | 0.49 -123% | 0.39 -77% | 0.191 13% | 0.22 -0% |
| Contrast | 1059 | 885 -16% | 461 -56% | 414 -61% | 962 -9% | 1453 37% | 1027 -3% |
| Colorchecker dE 2000 * | 5.41 | 7.32 -35% | 13.15 -143% | 3.2 41% | 4.6 15% | 4.88 10% | 6.44 -19% |
| Colorchecker dE 2000 max. * | 13.61 | 18.14 -33% | 21.96 -61% | 4.13 70% | 8.8 35% | 17.18 -26% | |
| Greyscale dE 2000 * | 4.15 | 6.98 -68% | 14.47 -249% | 2.77 33% | 4 4% | 4.26 -3% | 5.87 -41% |
| Gamma | 2.45 90% | 2.5 88% | 2.73 81% | 2.46 89% | 2.34 94% | 2.59 85% | 2.37 93% |
| CCT | 6773 96% | 6683 97% | 19989 33% | 7176 91% | 7304 89% | 6562 99% | 6856 95% |
| Color Space (Percent of AdobeRGB 1998) | 36.52 | 39.97 9% | 36 -1% | 41 12% | 57.9 59% | 41.6 14% | 39.58 8% |
| Color Space (Percent of sRGB) | 57.16 | 61.55 8% | 56 -2% | 65 14% | 88.7 55% | 65.79 15% | 61.15 7% |
| Media totale (Programma / Settaggio) | -1% /
-8% | -23% /
-43% | 18% /
6% | 4% /
15% | 15% /
15% | -1% /
-4% |
* ... Meglio usare valori piccoli
Tempi di risposta del Display
| ↔ Tempi di risposta dal Nero al Bianco | ||
|---|---|---|
| 26.8 ms ... aumenta ↗ e diminuisce ↘ combinato | ↗ 9.6 ms Incremento | |
| ↘ 17.2 ms Calo | ||
| Lo schermo mostra tempi di risposta relativamente lenti nei nostri tests e potrebbe essere troppo lento per i gamers. In confronto, tutti i dispositivi di test variano da 0.1 (minimo) a 240 (massimo) ms. » 62 % di tutti i dispositivi è migliore. Questo significa che i tempi di risposta rilevati sono peggiori rispetto alla media di tutti i dispositivi testati (21.5 ms). | ||
| ↔ Tempo di risposta dal 50% Grigio all'80% Grigio | ||
| 43.2 ms ... aumenta ↗ e diminuisce ↘ combinato | ↗ 19.6 ms Incremento | |
| ↘ 23.6 ms Calo | ||
| Lo schermo mostra tempi di risposta lenti nei nostri tests e sarà insoddisfacente per i gamers. In confronto, tutti i dispositivi di test variano da 0.2 (minimo) a 636 (massimo) ms. » 68 % di tutti i dispositivi è migliore. Questo significa che i tempi di risposta rilevati sono peggiori rispetto alla media di tutti i dispositivi testati (33.7 ms). | ||

| PCMark 8 Home Score Accelerated v2 | 3024 punti | |
| PCMark 8 Creative Score Accelerated v2 | 3651 punti | |
| PCMark 8 Work Score Accelerated v2 | 4041 punti | |
Aiuto | ||

| Lenovo ThinkPad 13-20GKS01100 Samsung SSD PM871 MZNLN256HCHP | Lenovo ThinkPad T460-20FN003LGE Toshiba HG6 THNSFJ256GCSU | Acer TravelMate P238-M-5575 Samsung SSD PM871 MZNLN256HCHP | Acer Aspire S 13 S5-371-71QZ LiteOn CV1-8B512 | Dell XPS 13-9350 Samsung PM951 NVMe MZ-VLV256D | Lenovo ThinkPad T460s-20F9003SGE Samsung CM871 MZ7LF192HCGS | |
|---|---|---|---|---|---|---|
| CrystalDiskMark 3.0 | -4% | 3% | 7% | 31% | -51% | |
| Write 4k QD32 | 276.2 | 216 -22% | 234.4 -15% | 211.2 -24% | 151.5 -45% | 36.43 -87% |
| Read 4k QD32 | 360.9 | 369.9 2% | 235.6 -35% | 301.3 -17% | 244.7 -32% | 94.9 -74% |
| Write 4k | 68.5 | 72.9 6% | 85.2 24% | 86.8 27% | 113 65% | 35.47 -48% |
| Read 4k | 31.85 | 21.7 -32% | 33.03 4% | 29.69 -7% | 38.52 21% | 5.78 -82% |
| Write 512 | 298.4 | 232.7 -22% | 305.1 2% | 389.7 31% | 308.6 3% | 167.2 -44% |
| Read 512 | 351.6 | 371.3 6% | 459.9 31% | 341.3 -3% | 684 95% | 259.2 -26% |
| Write Seq | 297.8 | 394.4 32% | 307.6 3% | 418.9 41% | 307.7 3% | 171.1 -43% |
| Read Seq | 461.7 | 458.9 -1% | 517 12% | 502 9% | 1097 138% | 446.5 -3% |
| 3DMark 06 Standard Score | 7597 punti | |
| 3DMark 11 Performance | 1372 punti | |
| 3DMark Cloud Gate Standard Score | 4922 punti | |
| 3DMark Fire Strike Score | 678 punti | |
Aiuto | ||
| basso | medio | alto | ultra | |
| Tomb Raider (2013) | 49.7 | 25.2 | 16.6 | |
| BioShock Infinite (2013) | 35.28 | 20.31 | 16.9 | |
| The Witcher 3 (2015) | 11.89 |
Rumorosità
| Idle |
| 29.1 / 29.1 / 29.1 dB(A) |
| Sotto carico |
| 31.5 / 33.5 dB(A) |
 | ||
30 dB silenzioso 40 dB(A) udibile 50 dB(A) rumoroso |
||
min: | ||
| Lenovo ThinkPad 13-20GKS01100 6200U, HD Graphics 520 | Lenovo ThinkPad T460-20FN003LGE 6200U, HD Graphics 520 | Acer TravelMate P238-M-5575 6200U, HD Graphics 520 | Asus Zenbook UX303UA-FN121T 6200U, HD Graphics 520 | Acer Aspire S 13 S5-371-71QZ 6500U, HD Graphics 520 | Dell XPS 13-9350 6200U, HD Graphics 520 | Lenovo ThinkPad T460s-20F9003SGE 6200U, HD Graphics 520 | |
|---|---|---|---|---|---|---|---|
| Noise | -4% | -9% | -8% | -8% | 4% | -2% | |
| off /ambiente * | 29.1 | 29 -0% | 31.2 -7% | 31.2 -7% | 29.1 -0% | ||
| Idle Minimum * | 29.1 | 29 -0% | 31.2 -7% | 32.6 -12% | 31.2 -7% | 28.2 3% | 29.1 -0% |
| Idle Average * | 29.1 | 29 -0% | 31.2 -7% | 32.7 -12% | 31.2 -7% | 28.3 3% | 29.1 -0% |
| Idle Maximum * | 29.1 | 29 -0% | 31.2 -7% | 32.7 -12% | 31.5 -8% | 28.4 2% | 29.1 -0% |
| Load Average * | 31.5 | 34.2 -9% | 35.71 -13% | 33.4 -6% | 35.7 -13% | 30.2 4% | 32.3 -3% |
| Load Maximum * | 33.5 | 37.8 -13% | 38.1 -14% | 33.4 -0% | 35.8 -7% | 30.2 10% | 36.6 -9% |
* ... Meglio usare valori piccoli
(±) La temperatura massima sul lato superiore è di 43.7 °C / 111 F, rispetto alla media di 34.2 °C / 94 F, che varia da 21.2 a 62.5 °C per questa classe Office.
(±) Il lato inferiore si riscalda fino ad un massimo di 44.2 °C / 112 F, rispetto alla media di 36.7 °C / 98 F
(+) In idle, la temperatura media del lato superiore è di 28.5 °C / 83 F, rispetto alla media deld ispositivo di 29.5 °C / 85 F.
(+) I poggiapolsi e il touchpad sono piu' freddi della temperatura della pelle con un massimo di 26.8 °C / 80.2 F e sono quindi freddi al tatto.
(±) La temperatura media della zona del palmo della mano di dispositivi simili e'stata di 27.7 °C / 81.9 F (+0.9 °C / 1.7 F).
| Lenovo ThinkPad 13-20GKS01100 6200U, HD Graphics 520 | Lenovo ThinkPad T460-20FN003LGE 6200U, HD Graphics 520 | Acer TravelMate P238-M-5575 6200U, HD Graphics 520 | Asus Zenbook UX303UA-FN121T 6200U, HD Graphics 520 | Acer Aspire S 13 S5-371-71QZ 6500U, HD Graphics 520 | Dell XPS 13-9350 6200U, HD Graphics 520 | Lenovo ThinkPad T460s-20F9003SGE 6200U, HD Graphics 520 | |
|---|---|---|---|---|---|---|---|
| Heat | 7% | 20% | 14% | 8% | 0% | 10% | |
| Maximum Upper Side * | 43.7 | 37.3 15% | 34.2 22% | 39.7 9% | 38.5 12% | 45.2 -3% | 41.4 5% |
| Maximum Bottom * | 44.2 | 44.3 -0% | 31 30% | 34.8 21% | 47.7 -8% | 45.2 -2% | 41 7% |
| Idle Upper Side * | 31.4 | 29 8% | 27.1 14% | 27.4 13% | 27.2 13% | 30.4 3% | 26.7 15% |
| Idle Bottom * | 32.1 | 30.1 6% | 27.7 14% | 27.7 14% | 27.4 15% | 31.2 3% | 27.8 13% |
* ... Meglio usare valori piccoli
| Off / Standby | |
| Idle | |
| Sotto carico |
|
Leggenda:
min: Attualmente utilizziamo il Metrahit Energy, un multimetro digitale professionale per la misurazione della qualità della potenza e dell'energia monofase, per le nostre misurazioni. | |
| Lenovo ThinkPad 13-20GKS01100 6200U, HD Graphics 520, 1920x1080 | Lenovo ThinkPad T460-20FN003LGE 6200U, HD Graphics 520, 1920x1080 | Acer TravelMate P238-M-5575 6200U, HD Graphics 520, 1366x768 | Asus Zenbook UX303UA-FN121T 6200U, HD Graphics 520, 1366x768 | Acer Aspire S 13 S5-371-71QZ 6500U, HD Graphics 520, 1920x1080 | Lenovo ThinkPad T460s-20F9003SGE 6200U, HD Graphics 520, 1920x1080 | |
|---|---|---|---|---|---|---|
| Power Consumption | -14% | -2% | -12% | -20% | -14% | |
| Idle Minimum * | 3.1 | 3.5 -13% | 3.2 -3% | 4.2 -35% | 4.1 -32% | 3.7 -19% |
| Idle Average * | 5.5 | 6.7 -22% | 5.5 -0% | 6.2 -13% | 6.7 -22% | 6.8 -24% |
| Idle Maximum * | 6 | 7.3 -22% | 6 -0% | 6.4 -7% | 7.4 -23% | 7.3 -22% |
| Load Average * | 25.8 | 28.2 -9% | 29.5 -14% | 29 -12% | 32.4 -26% | 26.3 -2% |
| Load Maximum * | 33.6 | 34.6 -3% | 30.9 8% | 31 8% | 32.4 4% | 34.6 -3% |
* ... Meglio usare valori piccoli
| Lenovo ThinkPad 13-20GKS01100 42 Wh | Lenovo ThinkPad T460-20FN003LGE 46 Wh | Acer TravelMate P238-M-5575 49.7 Wh | Asus Zenbook UX303UA-FN121T 50 Wh | Acer Aspire S 13 S5-371-71QZ 45 Wh | Dell XPS 13-9350 56 Wh | Lenovo ThinkPad T460s-20F9003SGE 49 Wh | |
|---|---|---|---|---|---|---|---|
| Autonomia della batteria | -6% | 33% | 17% | 4% | 7% | 2% | |
| Reader / Idle | 944 | 953 1% | 1290 37% | 1028 9% | 782 -17% | 915 -3% | |
| H.264 | 469 | 512 9% | 557 19% | 534 14% | |||
| WiFi v1.3 | 372 | 338 -9% | 608 63% | 436 17% | 472 27% | 451 21% | 395 6% |
| Load | 129 | 98 -24% | 147 14% | 99 -23% | 150 16% | 116 -10% |
Pro
Contro
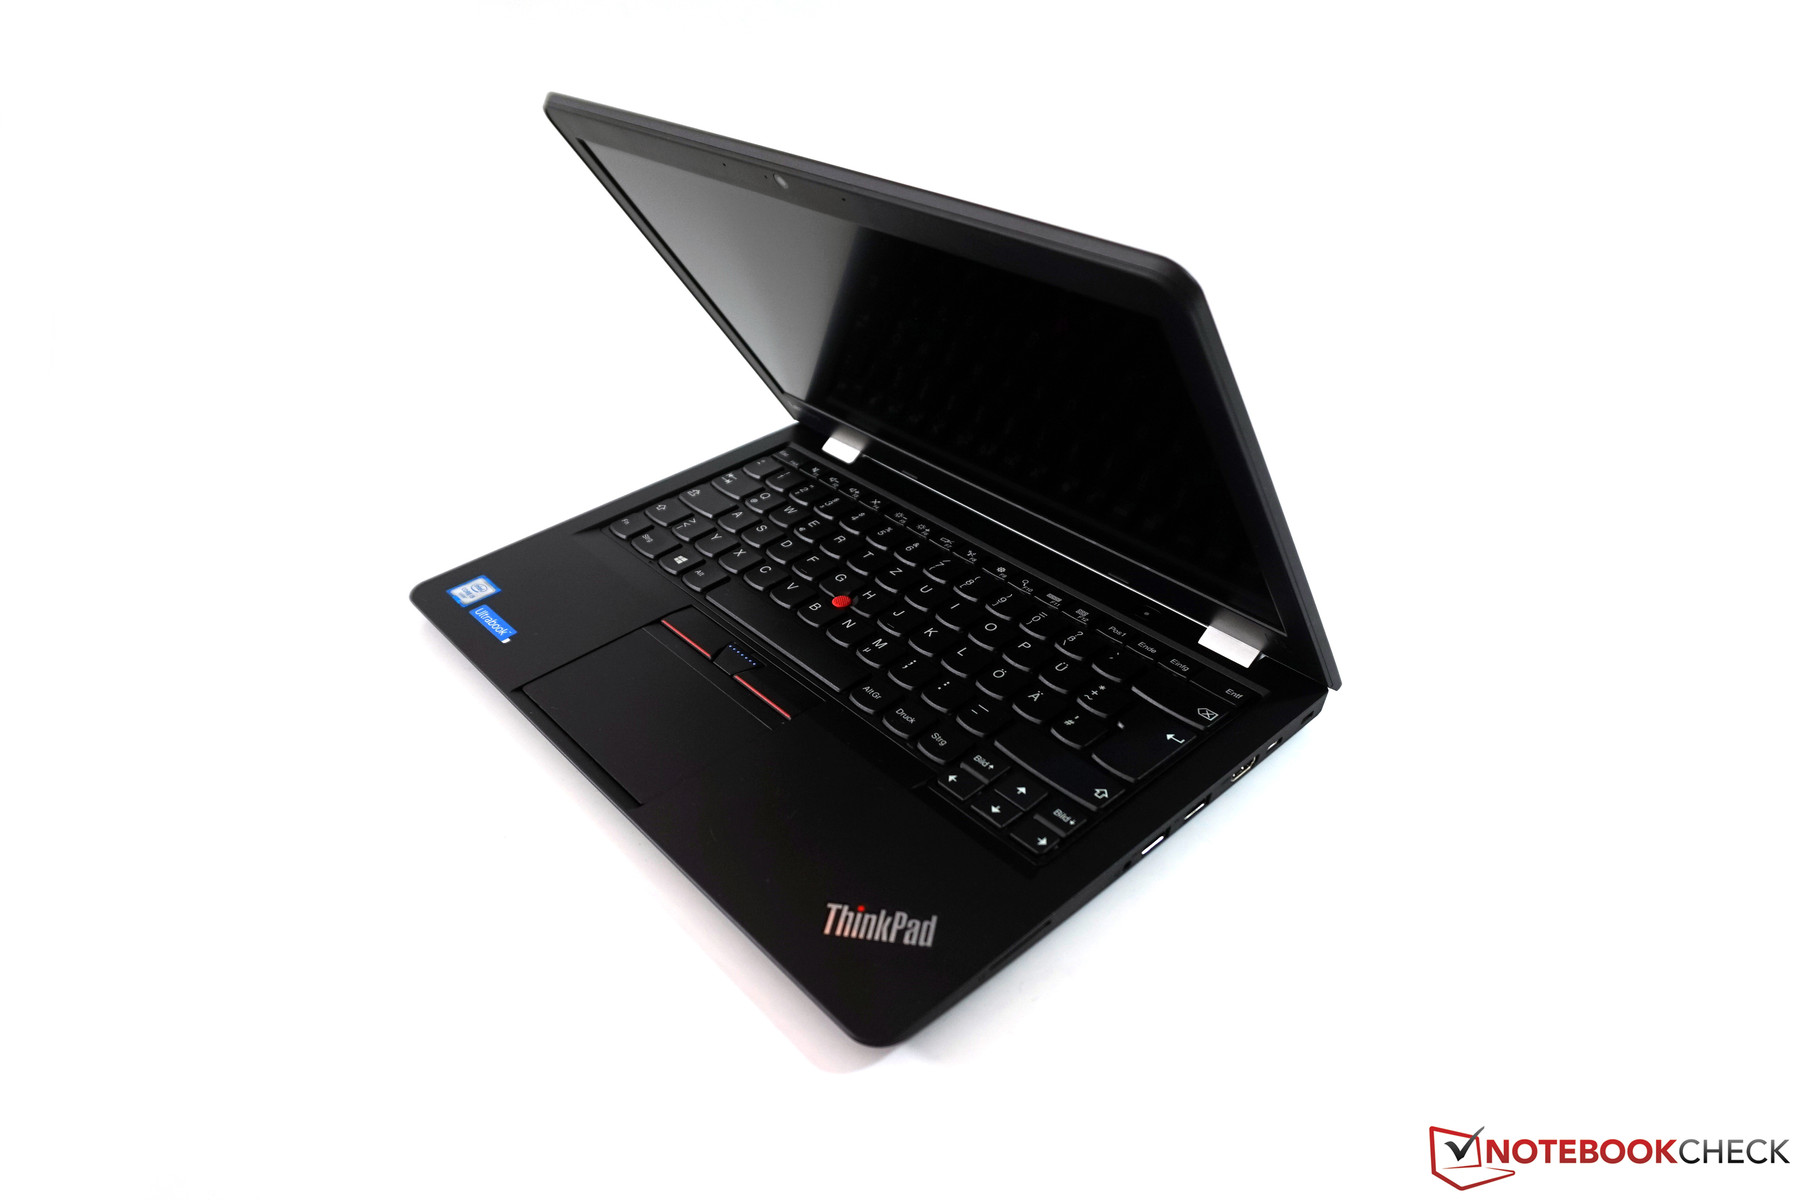
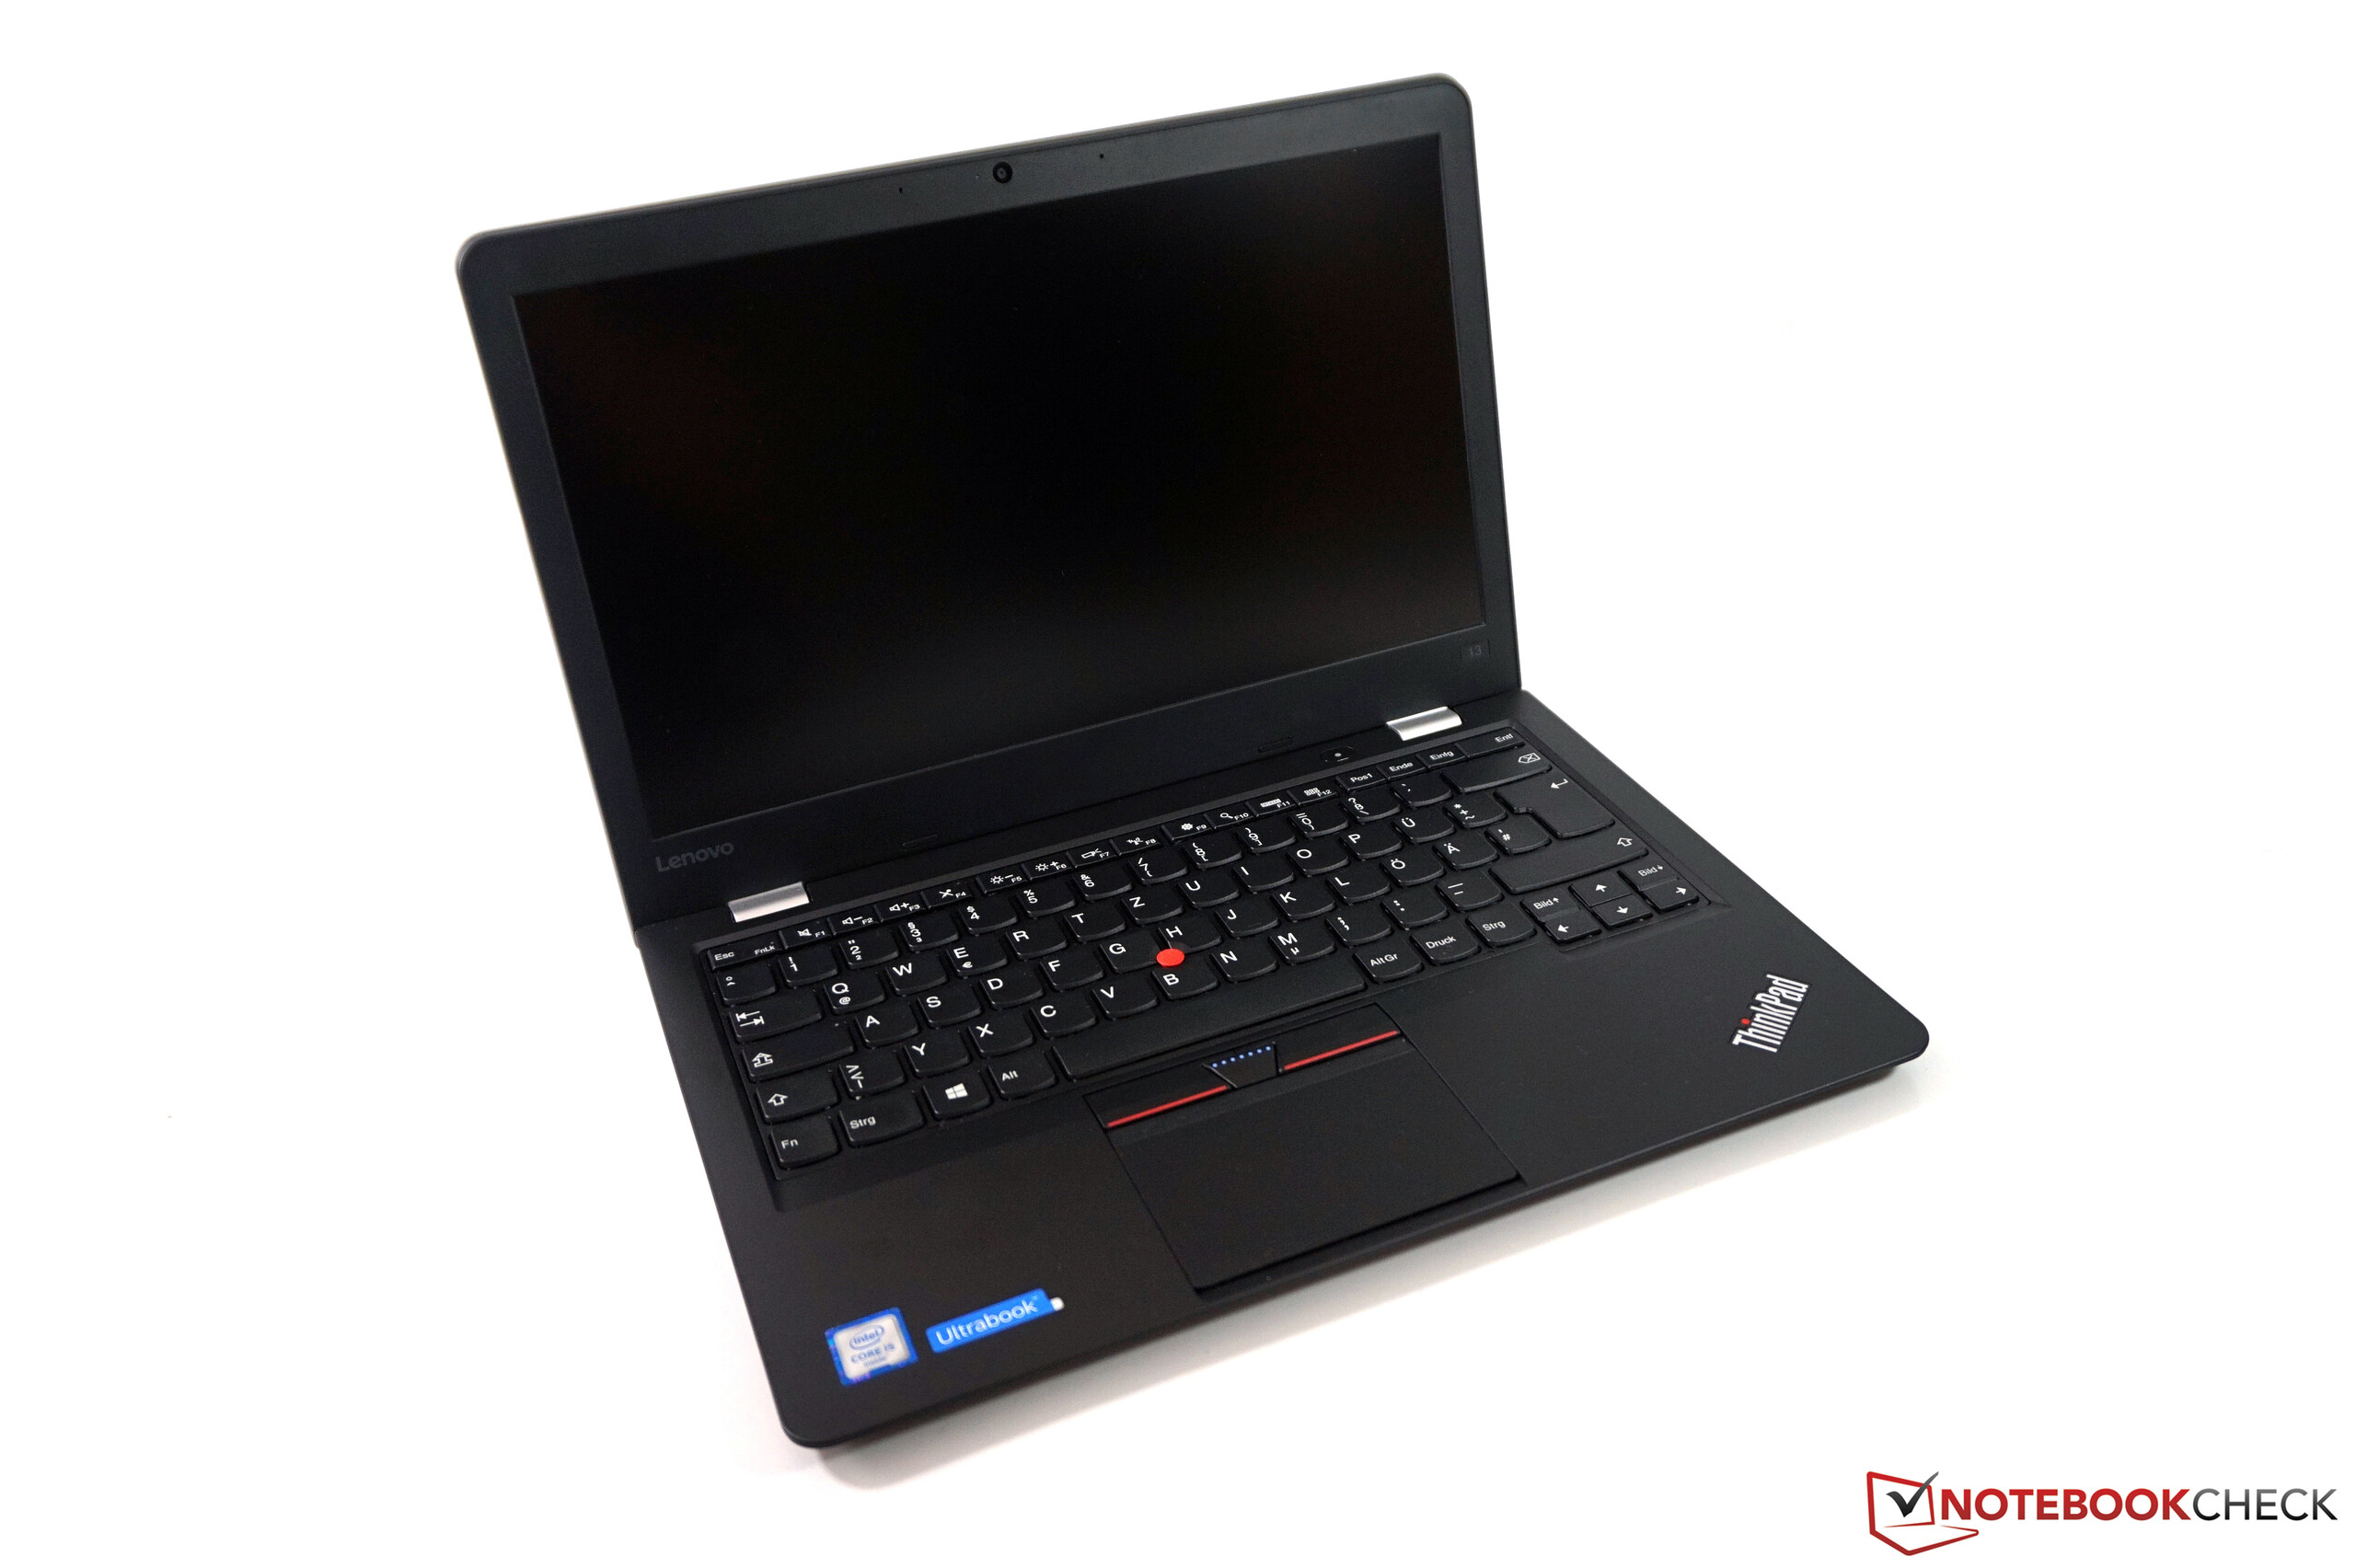
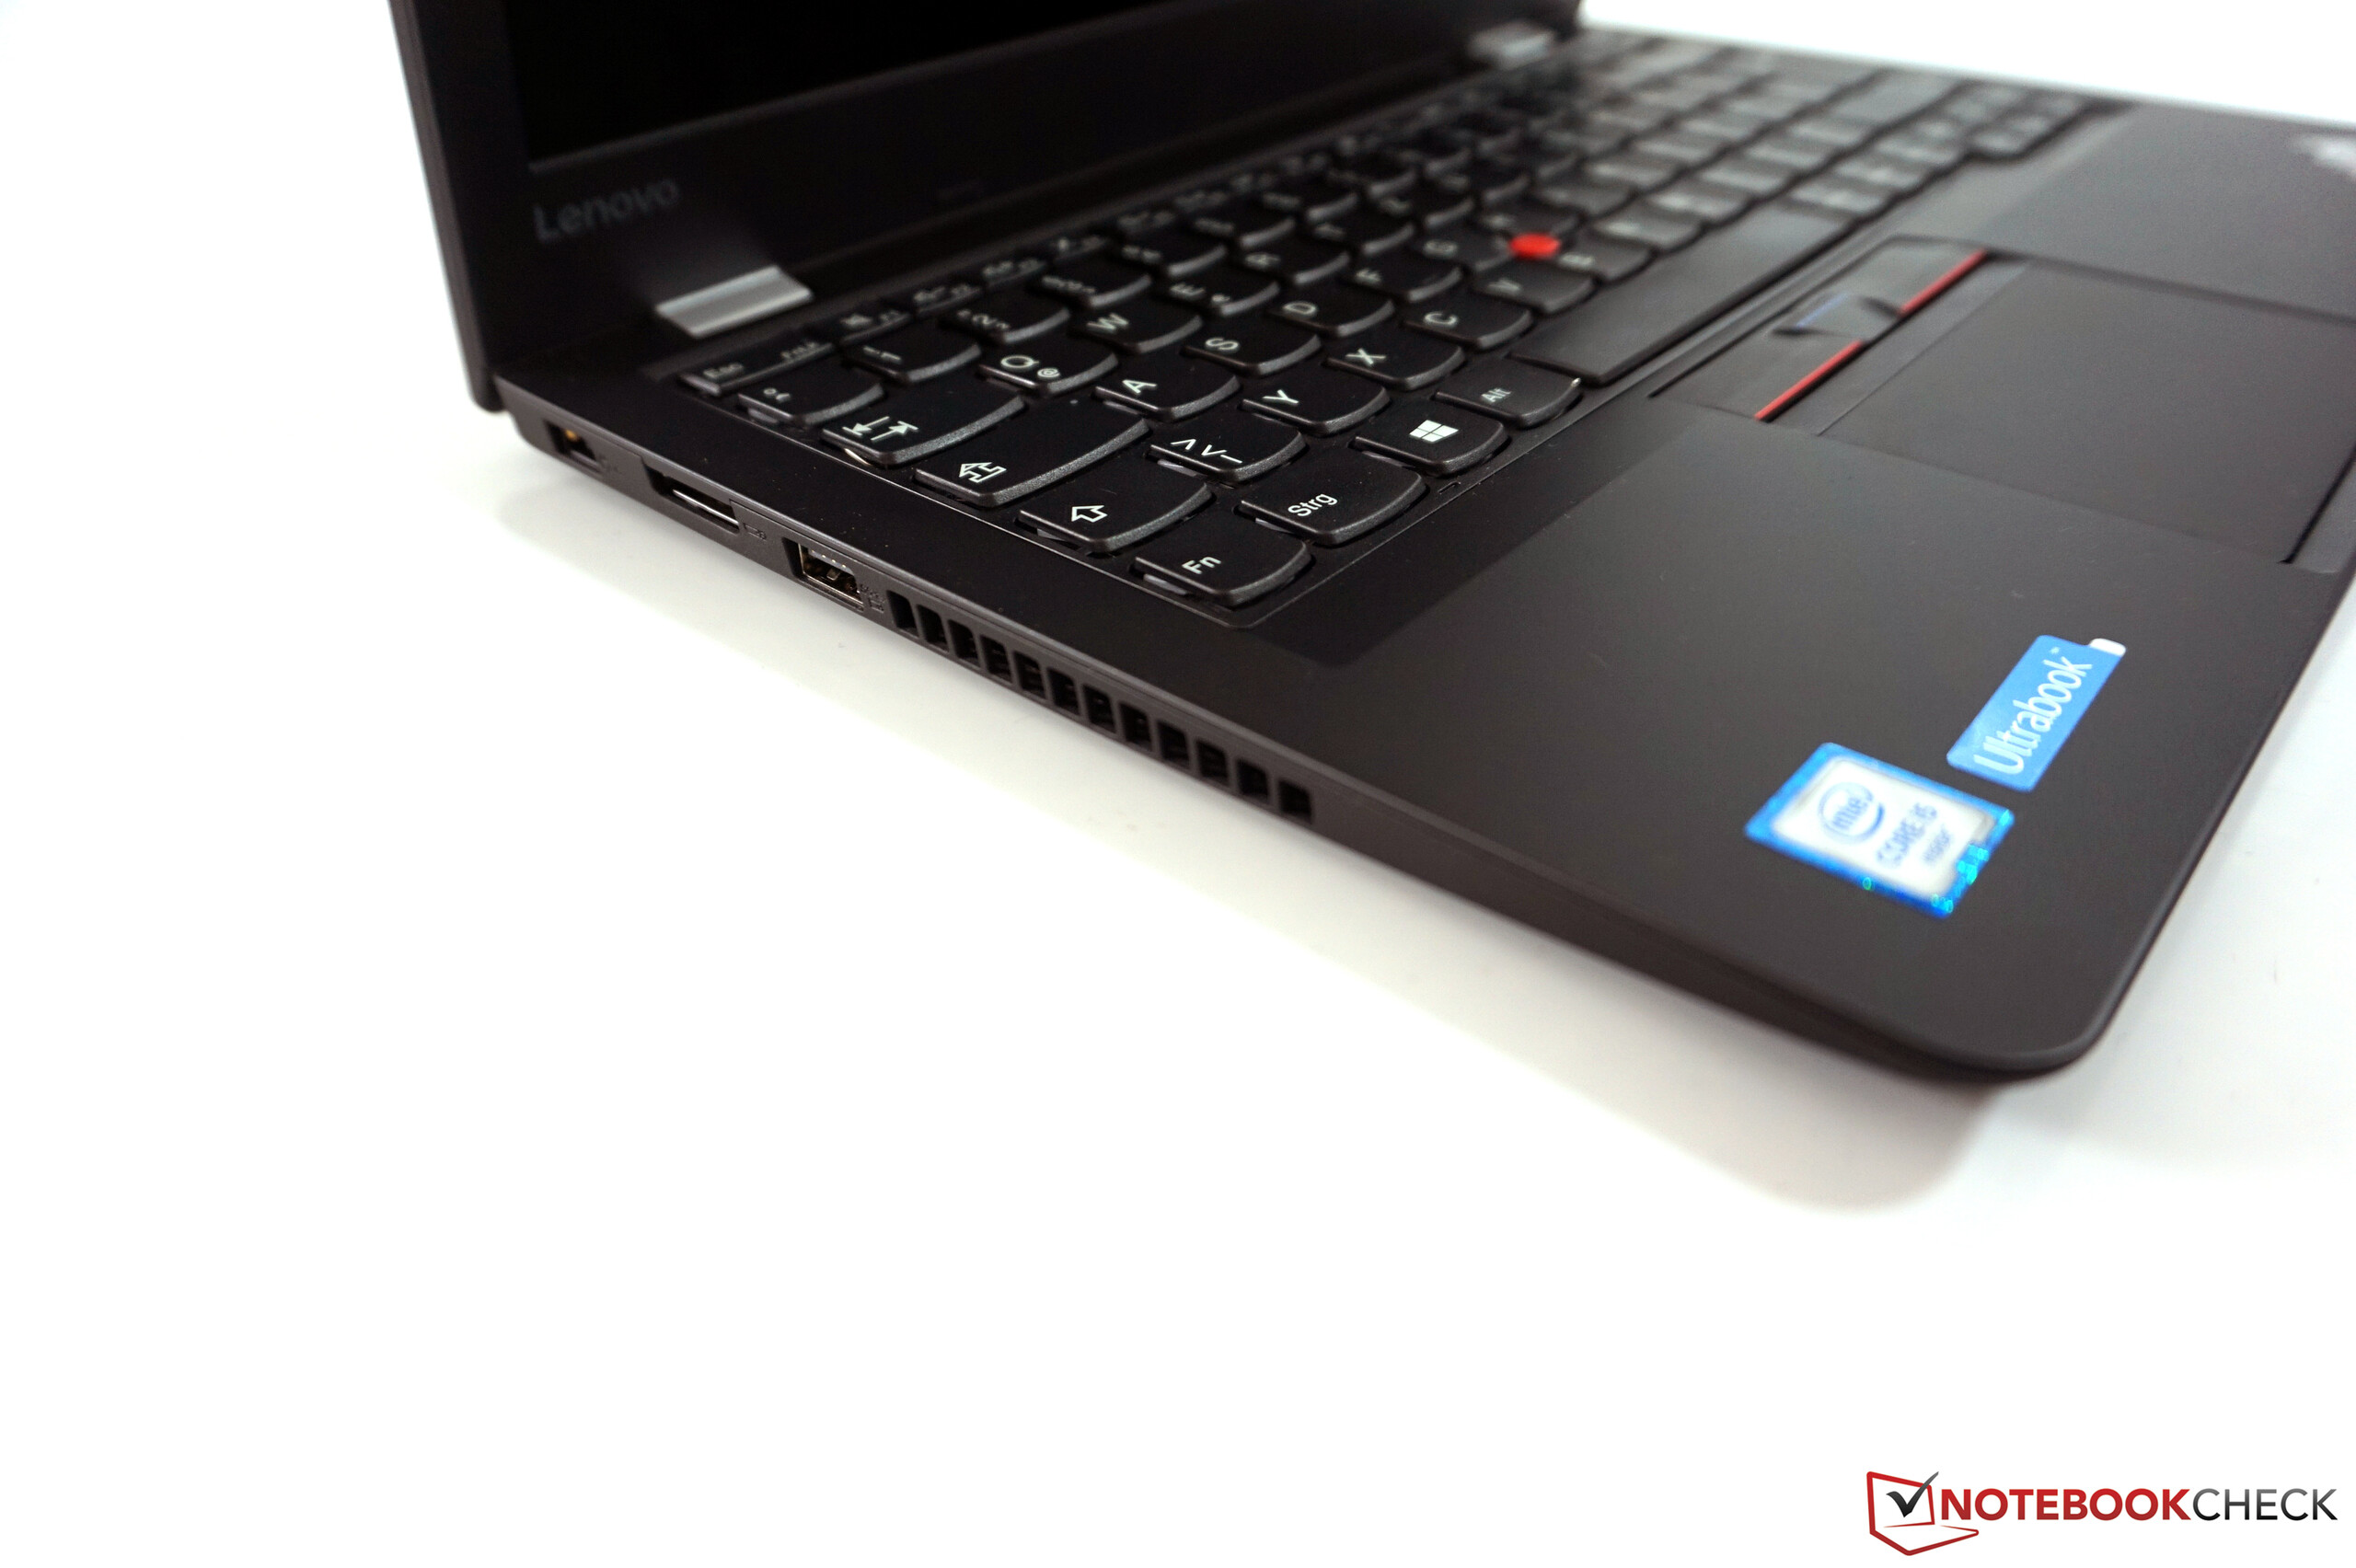
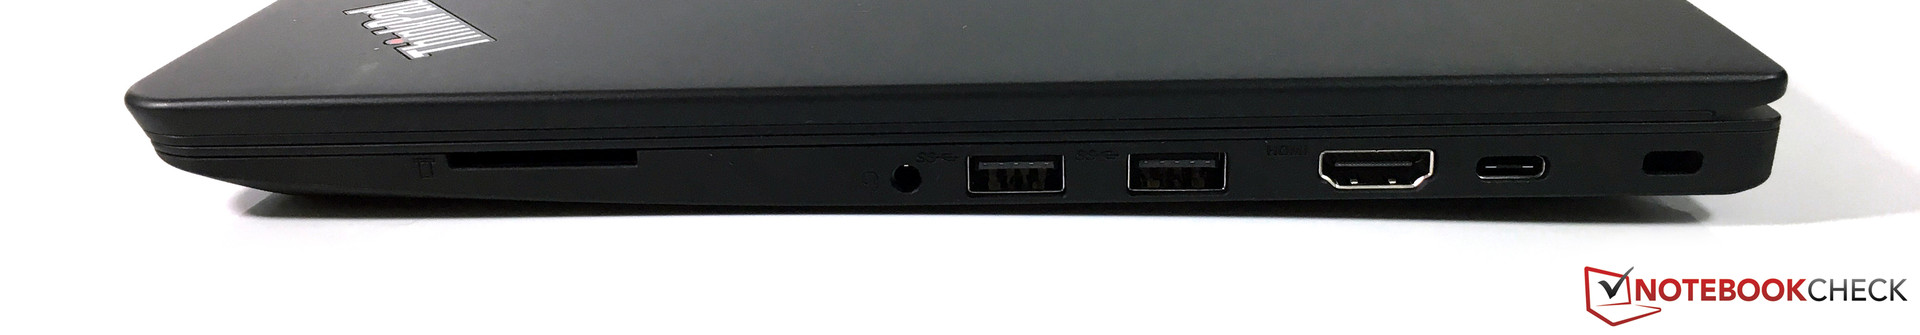
Il nuovo ThinkPad 13 è un dispositivo interessante: si tratta di un Ultrabook con porte e componenti moderni che non ha rivelato alcun problema grave nella nostra prova. Si riceve un discreto pannello FHD con finitura opaca, ma potrebbe essere un po' più luminoso per un miglior utilizzo all'esterno. Le prestazioni risutano buone grazie all'SSD, e siamo soddisfatti anche dell'ottima tastiera ThinkPad, anche se non illuminata.
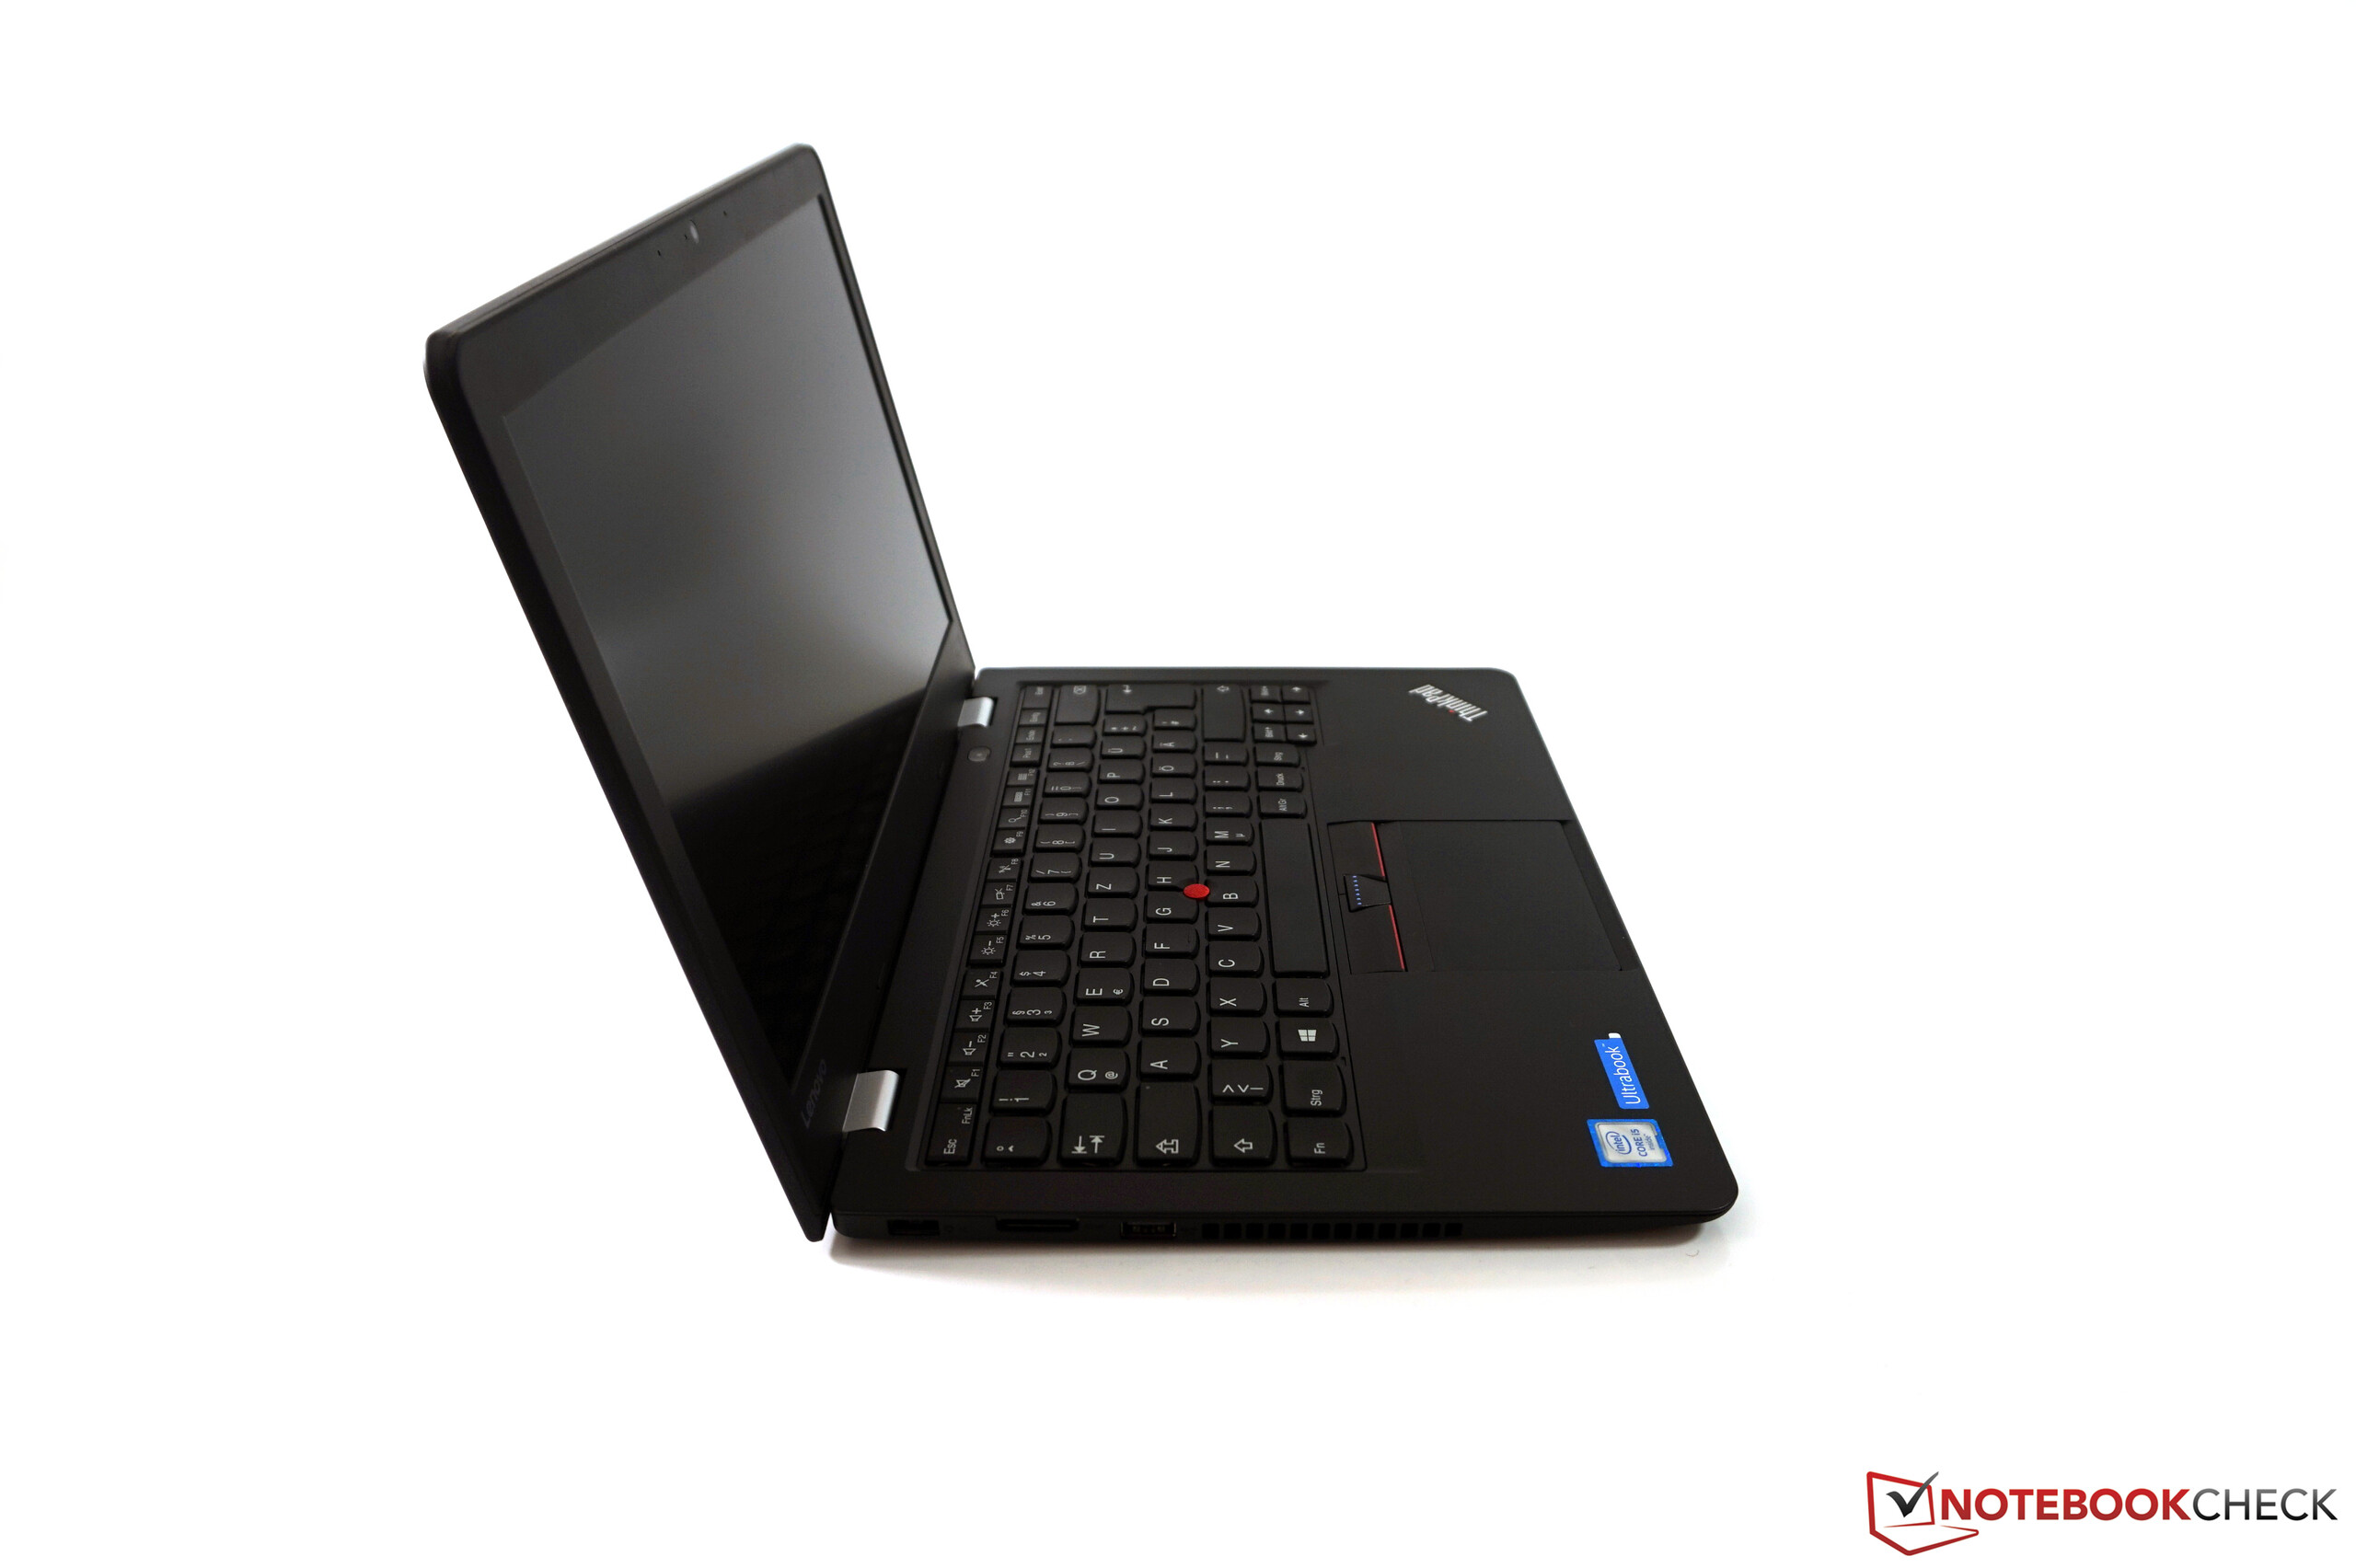
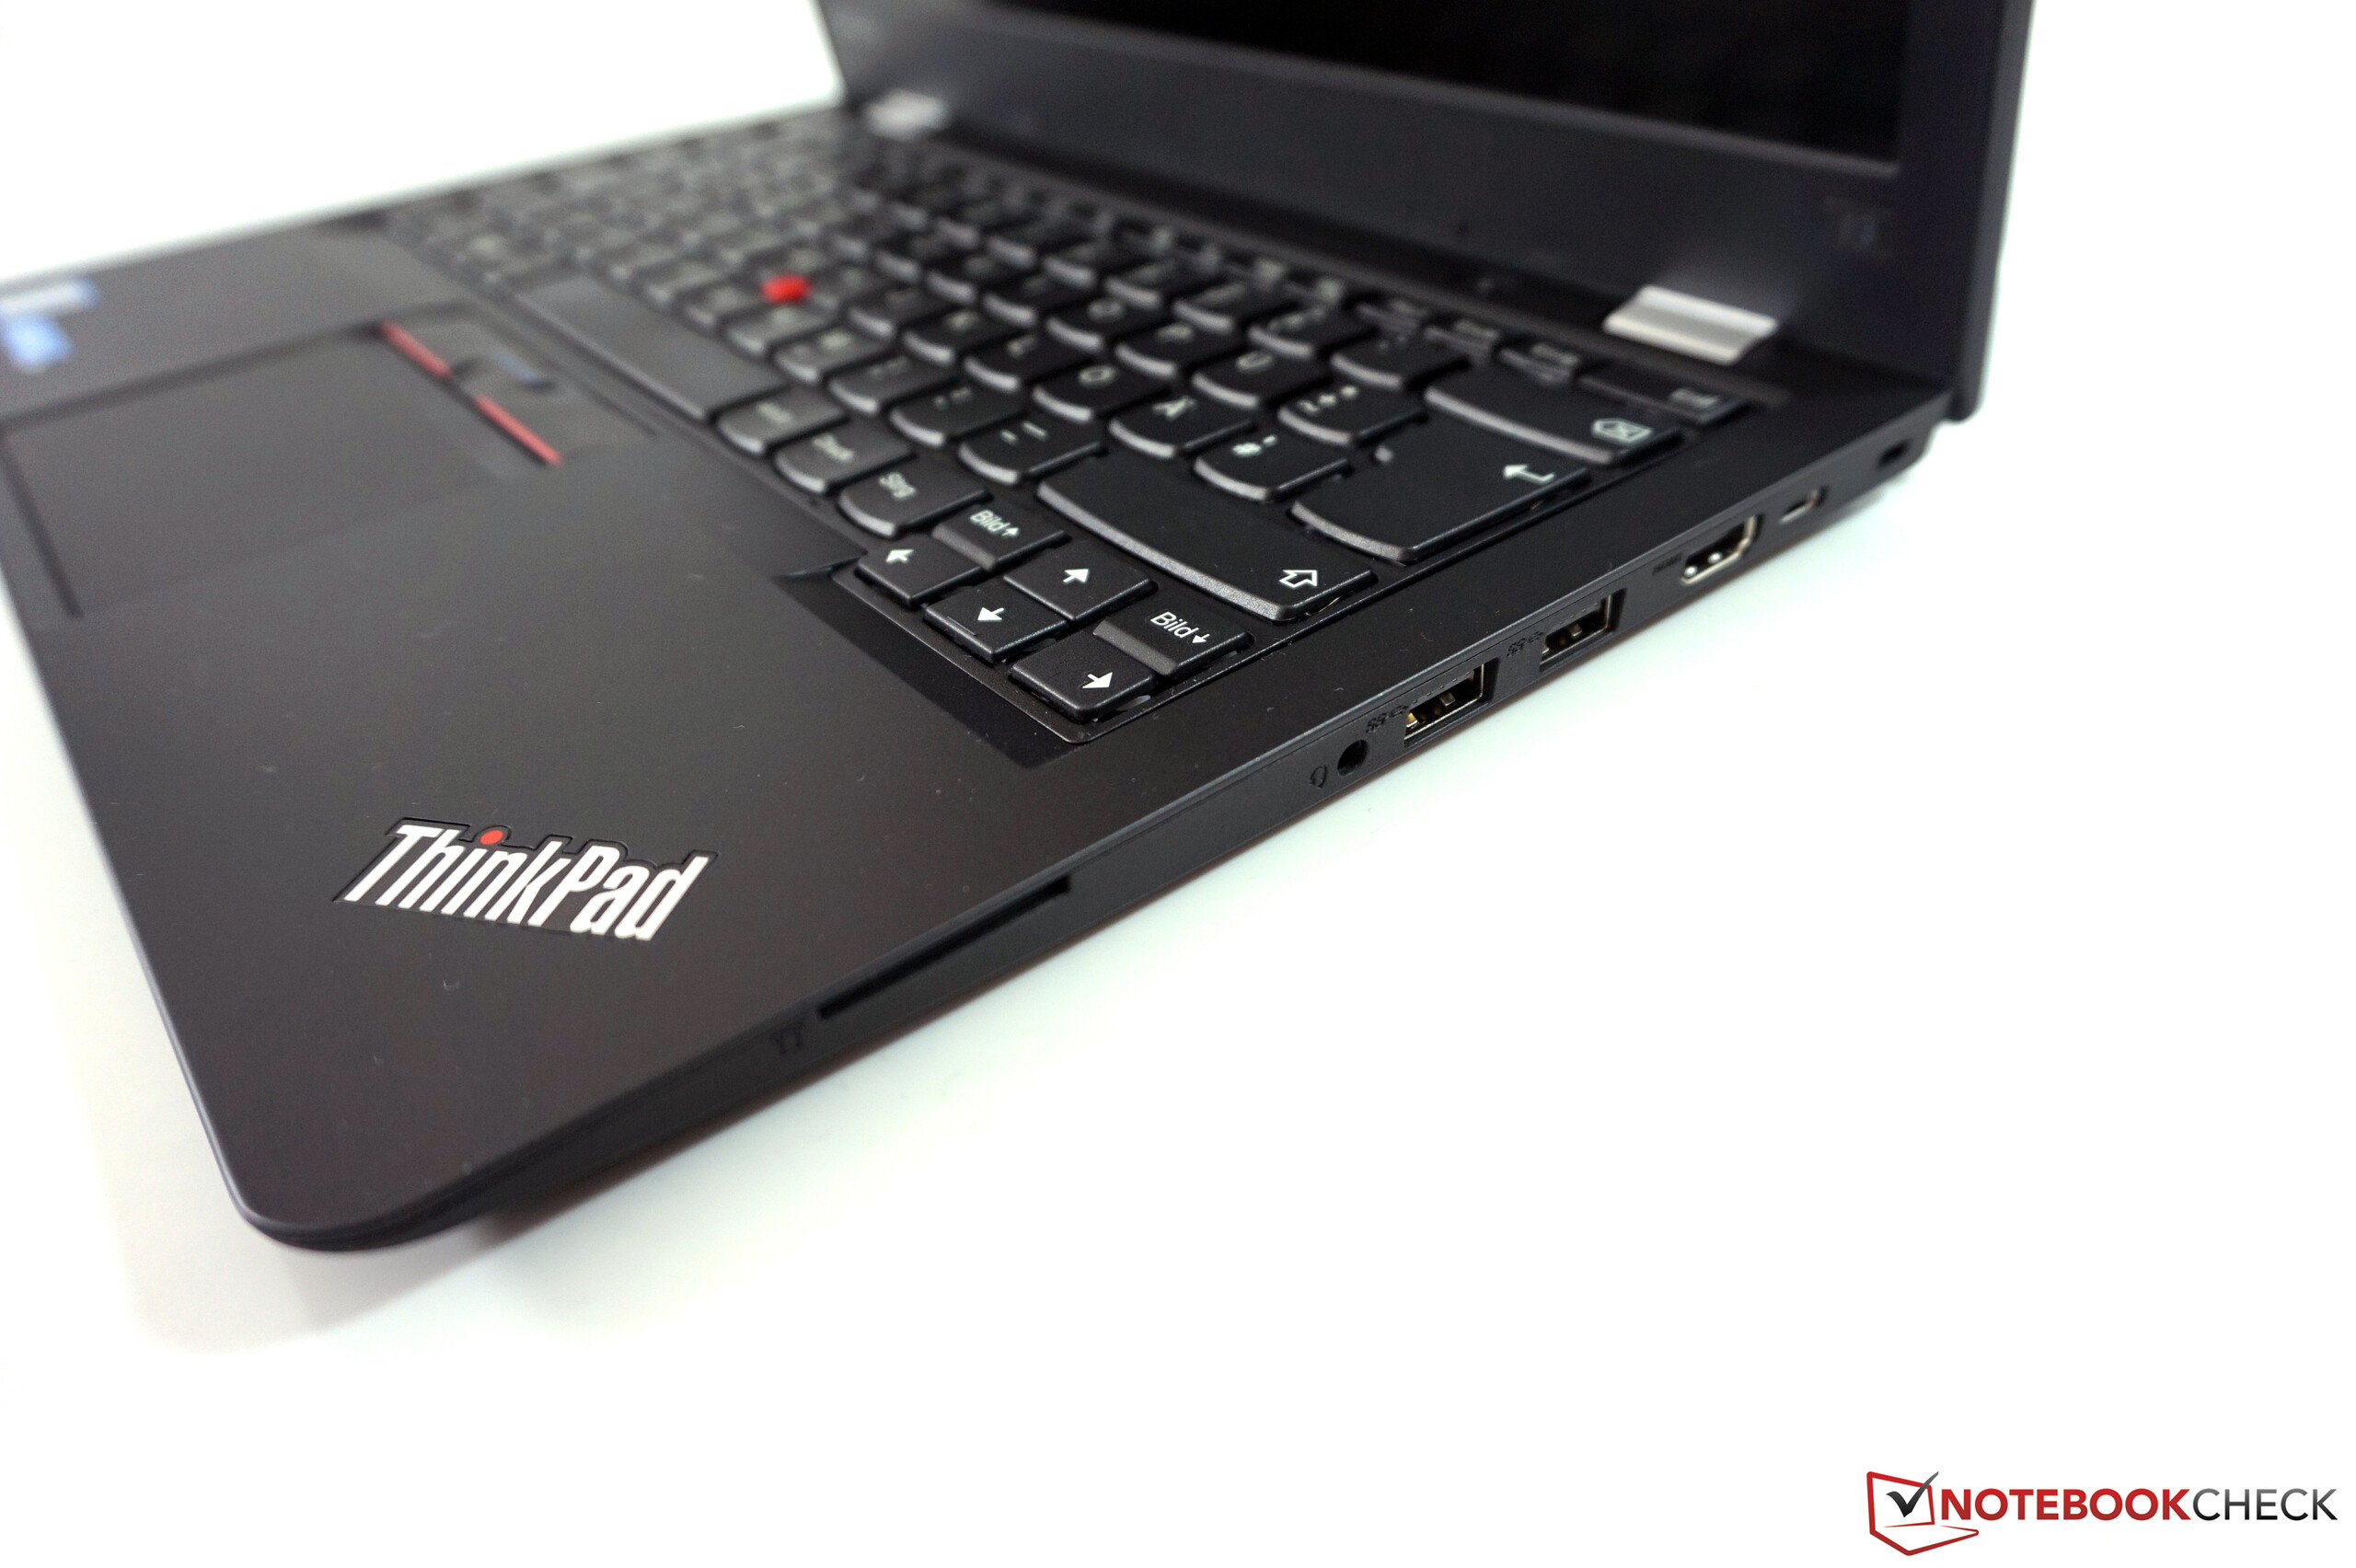
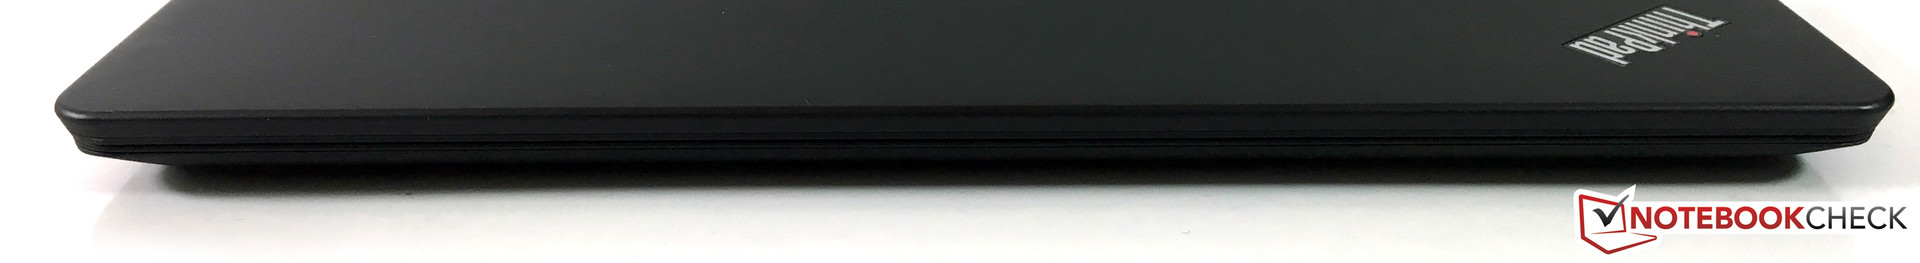
In termini di case è necessario scendere a compromessi. La stabilità dell'unità di base è buona, ma il display è sensibile a pressione e tentativi di piegatura. Le cerniere non sono molto tese e non riescono a prevenire un certo rimbalzo del display. Ci sono ulteriori limitazioni in termini di funzionalità di sicurezza.
Il modello Campus del ThinkPad 13 è in particolare decisamente consigliabile. I rivali sono più interessanti se si deve pagare il prezzo completo di 1.000 Euro (~$1119), in particolare il Dell XPS 13 è un'alternativa decisamente più interessante.
È particolarmente interessante il paragone con gli altri due modelli ThinkPad. Le prestazioni dei tre notebook è praticamente identica, così come l'autonomia della batteria. Il prezzo aggiuntivo è per la costruzione più robusta, la tastiera illuminata e funzioni di sicurezza più complete con una garanzia di durata più estesa. La situazione dei display è meno chiara. I nostri due modelli provati, delle configurazioni T460 e T460s, erano dotati di pannelli Innolux, meno performante rispetto al display LG del ThinkPad 13.
Sia il ThinkPad 13 che il ThinkPad T460 offrono di più delle due alternative meno care di Asus e Acer considerando la possibilità di accesso al programma Campus di Lenovo. Il ThinkPad 13 è superiore rispetto al T460 in termini di mobilità, quindi la decisione non è semplice e dipende dagli scenari di utilizzo. Se si porta il notebook a scuola ogni giorno, il ThinkPad 13 è sicuramente la scelta migliore. Una raccomandazione è più difficile da fare se si deve pagare il prezzo completo di circa 1.000 Euro (~$1119). In particolare, il Dell XPS 13 è un'alternativa migliore in questa fascia di prezzo.
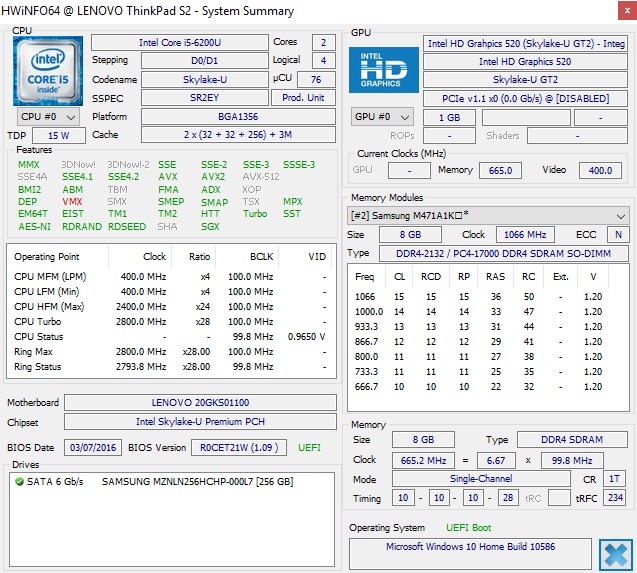
Lenovo ThinkPad 13-20GKS01100
-
04/28/2017 v6(old)
Andreas Osthoff
Pricecompare
