 Deutsch
 English
 Español
 Français
 Italiano
 Nederlands
 Polski
 Português
 Русский
 Türkçe
 Svenska
 Chinese
 Magyar
Recensione breve dell'Ultrabook Dell Latitude 14 E7470

| |||||||||||||||||||||||||
Distribuzione della luminosità: 81 %
Al centro con la batteria: 380 cd/m²
Contrasto: 1462:1 (Nero: 0.26 cd/m²)
ΔE Color 3.11 | 0.5-29.43 Ø5
ΔE Greyscale 4.35 | 0.57-98 Ø5.3
96% sRGB (Argyll 1.6.3 3D)
62% AdobeRGB 1998 (Argyll 1.6.3 3D)
69.3% AdobeRGB 1998 (Argyll 2.2.0 3D)
95.9% sRGB (Argyll 2.2.0 3D)
67.2% Display P3 (Argyll 2.2.0 3D)
Gamma: 2.37
| Dell Latitude 14 7000 Series E7470 FHD IPS Touch | HP EliteBook 840 G3 T9X59ET#ABD FHD TN | Lenovo ThinkPad T460s-20FA003GGE WQHD IPS | Lenovo ThinkPad T460s-20F9003SGE FHD IPS | HP EliteBook Folio 1040 G2 WQHD IPS | Acer TravelMate P645-S-58HK FHD IPS | |
|---|---|---|---|---|---|---|
| Display | -26% | 2% | -37% | -1% | -3% | |
| Display P3 Coverage | 67.2 | 48.93 -27% | 68.7 2% | 41.65 -38% | 66.1 -2% | 66.7 -1% |
| sRGB Coverage | 95.9 | 73.7 -23% | 98.1 2% | 61.6 -36% | 94.8 -1% | 90.8 -5% |
| AdobeRGB 1998 Coverage | 69.3 | 50.5 -27% | 70.4 2% | 43.14 -38% | 68.3 -1% | 66.5 -4% |
| Response Times | 9% | 9% | 2% | |||
| Response Time Grey 50% / Grey 80% * | 48 ? | 43 ? 10% | 35.6 ? 26% | 42 ? 12% | ||
| Response Time Black / White * | 27 ? | 25 ? 7% | 29.2 ? -8% | 29.2 ? -8% | ||
| PWM Frequency | 204 ? | 220 ? | ||||
| Screen | -73% | -21% | -46% | -11% | -20% | |
| Brightness middle | 380 | 366 -4% | 257 -32% | 226 -41% | 274 -28% | 331 -13% |
| Brightness | 354 | 336 -5% | 248 -30% | 211 -40% | 263 -26% | 309 -13% |
| Brightness Distribution | 81 | 87 7% | 94 16% | 89 10% | 85 5% | 82 1% |
| Black Level * | 0.26 | 0.65 -150% | 0.26 -0% | 0.22 15% | 0.21 19% | 0.4 -54% |
| Contrast | 1462 | 563 -61% | 988 -32% | 1027 -30% | 1305 -11% | 828 -43% |
| Colorchecker dE 2000 * | 3.11 | 10.26 -230% | 4.59 -48% | 6.44 -107% | 3.93 -26% | 4.07 -31% |
| Colorchecker dE 2000 max. * | 6.73 | 9.72 -44% | 17.18 -155% | |||
| Greyscale dE 2000 * | 4.35 | 11.51 -165% | 6.38 -47% | 5.87 -35% | 5.28 -21% | 4.86 -12% |
| Gamma | 2.37 93% | 2.4 92% | 2.51 88% | 2.37 93% | 2.49 88% | 2.49 88% |
| CCT | 6771 96% | 12725 51% | 6238 104% | 6856 95% | 7108 91% | 6109 106% |
| Color Space (Percent of AdobeRGB 1998) | 62 | 47 -24% | 65 5% | 39.58 -36% | 61 -2% | 59 -5% |
| Color Space (Percent of sRGB) | 96 | 74 -23% | 98 2% | 61.15 -36% | 90.6 -6% | |
| Media totale (Programma / Settaggio) | -30% /
-51% | -3% /
-12% | -27% /
-38% | -6% /
-9% | -12% /
-16% |
* ... Meglio usare valori piccoli
Tempi di risposta del Display
| ↔ Tempi di risposta dal Nero al Bianco | ||
|---|---|---|
| 27 ms ... aumenta ↗ e diminuisce ↘ combinato | ↗ 7 ms Incremento | 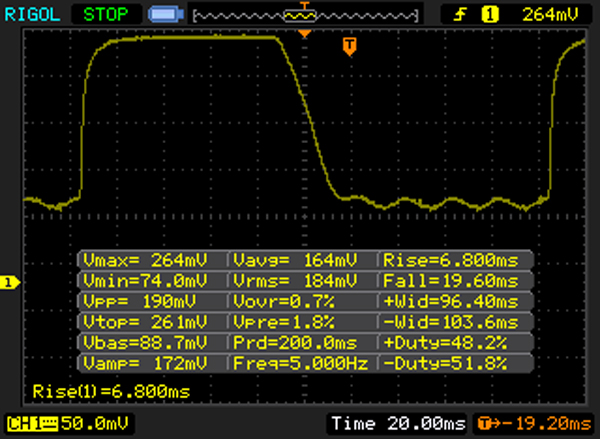 |
| ↘ 20 ms Calo | ||
| Lo schermo mostra tempi di risposta relativamente lenti nei nostri tests e potrebbe essere troppo lento per i gamers. In confronto, tutti i dispositivi di test variano da 0.1 (minimo) a 240 (massimo) ms. » 63 % di tutti i dispositivi è migliore. Questo significa che i tempi di risposta rilevati sono peggiori rispetto alla media di tutti i dispositivi testati (21.5 ms). | ||
| ↔ Tempo di risposta dal 50% Grigio all'80% Grigio | ||
| 48 ms ... aumenta ↗ e diminuisce ↘ combinato | ↗ 15 ms Incremento | 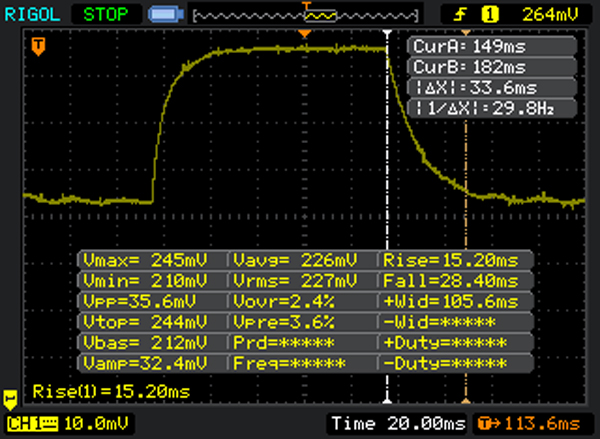 |
| ↘ 33 ms Calo | ||
| Lo schermo mostra tempi di risposta lenti nei nostri tests e sarà insoddisfacente per i gamers. In confronto, tutti i dispositivi di test variano da 0.2 (minimo) a 636 (massimo) ms. » 80 % di tutti i dispositivi è migliore. Questo significa che i tempi di risposta rilevati sono peggiori rispetto alla media di tutti i dispositivi testati (33.7 ms). | ||
Sfarfallio dello schermo / PWM (Pulse-Width Modulation)
| flickering dello schermo / PWM non rilevato | ||
In confronto: 53 % di tutti i dispositivi testati non utilizza PWM per ridurre la luminosita' del display. Se è rilevato PWM, una media di 17924 (minimo: 5 - massimo: 3846000) Hz è stata rilevata. | ||
| PCMark 7 Score | 5194 punti | |
| PCMark 8 Home Score Accelerated v2 | 3344 punti | |
| PCMark 8 Work Score Accelerated v2 | 4543 punti | |
Aiuto | ||
| Dell Latitude 14 7000 Series E7470 HD Graphics 520, 6600U, Samsung SSD PM851 M.2 2280 256GB | Lenovo ThinkPad T460s-20FA003GGE HD Graphics 520, 6600U, Samsung SSD SM951a 512GB M.2 PCIe 3.0 x4 NVMe (MZVKV512) | Lenovo ThinkPad T450s-20BWS1UT00 GeForce 940M, 5200U, Samsung SSD PM871 MZ7LN256HCHP | HP EliteBook 840 G3 T9X59ET#ABD HD Graphics 520, 6500U, Samsung SSD PM851 256 GB MZNTE256HMHP | HP EliteBook Folio 1040 G2 HD Graphics 5500, 5600U, Samsung SSD PM851 256 GB MZNTE256HMHP | Acer TravelMate P645-S-58HK HD Graphics 5500, 5200U, Kingston RBU-SNS8100S3256GD | |
|---|---|---|---|---|---|---|
| CrystalDiskMark 3.0 | 134% | 7% | -9% | -2% | -29% | |
| Read Seq | 518 | 1778 243% | 517 0% | 497.8 -4% | 499.9 -3% | 506 -2% |
| Write Seq | 300.7 | 1530 409% | 302.4 1% | 241.4 -20% | 264.3 -12% | 343.2 14% |
| Read 4k | 36.32 | 51.3 41% | 36.72 1% | 27.02 -26% | 28.4 -22% | 28.73 -21% |
| Write 4k | 110.9 | 139.3 26% | 99.4 -10% | 82.6 -26% | 101.2 -9% | 66.4 -40% |
| Read 4k QD32 | 400.9 | 561 40% | 387.1 -3% | 388.5 -3% | 393.3 -2% | 91.6 -77% |
| Write 4k QD32 | 191.7 | 277 44% | 293.2 53% | 242.8 27% | 265.3 38% | 95.7 -50% |
| AS SSD | 182% | 14% | -5% | -3% | -9% | |
| Seq Read | 495.5 | 2039 312% | 503 2% | 505 2% | 480.7 -3% | 502 1% |
| Seq Write | 283.7 | 1407 396% | 285.2 1% | 231.6 -18% | 250.1 -12% | 324.6 14% |
| 4K Read | 30.91 | 45.41 47% | 33.27 8% | 25.24 -18% | 25.98 -16% | 31.82 3% |
| 4K Write | 85.1 | 114.4 34% | 84.6 -1% | 72.4 -15% | 84.4 -1% | 58 -32% |
| 4K-64 Read | 336.1 | 968 188% | 380 13% | 362 8% | 356.1 6% | 194.7 -42% |
| 4K-64 Write | 170 | 366 115% | 272.3 60% | 190.6 12% | 182.7 7% | 169.2 0% |
| Media totale (Programma / Settaggio) | 158% /
158% | 11% /
10% | -7% /
-7% | -3% /
-2% | -19% /
-19% |

| 3DMark 11 Performance | 1418 punti | |
| 3DMark Ice Storm Standard Score | 39400 punti | |
| 3DMark Cloud Gate Standard Score | 5173 punti | |
| 3DMark Fire Strike Score | 707 punti | |
Aiuto | ||
| Battlefield Hardline - 1024x768 Low Graphics Quality (DX11) (ordina per valore) | |
| Dell Latitude 14 7000 Series E7470 | |
| Lenovo ThinkPad Yoga 260 20FD001XGE | |
| Toshiba Satellite Radius 12 P20W-C-106 | |
| FIFA 16 - 1366x768 High Preset AA:2x MS (ordina per valore) | |
| Dell Latitude 14 7000 Series E7470 | |
| Star Wars Battlefront - 1024x768 Low Preset (ordina per valore) | |
| Dell Latitude 14 7000 Series E7470 | |
| Acer Aspire R14 R5-471T-79GQ | |
| basso | medio | alto | ultra | |
| Battlefield Hardline (2015) | 42 | 26 | 8 | |
| FIFA 16 (2015) | 48.8 | 31.4 | ||
| Star Wars Battlefront (2015) | 26 | 15 |
| Dell Latitude 14 7000 Series E7470 HD Graphics 520, 6600U, Samsung SSD PM851 M.2 2280 256GB | Dell Latitude E7450 HD Graphics 5500, 5300U, Samsung SSD PM851 mSATA 128 GB | HP EliteBook 840 G3 T9X59ET#ABD HD Graphics 520, 6500U, Samsung SSD PM851 256 GB MZNTE256HMHP | Lenovo ThinkPad T460s-20FA003GGE HD Graphics 520, 6600U, Samsung SSD SM951a 512GB M.2 PCIe 3.0 x4 NVMe (MZVKV512) | HP EliteBook Folio 1040 G2 HD Graphics 5500, 5600U, Samsung SSD PM851 256 GB MZNTE256HMHP | Lenovo ThinkPad T450s-20BWS1UT00 GeForce 940M, 5200U, Samsung SSD PM871 MZ7LN256HCHP | Acer TravelMate P645-S-58HK HD Graphics 5500, 5200U, Kingston RBU-SNS8100S3256GD | |
|---|---|---|---|---|---|---|---|
| Noise | -3% | -7% | -1% | -4% | 2% | -2% | |
| off /ambiente * | 31.2 | 31.2 -0% | 29.2 6% | ||||
| Idle Minimum * | 31.2 | 29.1 7% | 31.2 -0% | 29.2 6% | 29.6 5% | 29.1 7% | 29.6 5% |
| Idle Average * | 31.2 | 29.1 7% | 32.1 -3% | 29.2 6% | 29.6 5% | 29.1 7% | 29.6 5% |
| Idle Maximum * | 31.2 | 30 4% | 33.1 -6% | 29.2 6% | 32.2 -3% | 29.1 7% | 30.2 3% |
| Load Average * | 31.9 | 36.4 -14% | 36.2 -13% | 33.7 -6% | 36.4 -14% | 33.1 -4% | 35.6 -12% |
| Load Maximum * | 31.9 | 37.8 -18% | 37.8 -18% | 38.5 -21% | 36.4 -14% | 34.3 -8% | 35.9 -13% |
* ... Meglio usare valori piccoli
Rumorosità
| Idle |
| 31.2 / 31.2 / 31.2 dB(A) |
| Sotto carico |
| 31.9 / 31.9 dB(A) |
 | ||
30 dB silenzioso 40 dB(A) udibile 50 dB(A) rumoroso |
||
min: | ||
| Dell Latitude 14 7000 Series E7470 HD Graphics 520, 6600U, Samsung SSD PM851 M.2 2280 256GB | Dell Latitude E7450 HD Graphics 5500, 5300U, Samsung SSD PM851 mSATA 128 GB | HP EliteBook 840 G3 T9X59ET#ABD HD Graphics 520, 6500U, Samsung SSD PM851 256 GB MZNTE256HMHP | Lenovo ThinkPad T460s-20FA003GGE HD Graphics 520, 6600U, Samsung SSD SM951a 512GB M.2 PCIe 3.0 x4 NVMe (MZVKV512) | HP EliteBook Folio 1040 G2 HD Graphics 5500, 5600U, Samsung SSD PM851 256 GB MZNTE256HMHP | Lenovo ThinkPad T450s-20BWS1UT00 GeForce 940M, 5200U, Samsung SSD PM871 MZ7LN256HCHP | Acer TravelMate P645-S-58HK HD Graphics 5500, 5200U, Kingston RBU-SNS8100S3256GD | |
|---|---|---|---|---|---|---|---|
| Heat | -12% | -1% | -10% | -9% | -27% | -13% | |
| Maximum Upper Side * | 38.2 | 41.6 -9% | 37 3% | 40.8 -7% | 35.9 6% | 49.6 -30% | 41.6 -9% |
| Maximum Bottom * | 36.5 | 37.1 -2% | 37.1 -2% | 40.3 -10% | 42.4 -16% | 51.9 -42% | 41.7 -14% |
| Idle Upper Side * | 25.1 | 28.7 -14% | 25.3 -1% | 27.6 -10% | 28.5 -14% | 29 -16% | 30.6 -22% |
| Idle Bottom * | 25.8 | 31.4 -22% | 26.6 -3% | 28.7 -11% | 29 -12% | 30.9 -20% | 27.5 -7% |
* ... Meglio usare valori piccoli
(+) La temperatura massima sul lato superiore è di 38.2 °C / 101 F, rispetto alla media di 34.2 °C / 94 F, che varia da 21.2 a 62.5 °C per questa classe Office.
(+) Il lato inferiore si riscalda fino ad un massimo di 36.5 °C / 98 F, rispetto alla media di 36.7 °C / 98 F
(+) In idle, la temperatura media del lato superiore è di 24 °C / 75 F, rispetto alla media deld ispositivo di 29.5 °C / 85 F.
(+) I poggiapolsi e il touchpad sono piu' freddi della temperatura della pelle con un massimo di 28.2 °C / 82.8 F e sono quindi freddi al tatto.
(±) La temperatura media della zona del palmo della mano di dispositivi simili e'stata di 27.7 °C / 81.9 F (-0.5 °C / -0.9 F).
| Dell Latitude 14 7000 Series E7470 HD Graphics 520, 6600U, Samsung SSD PM851 M.2 2280 256GB | Dell Latitude E7450 HD Graphics 5500, 5300U, Samsung SSD PM851 mSATA 128 GB | HP EliteBook 840 G3 T9X59ET#ABD HD Graphics 520, 6500U, Samsung SSD PM851 256 GB MZNTE256HMHP | Lenovo ThinkPad T460s-20FA003GGE HD Graphics 520, 6600U, Samsung SSD SM951a 512GB M.2 PCIe 3.0 x4 NVMe (MZVKV512) | HP EliteBook Folio 1040 G2 HD Graphics 5500, 5600U, Samsung SSD PM851 256 GB MZNTE256HMHP | Lenovo ThinkPad T450s-20BWS1UT00 GeForce 940M, 5200U, Samsung SSD PM871 MZ7LN256HCHP | Acer TravelMate P645-S-58HK HD Graphics 5500, 5200U, Kingston RBU-SNS8100S3256GD | |
|---|---|---|---|---|---|---|---|
| Power Consumption | 11% | 19% | 3% | 26% | -3% | 19% | |
| Idle Minimum * | 5.1 | 4 22% | 3.8 25% | 3.8 25% | 3.2 37% | 3.1 39% | 3.2 37% |
| Idle Average * | 8.5 | 7.8 8% | 6.3 26% | 7.1 16% | 6.5 24% | 8.6 -1% | 6.3 26% |
| Idle Maximum * | 10.1 | 9 11% | 6.8 33% | 7.8 23% | 7.4 27% | 9.6 5% | 8.6 15% |
| Load Average * | 35.2 | 31.6 10% | 34.4 2% | 36.3 -3% | 25.6 27% | 35.6 -1% | 30.3 14% |
| Load Maximum * | 31 | 29.6 5% | 28.3 9% | 46 -48% | 26.1 16% | 49.4 -59% | 30.4 2% |
* ... Meglio usare valori piccoli
| Off / Standby | |
| Idle | |
| Sotto carico |
|
Leggenda:
min: Attualmente utilizziamo il Metrahit Energy, un multimetro digitale professionale per la misurazione della qualità della potenza e dell'energia monofase, per le nostre misurazioni. | |
Pro
Contro
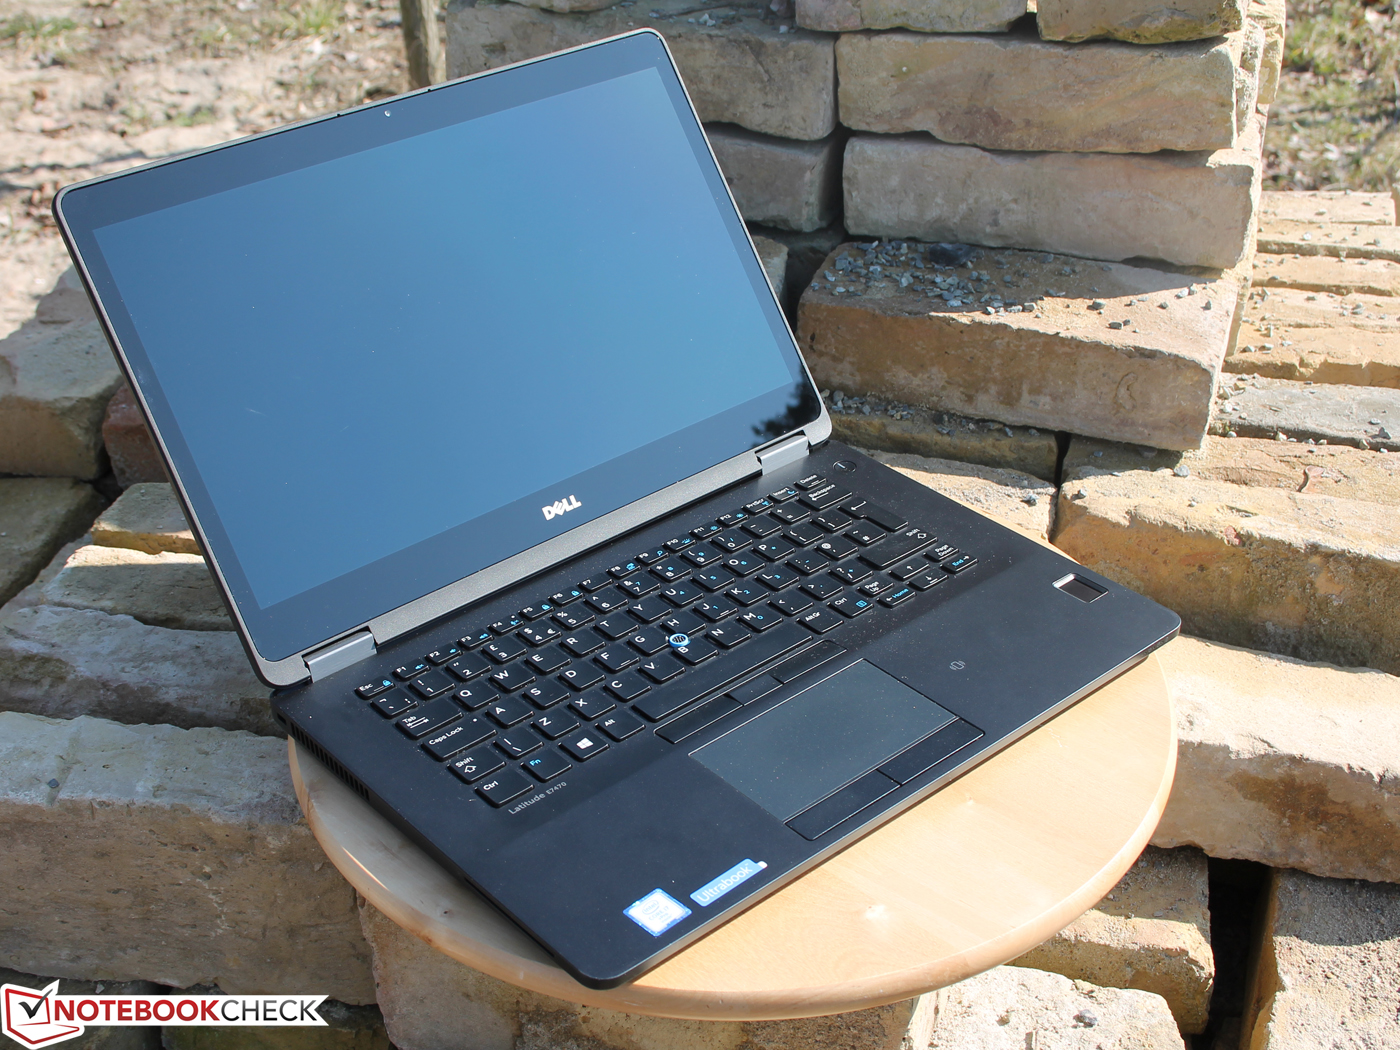
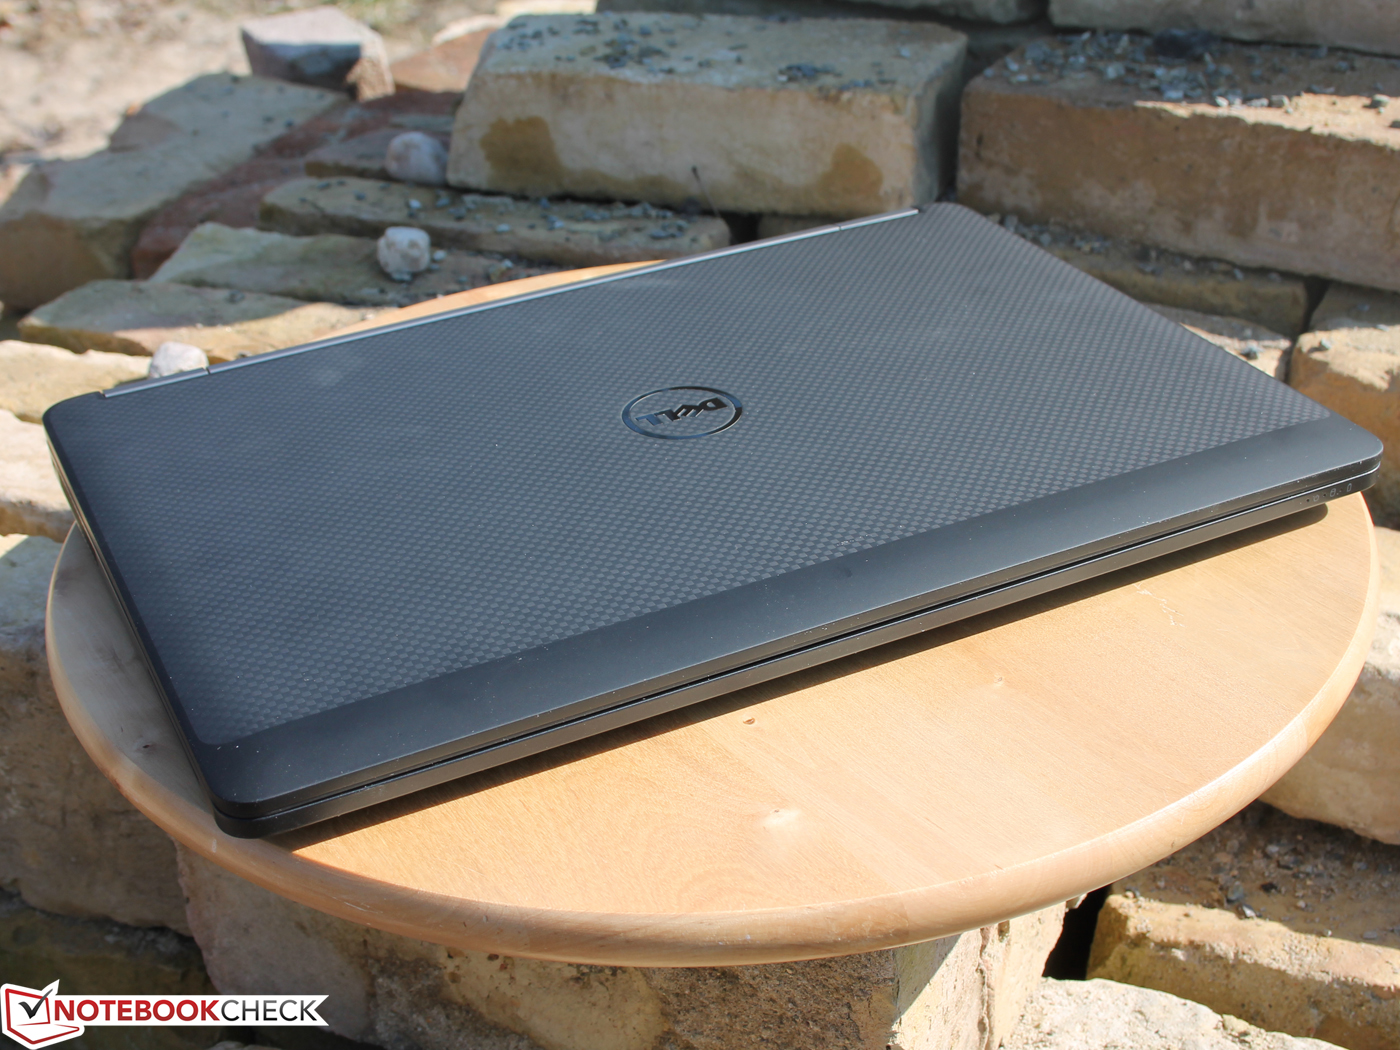
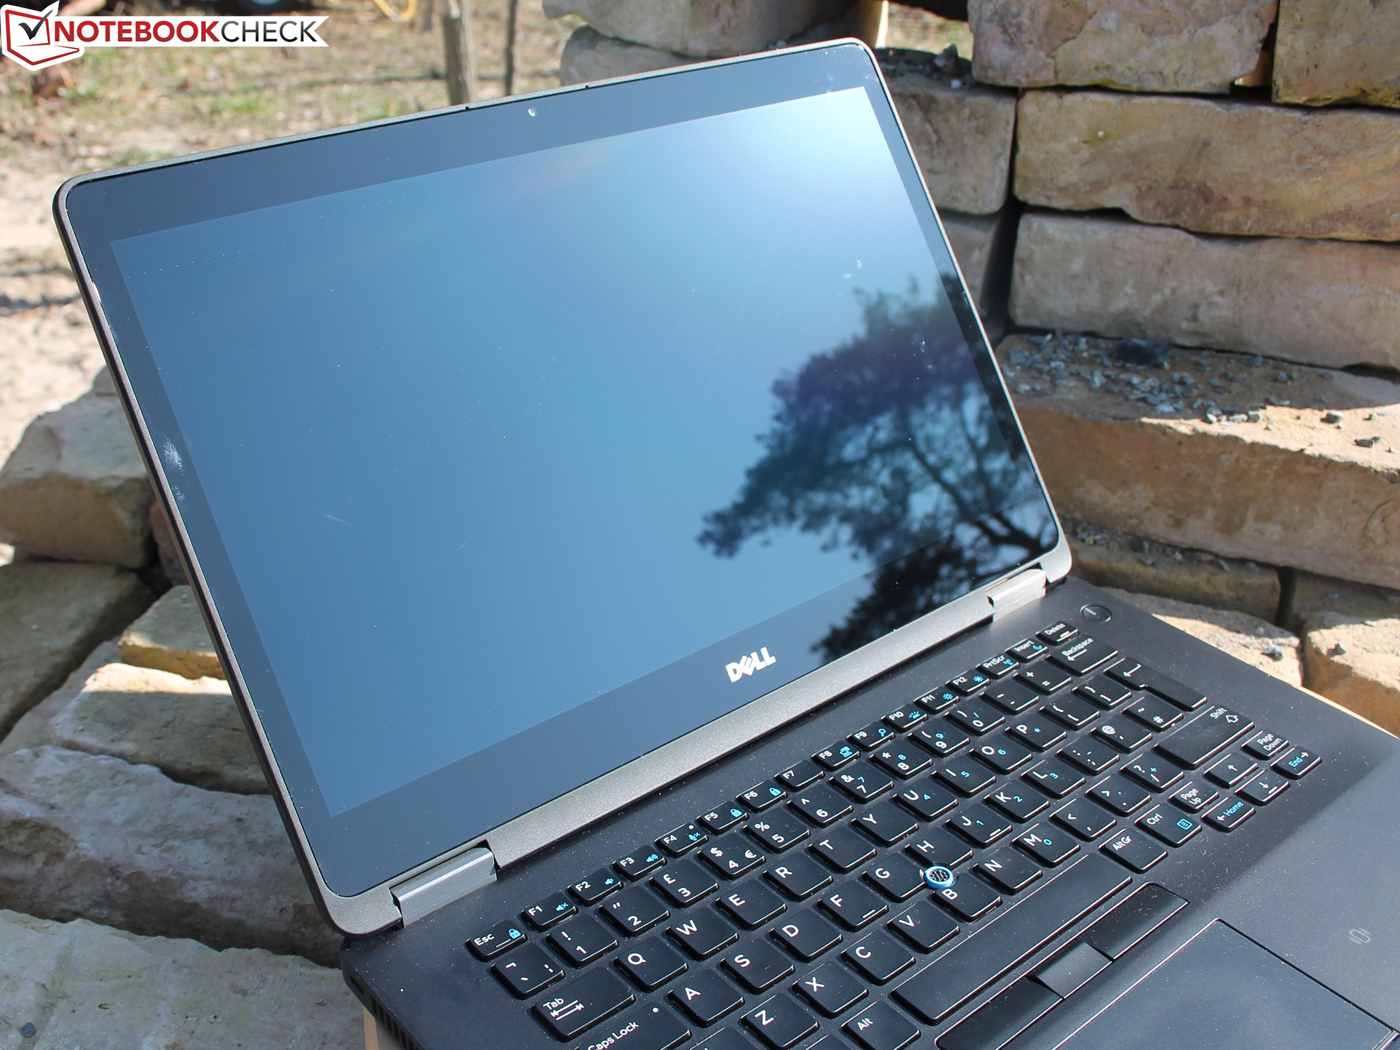
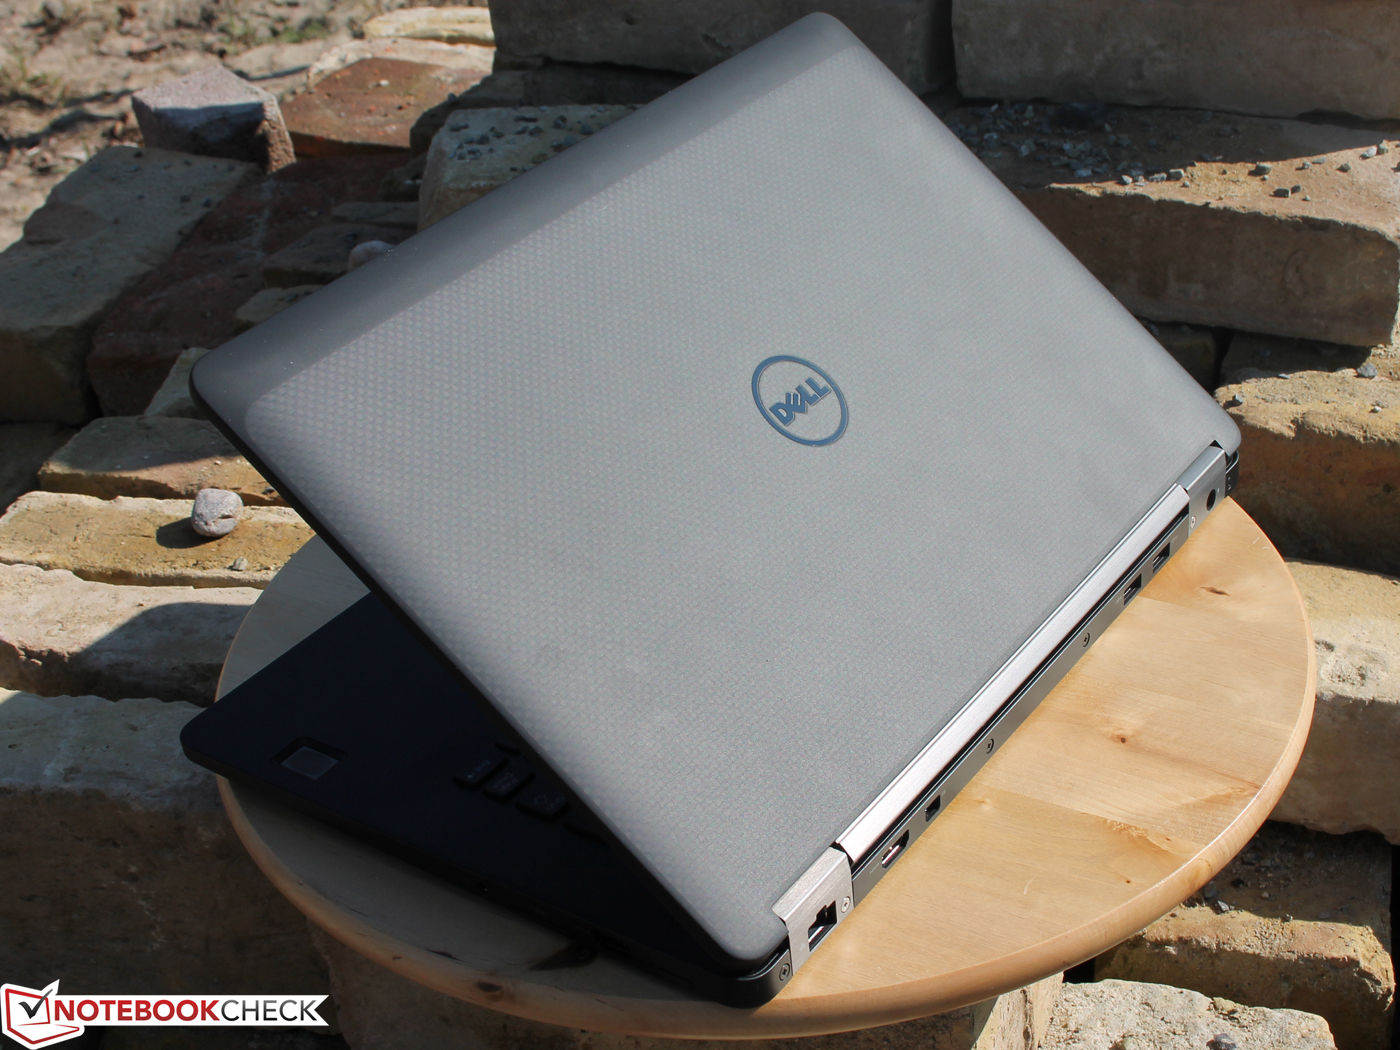
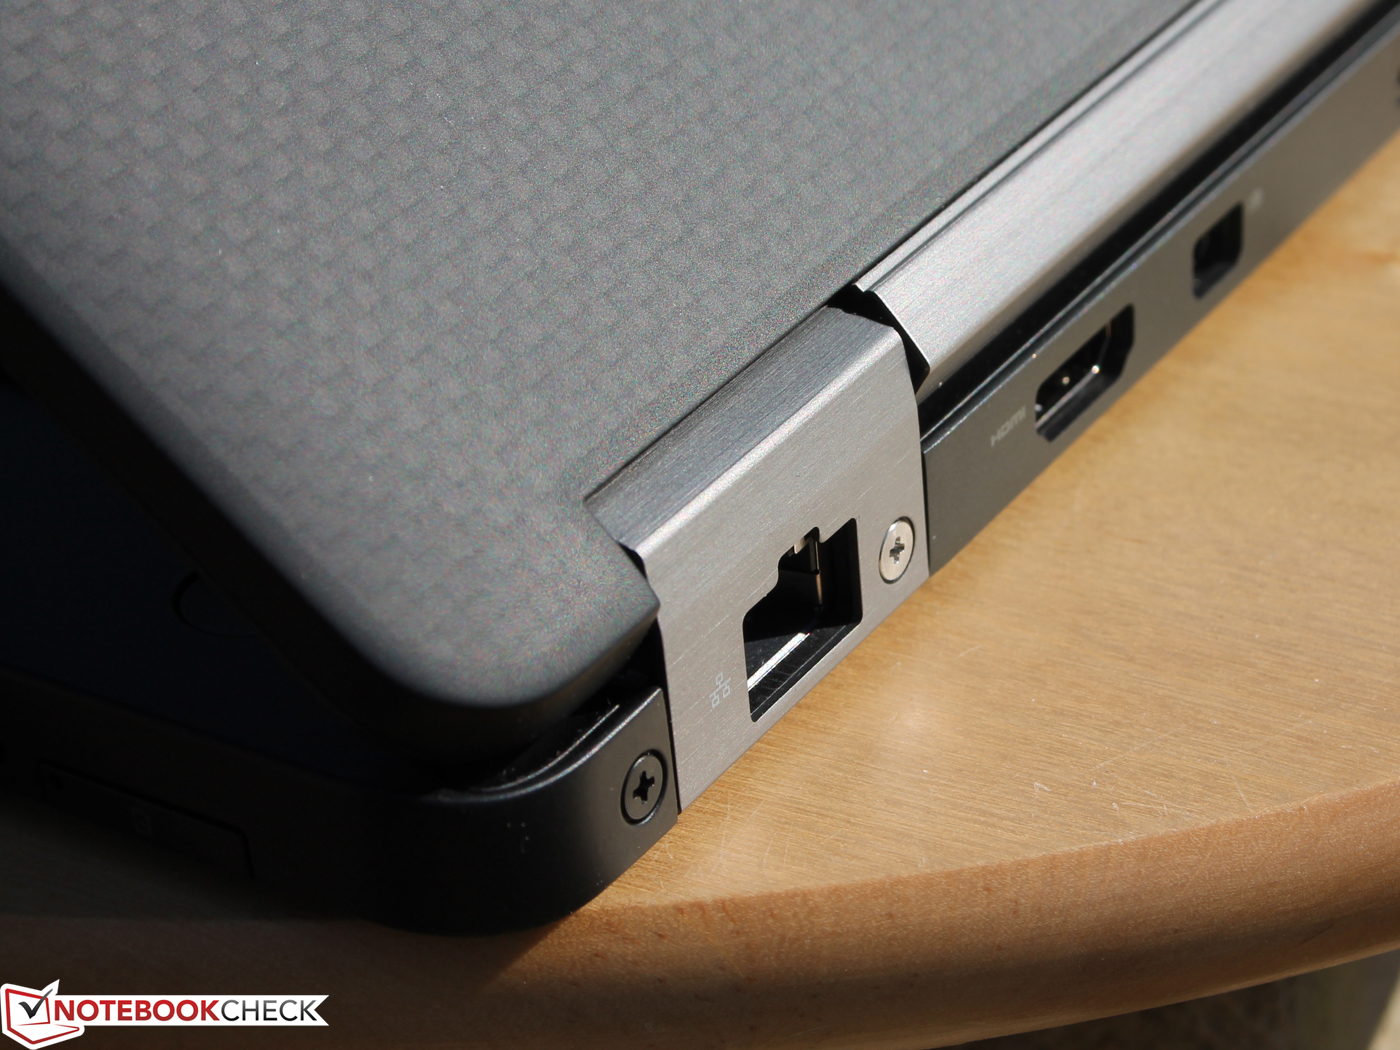
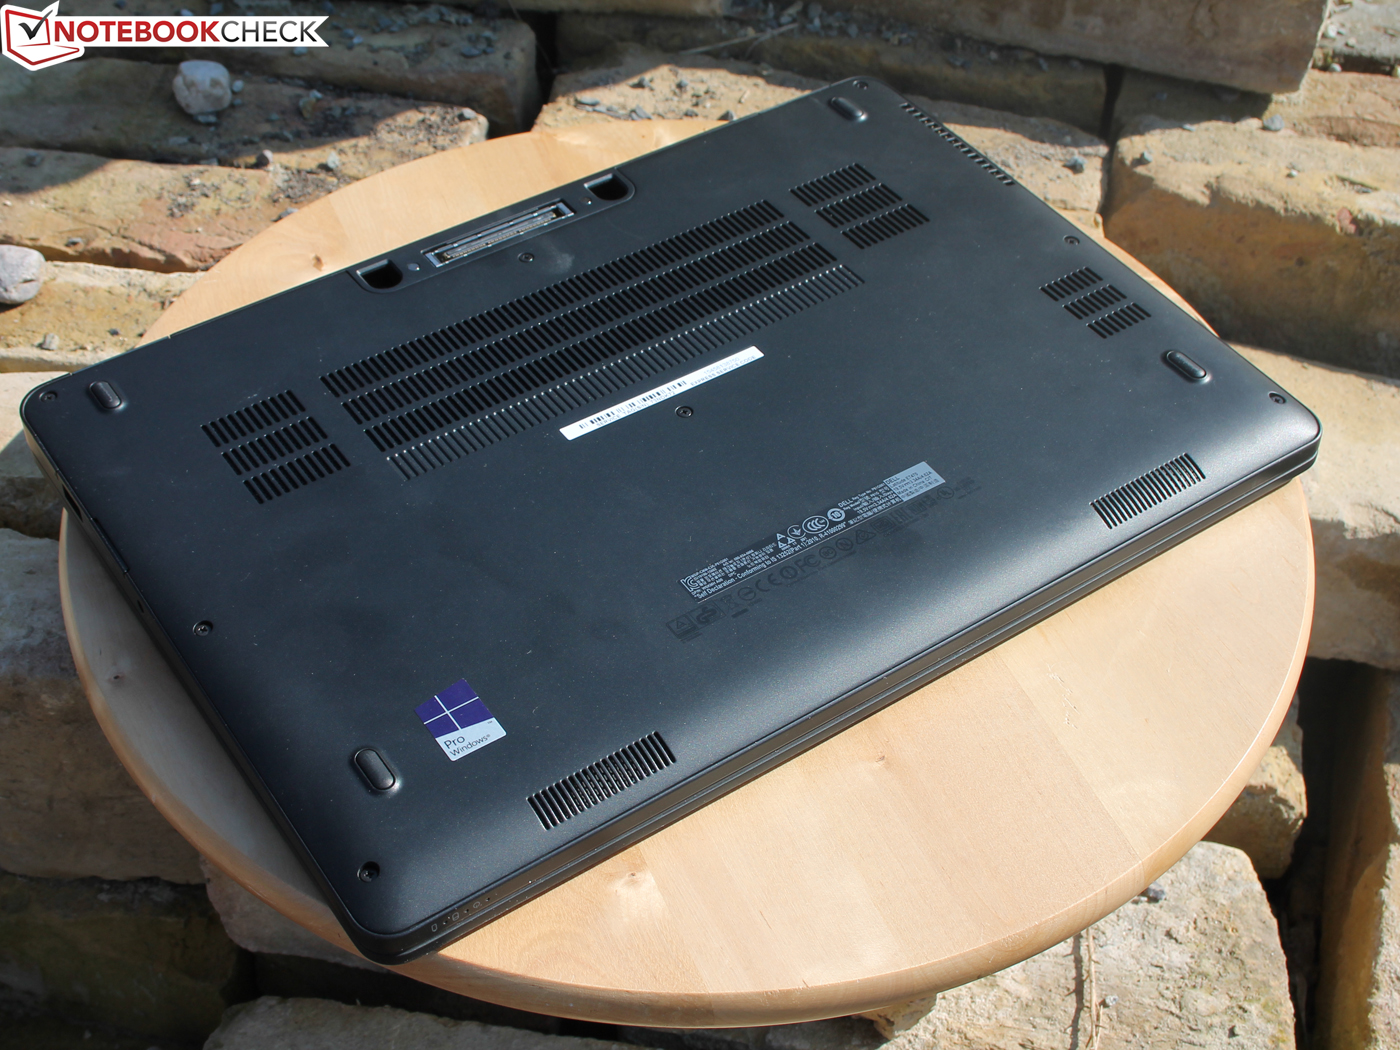
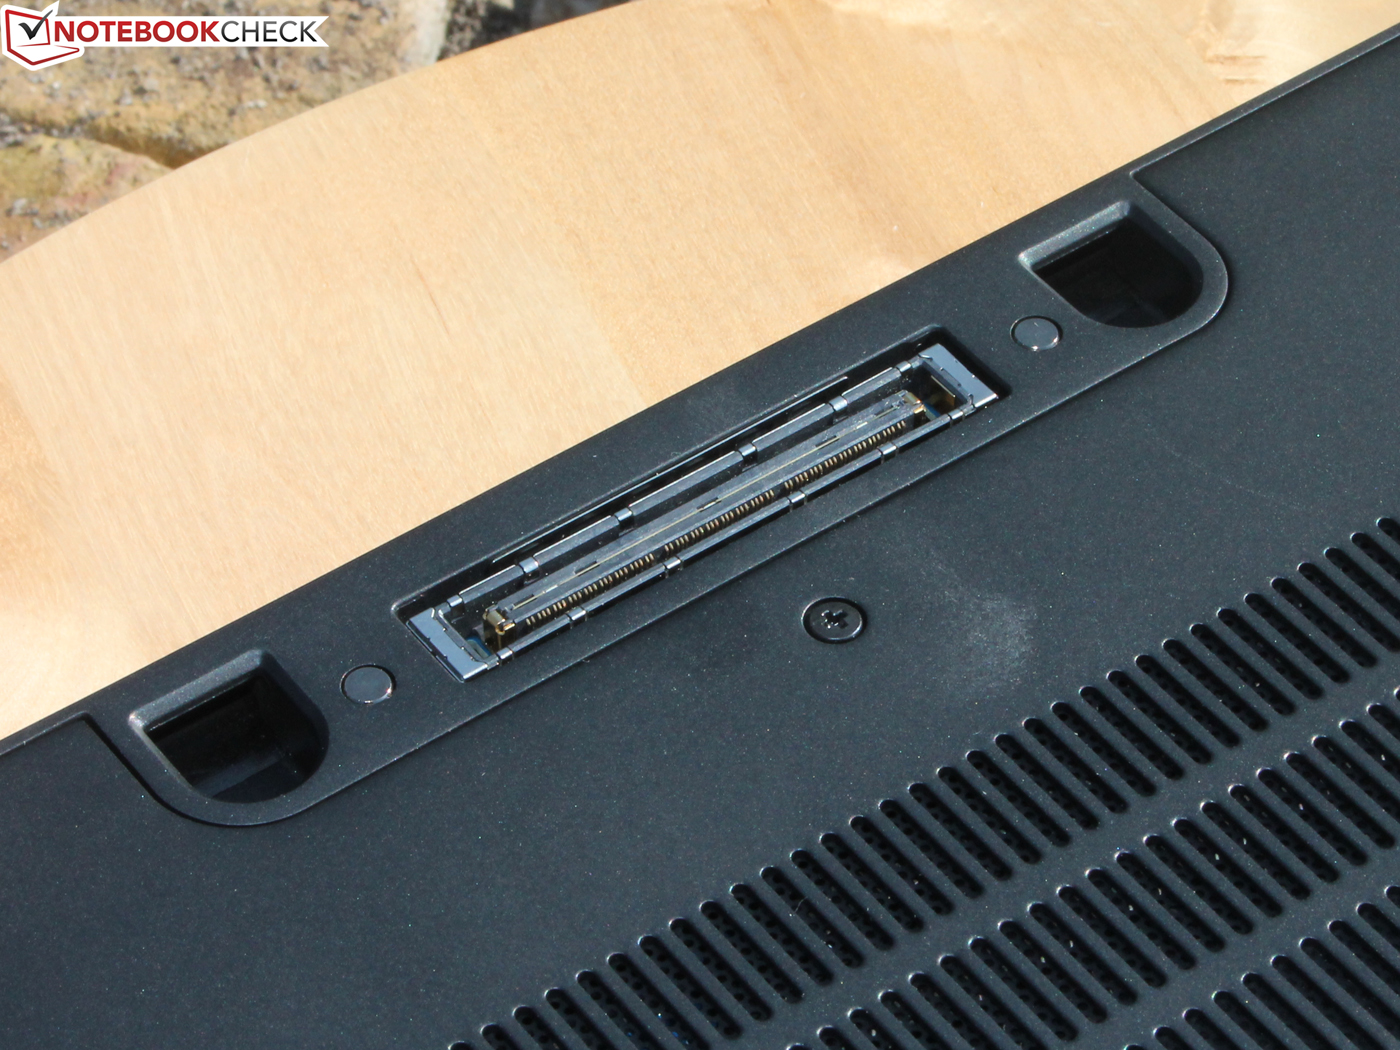
Dell resta fedele alla sua filosofia e non rinuncia a nessuna features per il successor del suo Ultrabooks business. Questo dispositivo da 14" è ben realizzato ed in grado di gestire applicazioni business e di altro tipo. Tuttavia il touchscreen lucido, crea fastidiosi riflessi sotto la luce del sole. Il pannello WQHD convince con eccellenti specifiche in cambio, molto convincenti in ambienti chiusi. Eccellenti dispositivi di input sono obbligatori per un Latitude high-end, e l'E7470 non delude. Lo stesso vale per l'utilizzo e la sicurezza: raramente un portatile ha ha tante features di sicurezza (opzionali). La manutenzione è da citare; basta rimuovere la cover inferiore e si accede a tutti i componenti.
L'unica pecca è l'autonomia, non si va oltre 5:46 ore nel test Wi-Fi. Non siamo ai livelli attesi per un portatile da ben 2.300 Euro (~$2620). Le versioni con schermi HD o FHD hanno una durata maggiore in base alle nostre esperienze con configurazioni 4K ed FHD.
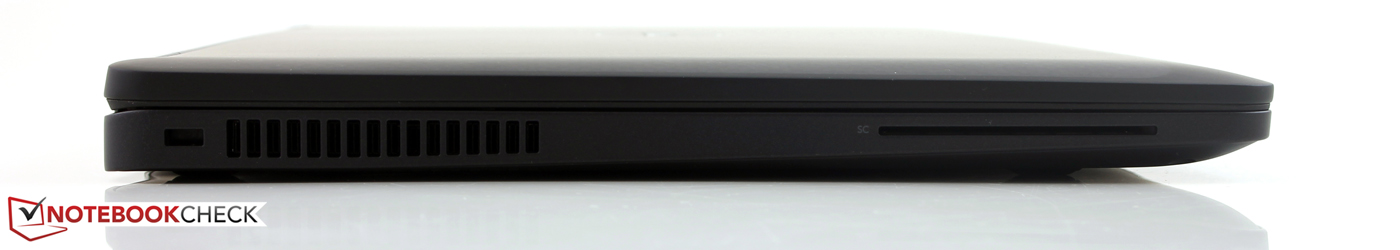
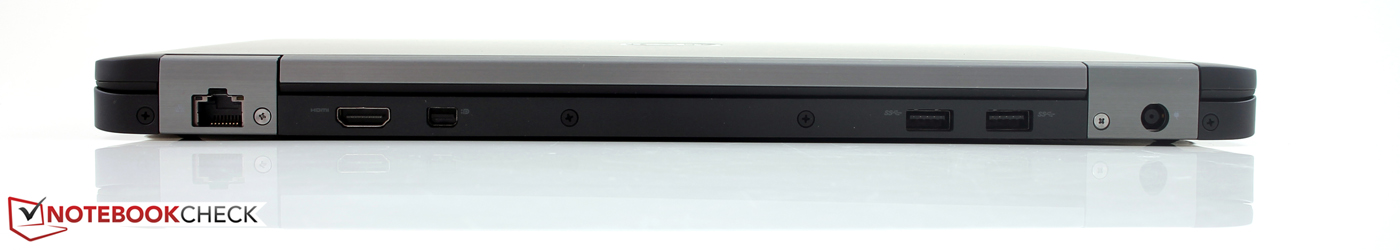
Forse la migliore alternativa è l'HP EliteBook Folio 1040 G2, ma anche la versione con un pannello matto FHD costa 200-300 Euro (~$227-~$341) in più. L'autonomia è migliore, ma il Folio 1040 G2 offre meno porte. La versione IGP del Lenovo ThinkPad T450s è interessante se volete risparmiare; una configurazione simile parte da circa 1.850 Euro (~$2107). Il rapporto prezzo-performance tra l'E7470 ed il T450s è abbastanza simile se confrontate le versioni FHD.
Aggiornamento 02/04/2016: ThinkPad T460s FHD IPS e T460s WQHD IPS sono stati aggiunti.
Nota: si tratta di una recensione breve, con alcune sezioni non tradotte, per la versione integrale in inglese guardate qui.
Dell Latitude 14 7000 Series E7470
-
03/23/2016 v5(old)
Sebastian Jentsch
Pricecompare
