 Deutsch
 English
 Español
 Français
 Italiano
 Nederlands
 Polski
 Português
 Русский
 Türkçe
 Svenska
 Chinese
 Magyar
Recensione breve del tablet Lenovo ThinkPad X1
| |||||||||||||||||||||||||
Distribuzione della luminosità: 85 %
Al centro con la batteria: 342.4 cd/m²
Contrasto: 460:1 (Nero: 0.744 cd/m²)
ΔE Color 5.33 | 0.5-29.43 Ø5
ΔE Greyscale 5.36 | 0.57-98 Ø5.3
93% sRGB (Argyll 1.6.3 3D)
57% AdobeRGB 1998 (Argyll 1.6.3 3D)
63.9% AdobeRGB 1998 (Argyll 2.2.0 3D)
93% sRGB (Argyll 2.2.0 3D)
62.4% Display P3 (Argyll 2.2.0 3D)
Gamma: 2.12
| Lenovo ThinkPad X1 Tablet 12.00, 2160x1440 | Dell XPS 12 9250 4K 12.50, 3840x2160 | HP Spectre x2 12-a003ng K3D42EA 12.00, 1920x1080 | Asus Zenbook UX305CA-FB055T 13.30, 3200x1800 | Toshiba Portege Z20t-B-10C 12.50, 1920x1080 | Microsoft Surface Pro 4, Core m3 12.30, 2736x1824 | |
|---|---|---|---|---|---|---|
| Display | 32% | -19% | -6% | -32% | 7% | |
| Display P3 Coverage | 62.4 | 83.9 34% | 52.9 -15% | 59.1 -5% | 42.63 -32% | 67.5 8% |
| sRGB Coverage | 93 | 99.8 7% | 71.8 -23% | 85.5 -8% | 63.6 -32% | 96.6 4% |
| AdobeRGB 1998 Coverage | 63.9 | 98.1 54% | 52.6 -18% | 61 -5% | 44.1 -31% | 69 8% |
| Response Times | 75% | -57% | 152% | -72% | ||
| Response Time Grey 50% / Grey 80% * | 28.4 ? | 36 ? -27% | 47 ? -65% | 38 ? -34% | 46 ? -62% | |
| Response Time Black / White * | 17.6 ? | 35 ? -99% | 26 ? -48% | 27 ? -53% | 31 ? -76% | |
| PWM Frequency | 222.2 ? | 1000 ? 350% | 1429 ? 543% | 50 ? -77% | ||
| Screen | 42% | 7% | 15% | -8% | 44% | |
| Brightness middle | 342.4 | 437 28% | 353 3% | 390 14% | 342 0% | 389.2 14% |
| Brightness | 315 | 399 27% | 347 10% | 352 12% | 301 -4% | 392 24% |
| Brightness Distribution | 85 | 81 -5% | 91 7% | 81 -5% | 76 -11% | 92 8% |
| Black Level * | 0.744 | 0.35 53% | 0.44 41% | 0.69 7% | 0.393 47% | 0.27 64% |
| Contrast | 460 | 1249 172% | 802 74% | 565 23% | 870 89% | 1441 213% |
| Colorchecker dE 2000 * | 5.33 | 3.56 33% | 6.09 -14% | 3.04 43% | 9.69 -82% | 3.61 32% |
| Colorchecker dE 2000 max. * | 9.25 | 9.3 -1% | 7.01 24% | |||
| Greyscale dE 2000 * | 5.36 | 2.67 50% | 6.24 -16% | 2.88 46% | 9.27 -73% | 3.8 29% |
| Gamma | 2.12 104% | 2.17 101% | 2.41 91% | 2.43 91% | 2.95 75% | 2.16 102% |
| CCT | 7671 85% | 6681 97% | 7238 90% | 6848 95% | 6010 108% | 5969 109% |
| Color Space (Percent of AdobeRGB 1998) | 57 | 86 51% | 46 -19% | 55 -4% | 40.4 -29% | 63 11% |
| Color Space (Percent of sRGB) | 93 | 100 8% | 71 -24% | 85 -9% | 97 4% | |
| Media totale (Programma / Settaggio) | 50% /
46% | -23% /
-8% | 54% /
37% | -20% /
-14% | -7% /
14% |
* ... Meglio usare valori piccoli
Tempi di risposta del Display
| ↔ Tempi di risposta dal Nero al Bianco | ||
|---|---|---|
| 17.6 ms ... aumenta ↗ e diminuisce ↘ combinato | ↗ 3.6 ms Incremento | 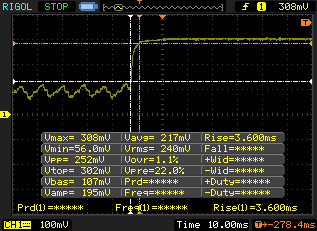 |
| ↘ 14 ms Calo | ||
| Lo schermo mostra buoni tempi di risposta durante i nostri tests, ma potrebbe essere troppo lento per i gamers competitivi. In confronto, tutti i dispositivi di test variano da 0.1 (minimo) a 240 (massimo) ms. » 34 % di tutti i dispositivi è migliore. Questo significa che i tempi di risposta rilevati sono migliori rispettto alla media di tutti i dispositivi testati (21.5 ms). | ||
| ↔ Tempo di risposta dal 50% Grigio all'80% Grigio | ||
| 28.4 ms ... aumenta ↗ e diminuisce ↘ combinato | ↗ 11.2 ms Incremento | 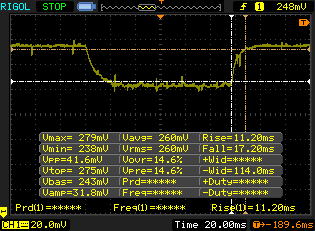 |
| ↘ 17.2 ms Calo | ||
| Lo schermo mostra tempi di risposta relativamente lenti nei nostri tests e potrebbe essere troppo lento per i gamers. In confronto, tutti i dispositivi di test variano da 0.2 (minimo) a 636 (massimo) ms. » 32 % di tutti i dispositivi è migliore. Questo significa che i tempi di risposta rilevati sono migliori rispettto alla media di tutti i dispositivi testati (33.7 ms). | ||
Sfarfallio dello schermo / PWM (Pulse-Width Modulation)
| flickering dello schermo / PWM rilevato | 222.2 Hz | ≤ 49 % settaggio luminosita' | 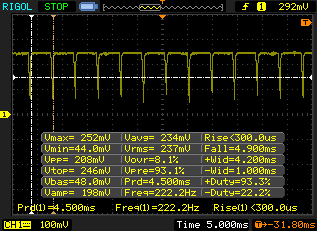 |
Il display sfarfalla a 222.2 Hz (Probabilmente a causa dell'uso di PWM) Flickering rilevato ad una luminosita' di 49 % o inferiore. Non dovrebbe verificarsi flickering o PWM sopra questo valore di luminosita'. La frequenza di 222.2 Hz è relativamente bassa, quindi gli utenti sensibili potrebbero notare il flickering ed accusare stanchezza agli occhi a questo livello di luminosità e a livelli inferiori. In confronto: 53 % di tutti i dispositivi testati non utilizza PWM per ridurre la luminosita' del display. Se è rilevato PWM, una media di 17924 (minimo: 5 - massimo: 3846000) Hz è stata rilevata. | |||
| wPrime 2.10 - 1024m (ordina per valore) | |
| Lenovo ThinkPad X1 Tablet | |
| Microsoft Surface Pro 4, Core m3 | |
| Super Pi Mod 1.5 XS 32M - 32M (ordina per valore) | |
| Lenovo ThinkPad X1 Tablet | |
| HP Spectre x2 12-a003ng K3D42EA | |
| Toshiba Portege Z20t-B-10C | |
| Microsoft Surface Pro 4, Core m3 | |
* ... Meglio usare valori piccoli
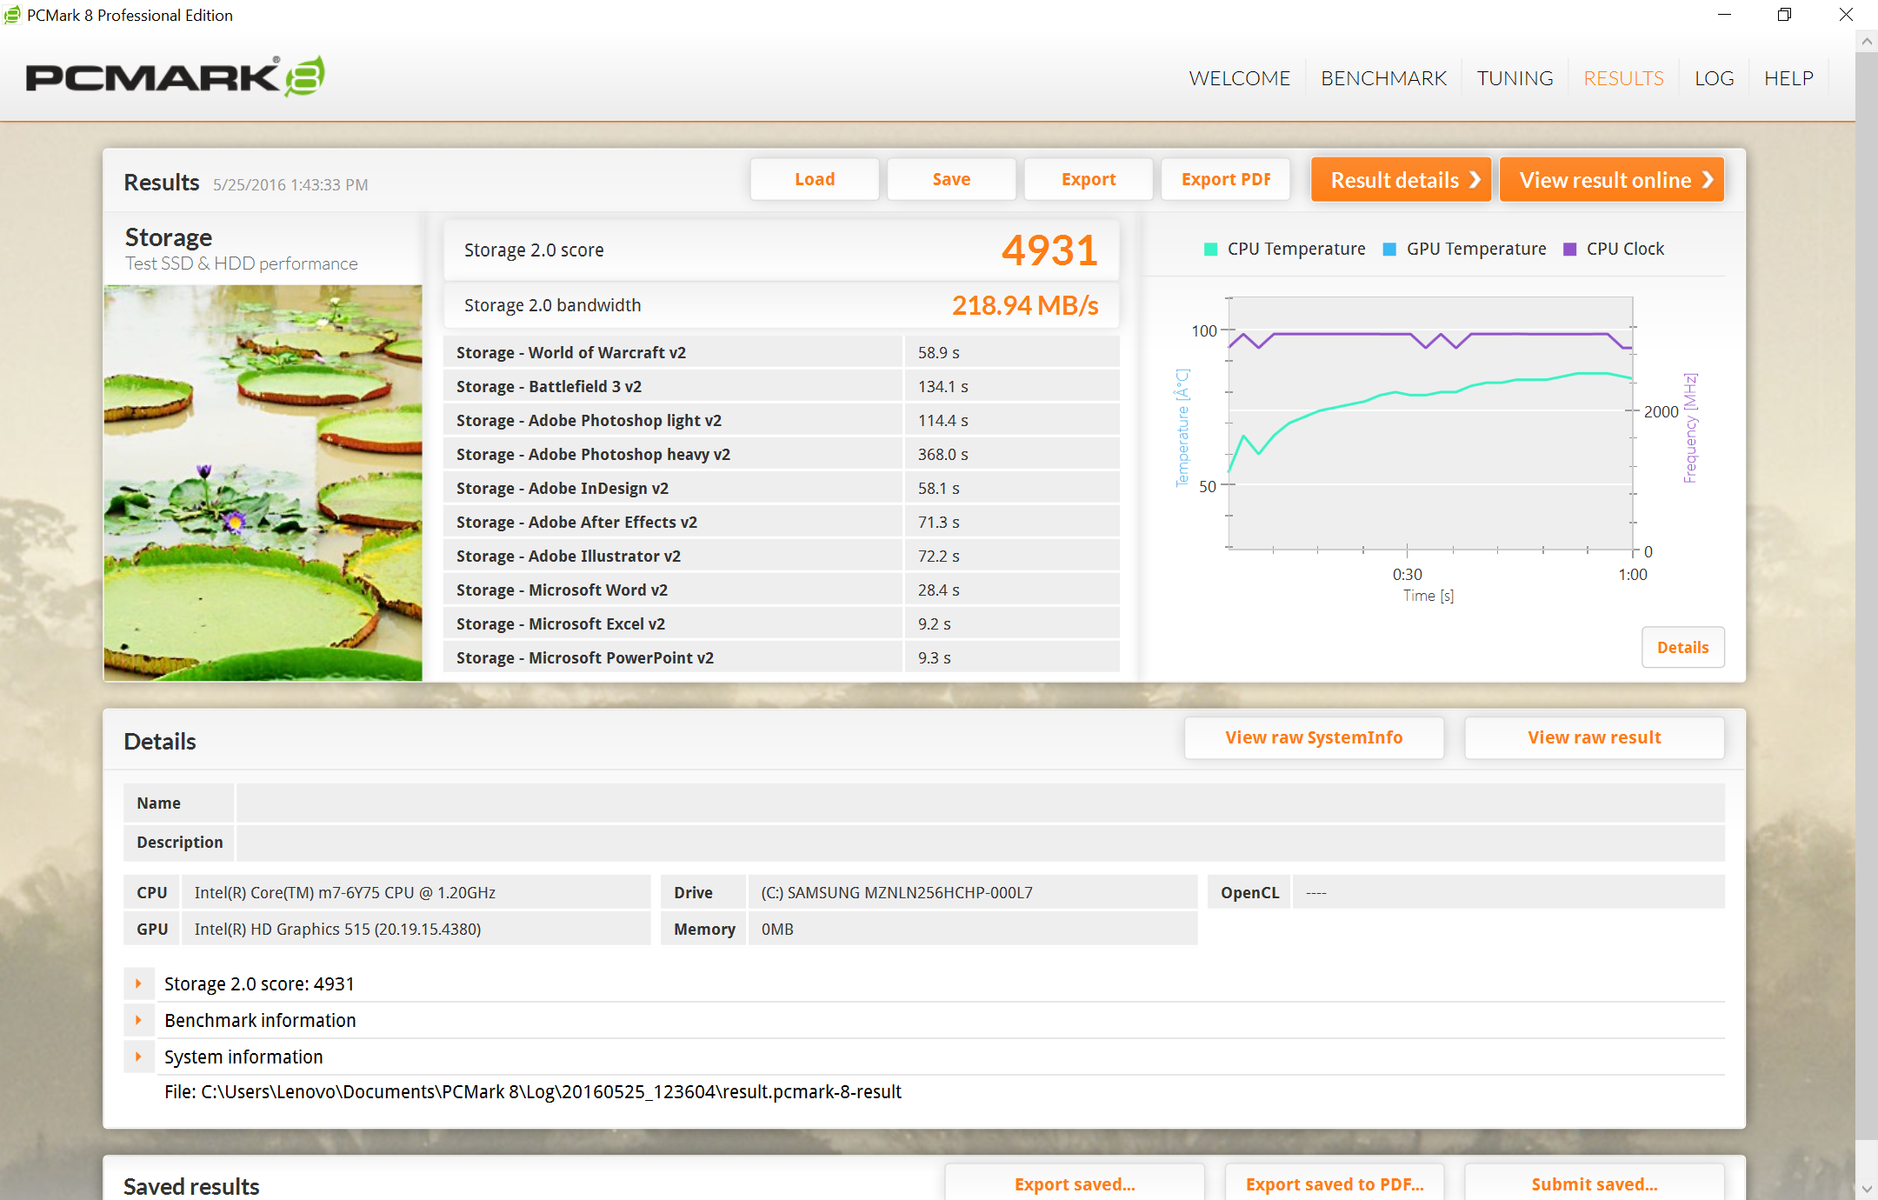
| PCMark 8 Home Score Accelerated v2 | 2976 punti | |
| PCMark 8 Creative Score Accelerated v2 | 3583 punti | |
| PCMark 8 Work Score Accelerated v2 | 4058 punti | |
Aiuto | ||

| 3DMark | |
| 1280x720 Cloud Gate Standard Graphics (ordina per valore) | |
| Lenovo ThinkPad X1 Tablet | |
| Dell XPS 12 9250 4K | |
| HP Spectre x2 12-a003ng K3D42EA | |
| Asus Zenbook UX305CA-FB055T | |
| Toshiba Portege Z20t-B-10C | |
| Microsoft Surface Pro 4, Core m3 | |
| 1920x1080 Fire Strike Graphics (ordina per valore) | |
| Lenovo ThinkPad X1 Tablet | |
| Dell XPS 12 9250 4K | |
| HP Spectre x2 12-a003ng K3D42EA | |
| Asus Zenbook UX305CA-FB055T | |
| Toshiba Portege Z20t-B-10C | |
| Microsoft Surface Pro 4, Core m3 | |
| 1920x1080 Ice Storm Extreme Graphics (ordina per valore) | |
| Dell XPS 12 9250 4K | |
| 3DMark 06 Standard Score | 7515 punti | |
| 3DMark 11 Performance | 1283 punti | |
| 3DMark Ice Storm Standard Score | 46344 punti | |
| 3DMark Cloud Gate Standard Score | 4474 punti | |
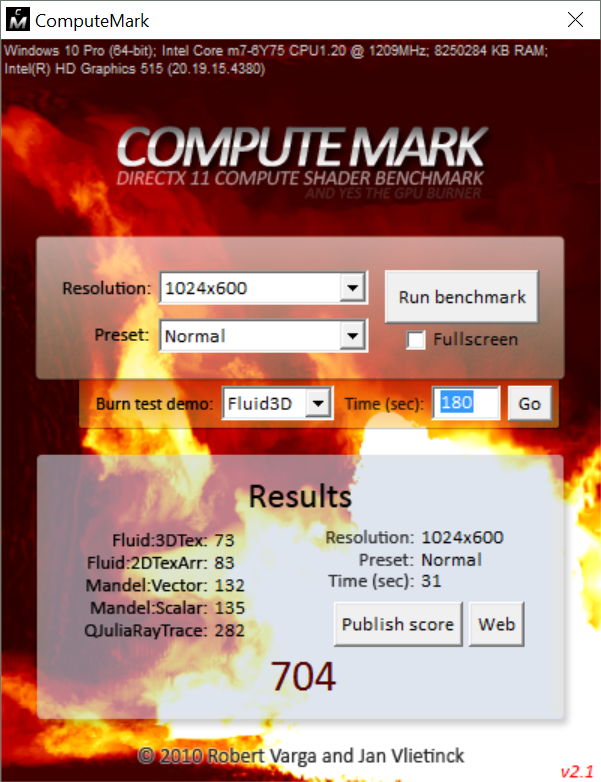
| 3DMark Fire Strike Score | 697 punti | |
Aiuto | ||
| BioShock Infinite | |
| 1280x720 Very Low Preset (ordina per valore) | |
| Lenovo ThinkPad X1 Tablet | |
| Dell XPS 12 9250 4K | |
| Asus Zenbook UX305CA-FB055T | |
| Microsoft Surface Pro 4, Core m3 | |
| 1366x768 Medium Preset (ordina per valore) | |
| Lenovo ThinkPad X1 Tablet | |
| Dell XPS 12 9250 4K | |
| Asus Zenbook UX305CA-FB055T | |
| Microsoft Surface Pro 4, Core m3 | |
| 1366x768 High Preset (ordina per valore) | |
| Lenovo ThinkPad X1 Tablet | |
| Dell XPS 12 9250 4K | |
| Asus Zenbook UX305CA-FB055T | |
| Microsoft Surface Pro 4, Core m3 | |
| 1920x1080 Ultra Preset, DX11 (DDOF) (ordina per valore) | |
| Lenovo ThinkPad X1 Tablet | |
| Dell XPS 12 9250 4K | |
| basso | medio | alto | ultra | |
| BioShock Infinite (2013) | 44 | 25 | 20 | 6 |
(-) La temperatura massima sul lato superiore è di 51.2 °C / 124 F, rispetto alla media di 35.3 °C / 96 F, che varia da 19.6 a 55.7 °C per questa classe Convertible.
(-) Il lato inferiore si riscalda fino ad un massimo di 53.2 °C / 128 F, rispetto alla media di 36.8 °C / 98 F
(±) In idle, la temperatura media del lato superiore è di 37.6 °C / 100 F, rispetto alla media deld ispositivo di 30.2 °C / 86 F.
(-) I poggiapolsi e il touchpad possono diventare molto caldi al tatto con un massimo di 51.2 °C / 124.2 F.
(-) La temperatura media della zona del palmo della mano di dispositivi simili e'stata di 28.1 °C / 82.6 F (-23.1 °C / -41.6 F).
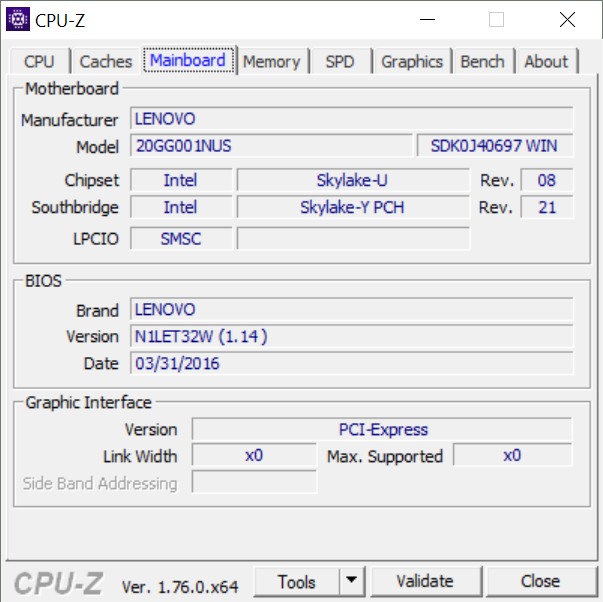
| Lenovo ThinkPad X1 Tablet HD Graphics 515, 6Y75, Samsung PM871 MZYLN256HCHP | Dell XPS 12 9250 4K HD Graphics 515, 6Y75, Samsung PM951 NVMe 512 GB | HP Spectre x2 12-a003ng K3D42EA HD Graphics 515, 6Y75, Sandisk X300 SD7SN6S-256G-1006 | Asus Zenbook UX305CA-FB055T HD Graphics 515, 6Y75, Micron M600 MTFDDAV512MBF M.2 | Toshiba Portege Z20t-B-10C HD Graphics 5300, 5Y71, Toshiba HG6 THNSNJ256GVNU | |
|---|---|---|---|---|---|
| Power Consumption | -34% | -4% | -6% | 17% | |
| Idle Minimum * | 5.87 | 5.4 8% | 4.5 23% | 4.2 28% | 2.4 59% |
| Idle Average * | 6.05 | 10.2 -69% | 7.7 -27% | 8.4 -39% | 4.6 24% |
| Idle Maximum * | 6.13 | 12.5 -104% | 8.3 -35% | 8.9 -45% | 5.6 9% |
| Load Average * | 21.27 | 21.4 -1% | 19.8 7% | 15.9 25% | 15.6 27% |
| Load Maximum * | 23.03 | 24.4 -6% | 20.6 11% | 22.5 2% | 30.7 -33% |
* ... Meglio usare valori piccoli
| Off / Standby | |
| Idle | |
| Sotto carico |
|
Leggenda:
min: Attualmente utilizziamo il Metrahit Energy, un multimetro digitale professionale per la misurazione della qualità della potenza e dell'energia monofase, per le nostre misurazioni. | |
| Lenovo ThinkPad X1 Tablet HD Graphics 515, 6Y75, Samsung PM871 MZYLN256HCHP | Dell XPS 12 9250 4K HD Graphics 515, 6Y75, Samsung PM951 NVMe 512 GB | HP Spectre x2 12-a003ng K3D42EA HD Graphics 515, 6Y75, Sandisk X300 SD7SN6S-256G-1006 | Asus Zenbook UX305CA-FB055T HD Graphics 515, 6Y75, Micron M600 MTFDDAV512MBF M.2 | Toshiba Portege Z20t-B-10C HD Graphics 5300, 5Y71, Toshiba HG6 THNSNJ256GVNU | Microsoft Surface Pro 4, Core m3 HD Graphics 515, 6Y30, Samsung MZFLV128 NVMe | |
|---|---|---|---|---|---|---|
| Autonomia della batteria | -27% | 38% | 50% | 168% | 35% | |
| Reader / Idle | 628 | 370 -41% | 954 52% | 1013 61% | 1616 157% | 791 26% |
| WiFi v1.3 | 300 | 243 -19% | 361 20% | 402 34% | 760 153% | 488 63% |
| Load | 118 | 93 -21% | 166 41% | 182 54% | 348 195% | 138 17% |
Pro
Contro
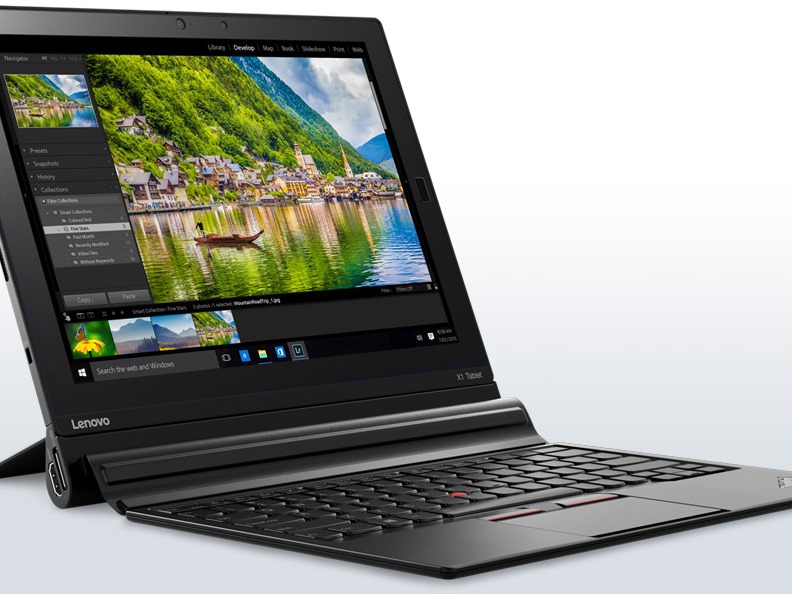
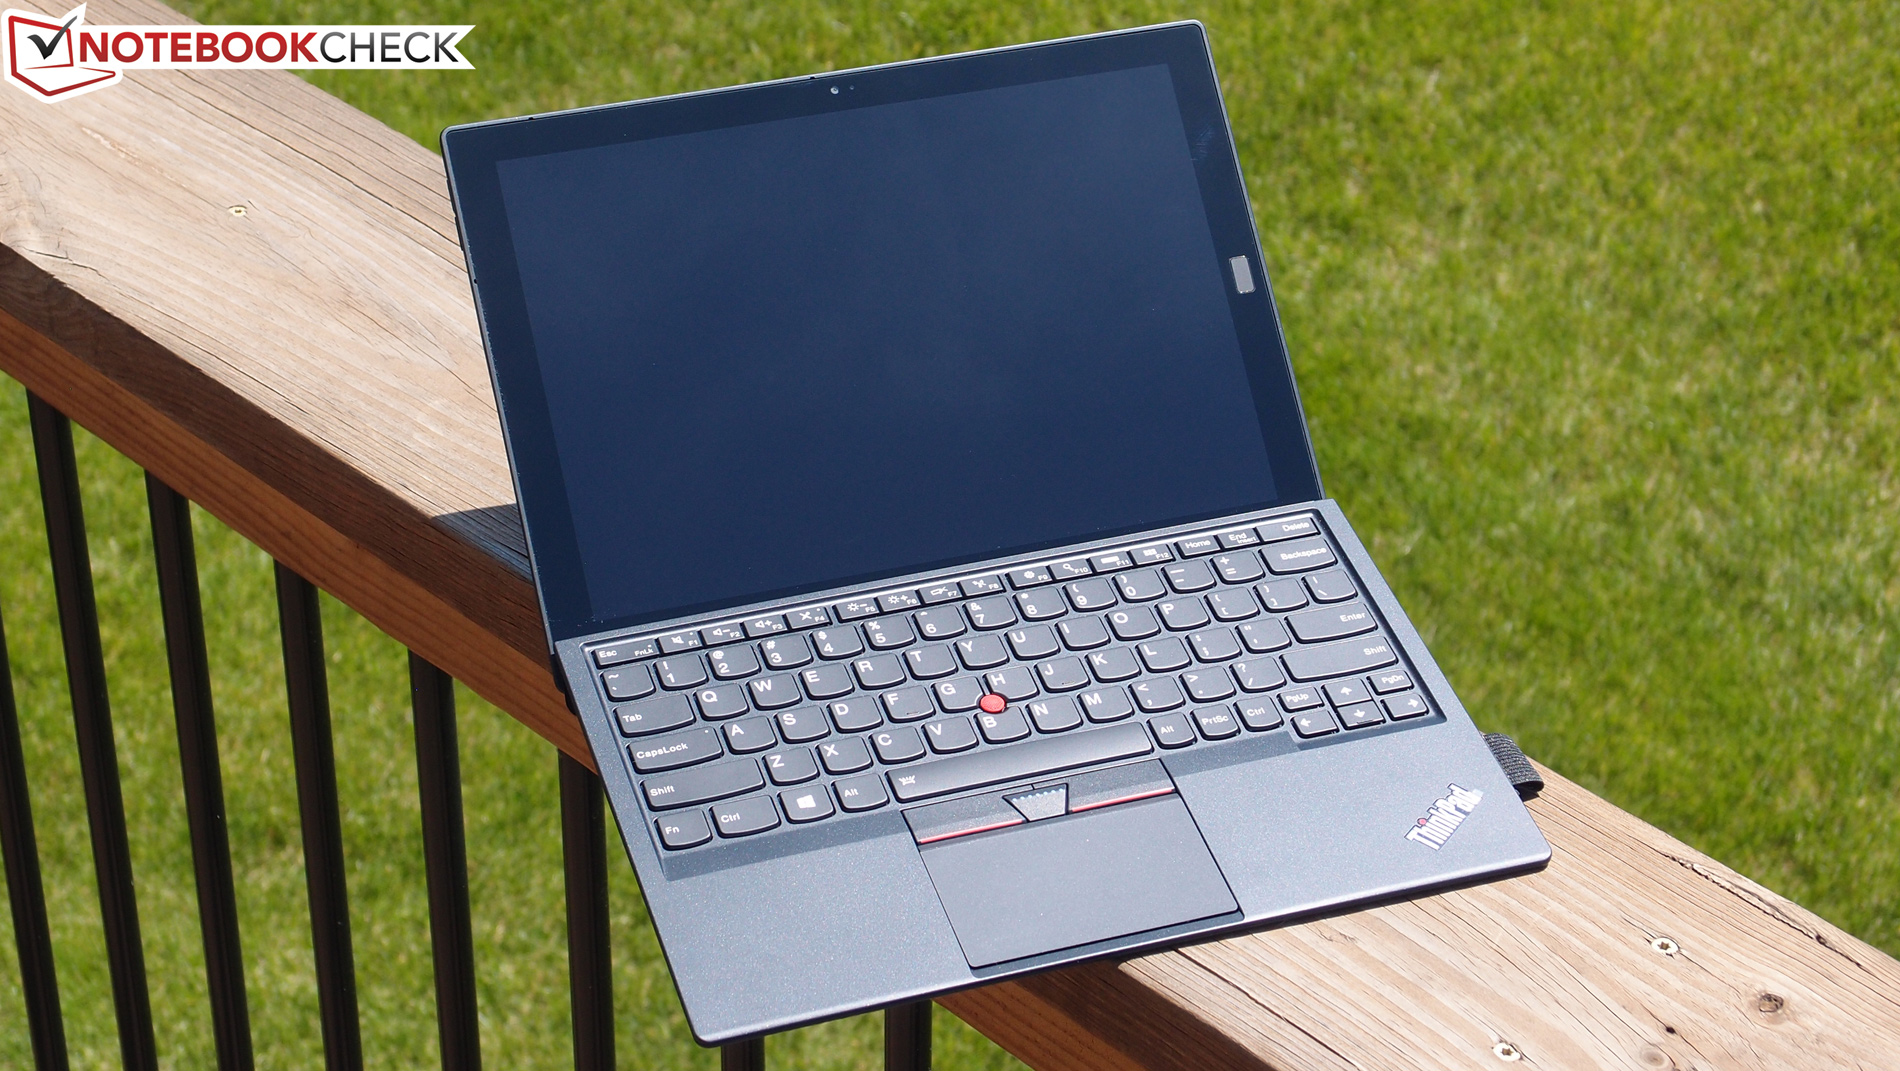
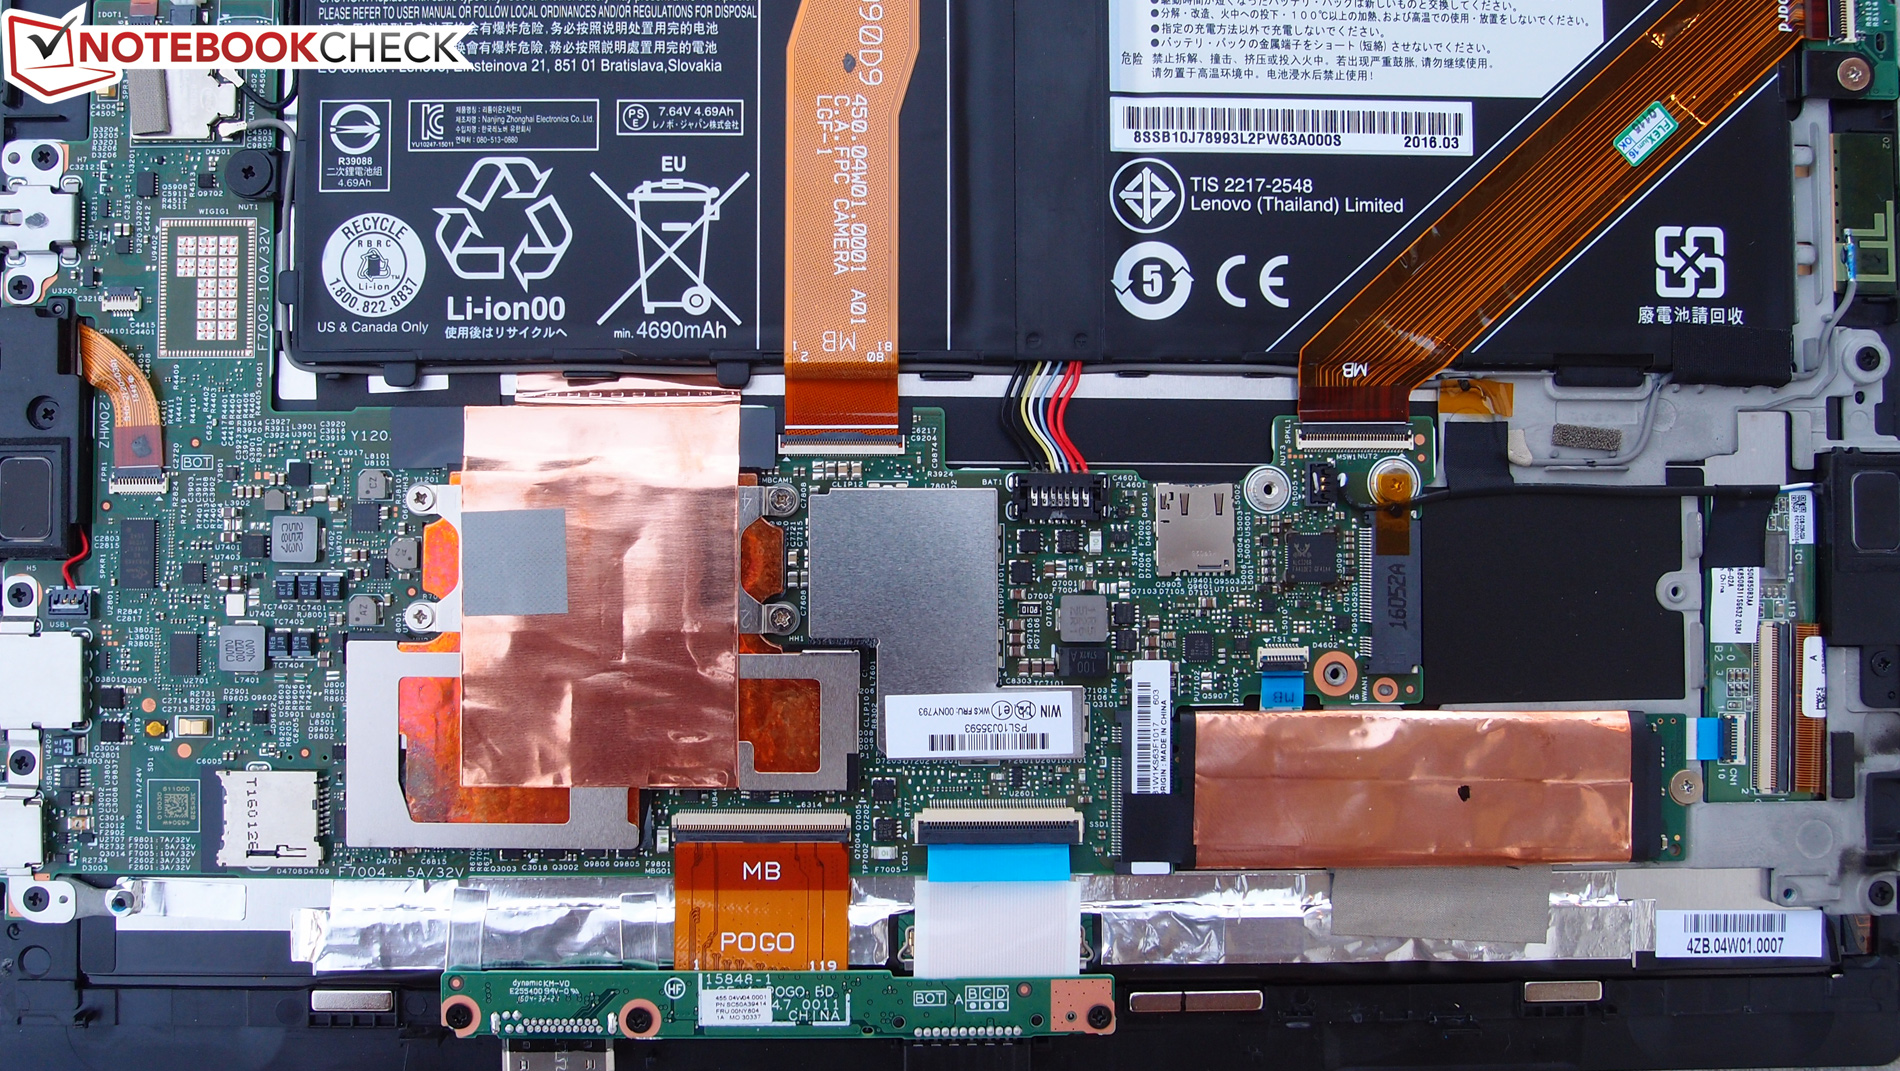
Lenovo è sempre stato uno dei pionieri del mercato dei convertibili, ma il tablet X1 ($1.549 al momento della recensione) è il primo tentativo del produttore nei dispositivi in stile Microsoft Surface. L'obiettivo di questo dispositivo è quello di creare un'alternativa per il settore business al Surface Pro—e in diverse parti ci riesce. Il tablet X1 non è solo dotato di un'ottima usabilità grazie agli ottimi dispositivi di input che ci si aspetta da un ThinkPad, ma anche di ottime prestazioni per un dispositivo con raffreddamento passivo, oltre alle ampie possibilità di manutenzione e a una serie di moduli venduti separatamente per espandere le funzioni e la selezione delle porte. Siamo stati decisamente colpiti dal nuovo design del kickstand, che rende l'utilizzo in grembo anche più comodo rispetto al Surface Pro.
Nonostante i suoi difetti, il tablet X1 è un ottimo primo tentativo per la creazione da parte di Lenovo di una buona alternativa al Surface Pro 4, e gli utenti (o le aziende) interessate al concetto potrebbero trovarlo perfetto.
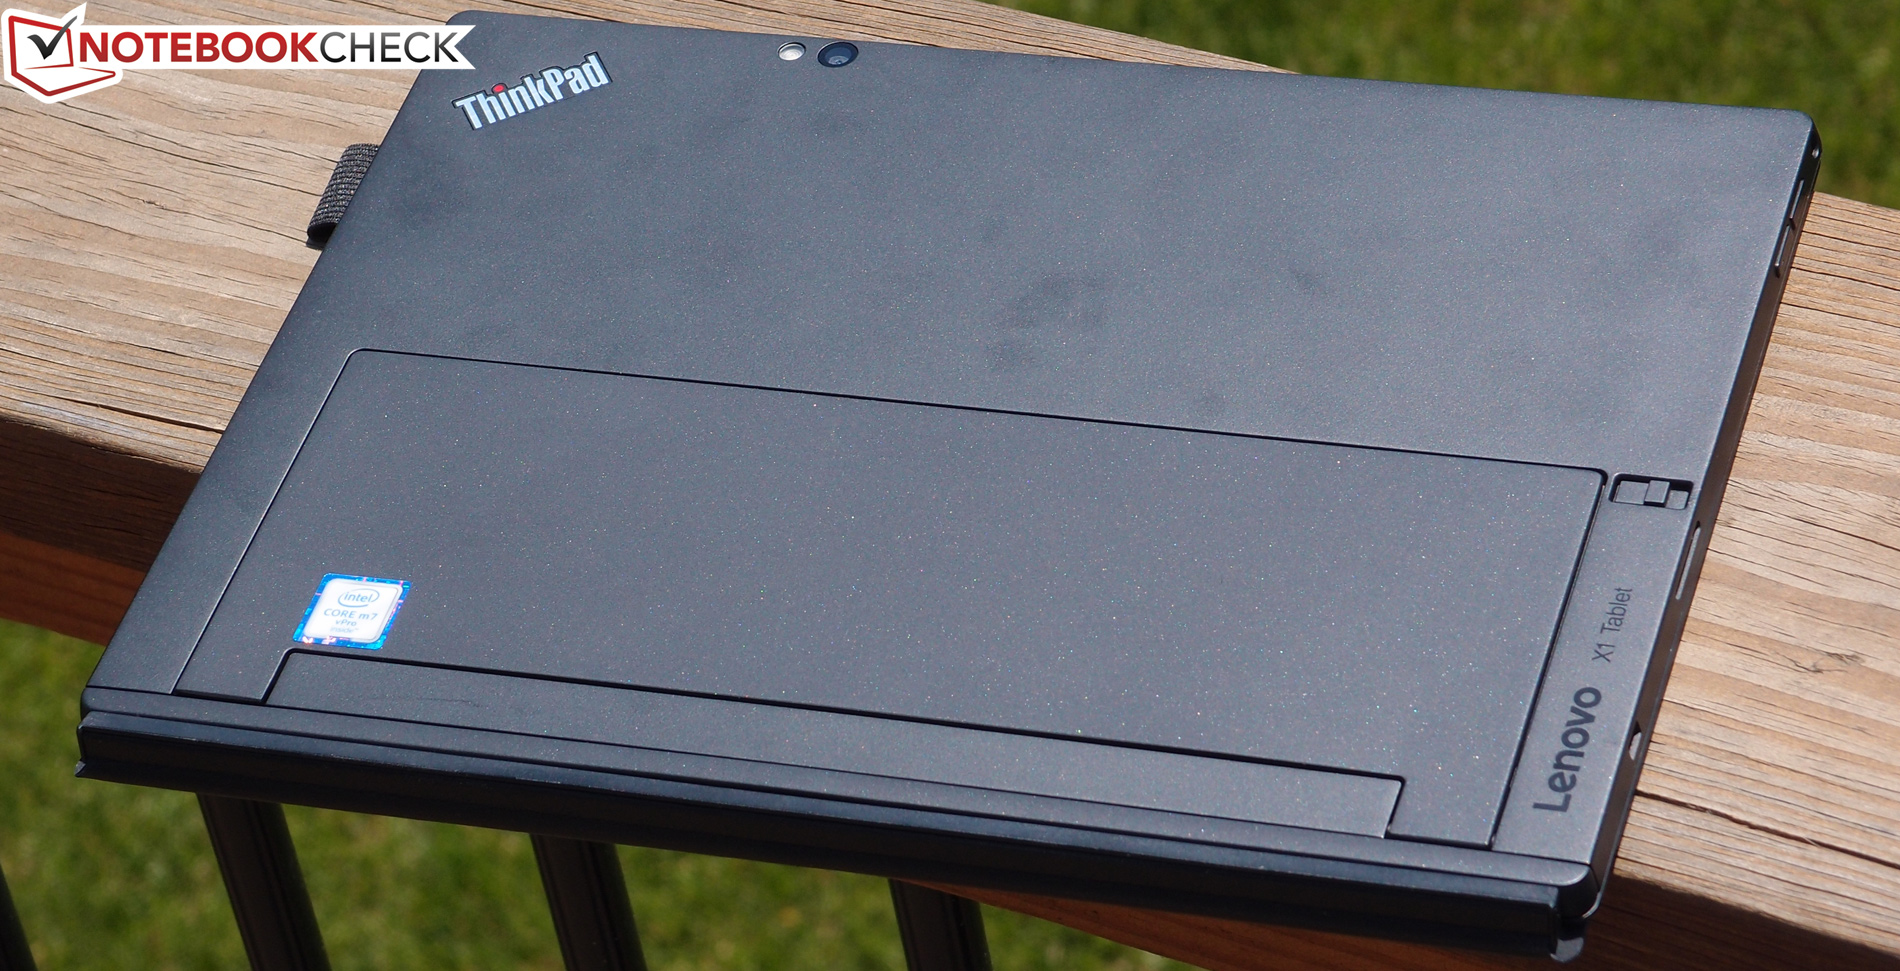
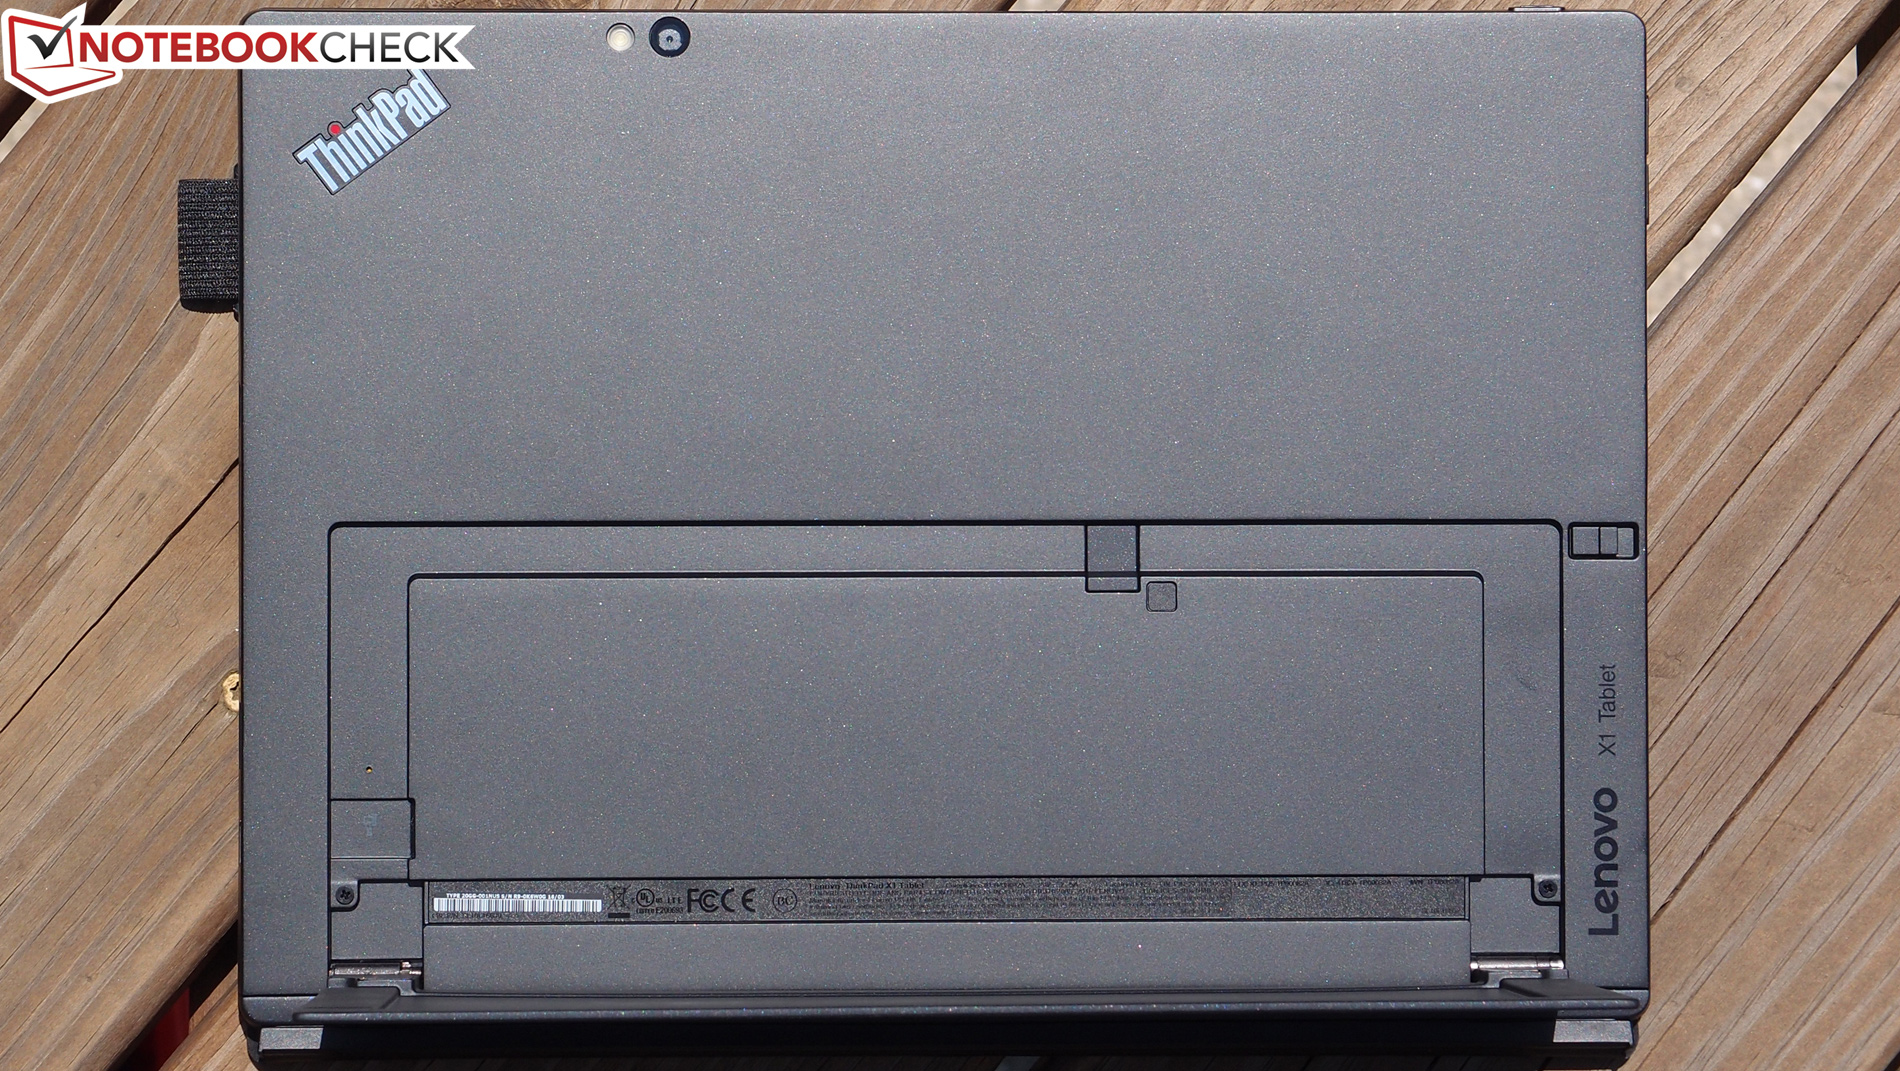
Tuttavia, occorre dare un'occhiata a una serie di considerazioni. Per iniziare, anche se si tratta di un ThinkPad, l'utilizzo di un pannello posteriore e di plastica ibrida PPS per una parte dei materiali di costruzione rende la resistenza alla torsione inferiore rispetto ai modelli con unibody in magnesio (come il Surface Pro). Inoltre, scalda molto (o per lo meno ha scaldato molto il dispositivo da noi provato), quindi dopo un certo periodo è scomodo da utilizzare. Mentre abbiamo valutato la configurazione top con Core m7, ci siamo chiesti se la spesa superiore di circa $350 rispetto al modello m3 ne valesse la pena, considerando anche i problemi di riscaldamento. Inoltre, l'autonomia della batteria è inferiore a praticamente tutti i rivali diretti e non è granché neppure considerando i più grandi ultrabook con raffreddamento attivo.
Probabilmente l'acquisto di un modello Core m3 o m5 potrebbe alleviare alcuni di questi problemi senza particolari compromessi relativamente alle prestazioni, ma con il bonus di un certo risparmio.
Lenovo ThinkPad X1 Tablet
-
06/02/2016 v5.1(old)
Steve Schardein
Pricecompare
