 Deutsch
 English
 Español
 Français
 Italiano
 Nederlands
 Polski
 Português
 Русский
 Türkçe
 Svenska
 Chinese
 Magyar
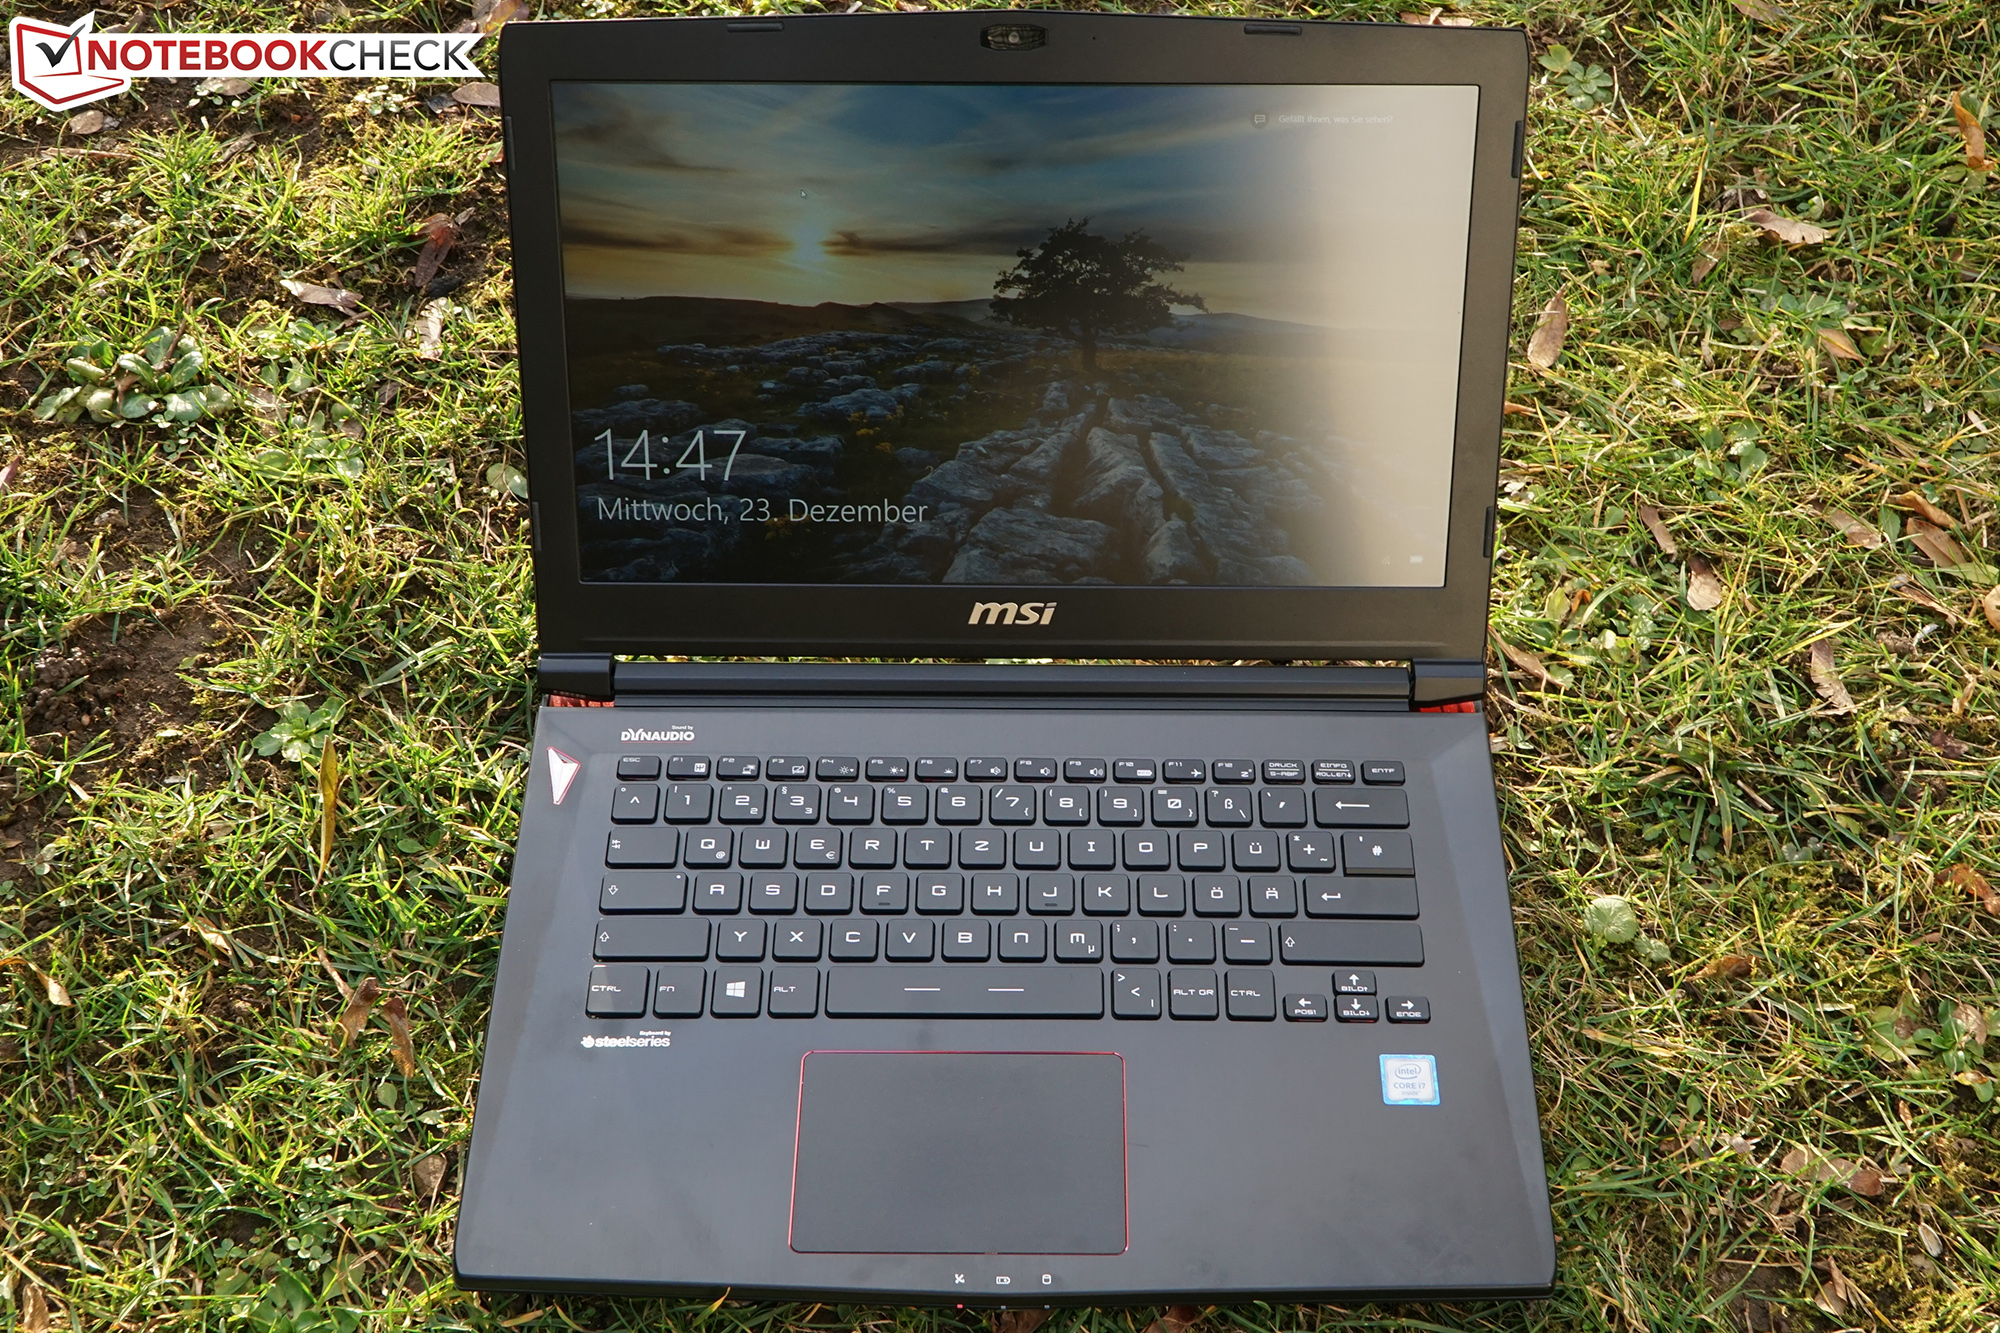
Recensione breve del portatile MSI GS40 6QE Phantom


| |||||||||||||||||||||||||
Distribuzione della luminosità: 88 %
Al centro con la batteria: 304 cd/m²
Contrasto: 822:1 (Nero: 0.37 cd/m²)
ΔE Color 7.47 | 0.5-29.43 Ø5
ΔE Greyscale 6.51 | 0.57-98 Ø5.3
86% sRGB (Argyll 1.6.3 3D)
56% AdobeRGB 1998 (Argyll 1.6.3 3D)
62.6% AdobeRGB 1998 (Argyll 2.2.0 3D)
85.7% sRGB (Argyll 2.2.0 3D)
66.2% Display P3 (Argyll 2.2.0 3D)
Gamma: 3.71
| MSI GS40-6QE16H11 LG Philips LP140WF3-SPD1 (LGD046D), IPS, 14.00, 1920x1080 | SCHENKER XMG P406 LG Philips 140WF1 (LGD040A), IPS, 14.00, 1920x1080 | Gigabyte P34W V3 AU Optronics B140HAN01.1, IPS, 14.00, 1920x1080 | SCHENKER XMG C405 AU Optronics B140HAN01.1 (AUO113ED), AHVA, 14.00, 1920x1080 | Asus Zenbook UX303UB-R4100T ChiMei N133HSE-EA3, IPS, 13.30, 1920x1080 | Alienware 15 R2 (Skylake) Samsung 4NDDJ_156HL (SDC4C48), IPS, 15.60, 1920x1080 | |
|---|---|---|---|---|---|---|
| Display | -2% | 7% | 4% | 6% | -34% | |
| Display P3 Coverage | 66.2 | 66.2 0% | 69.4 5% | 66.8 1% | 66.9 1% | 40.3 -39% |
| sRGB Coverage | 85.7 | 82.8 -3% | 92.6 8% | 89.6 5% | 92.3 8% | 60.2 -30% |
| AdobeRGB 1998 Coverage | 62.6 | 60.5 -3% | 67.4 8% | 65.6 5% | 67.6 8% | 41.67 -33% |
| Response Times | -56% | -86% | -40% | |||
| Response Time Grey 50% / Grey 80% * | 31 ? | 56 ? -81% | 68 ? -119% | 48.8 ? -57% | ||
| Response Time Black / White * | 23 ? | 30 ? -30% | 35 ? -52% | 28 ? -22% | ||
| PWM Frequency | 178 ? | 200 ? | ||||
| Screen | 15% | -1% | 7% | 20% | -8% | |
| Brightness middle | 304 | 282 -7% | 305.4 0% | 280 -8% | 385 27% | 180 -41% |
| Brightness | 282 | 266 -6% | 277 -2% | 267 -5% | 394 40% | 179 -37% |
| Brightness Distribution | 88 | 81 -8% | 84 -5% | 85 -3% | 89 1% | 83 -6% |
| Black Level * | 0.37 | 0.22 41% | 0.72 -95% | 0.32 14% | 0.41 -11% | 0.19 49% |
| Contrast | 822 | 1282 56% | 424 -48% | 875 6% | 939 14% | 947 15% |
| Colorchecker dE 2000 * | 7.47 | 4.98 33% | 2.81 62% | 4.75 36% | 3.84 49% | 6.74 10% |
| Greyscale dE 2000 * | 6.51 | 4.08 37% | 1.92 71% | 5.91 9% | 3.79 42% | 6.44 1% |
| Gamma | 3.71 59% | 2.51 88% | 2.21 100% | 2.52 87% | 2.23 99% | 2.29 96% |
| CCT | 7840 83% | 5877 111% | 6384 102% | 5742 113% | 6499 100% | 6465 101% |
| Color Space (Percent of AdobeRGB 1998) | 56 | 54 -4% | 60.4 8% | 59 5% | 60 7% | 38 -32% |
| Color Space (Percent of sRGB) | 86 | 83 -3% | 92 7% | 60 -30% | ||
| Colorchecker dE 2000 max. * | 10.2 | |||||
| Media totale (Programma / Settaggio) | -14% /
2% | 3% /
1% | 6% /
6% | -20% /
2% | -27% /
-18% |
* ... Meglio usare valori piccoli
Tempi di risposta del Display
| ↔ Tempi di risposta dal Nero al Bianco | ||
|---|---|---|
| 23 ms ... aumenta ↗ e diminuisce ↘ combinato | ↗ 5 ms Incremento | 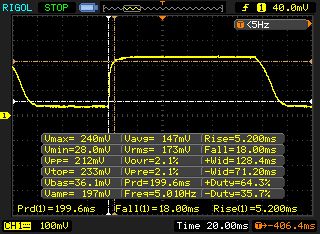 |
| ↘ 18 ms Calo | ||
| Lo schermo mostra buoni tempi di risposta durante i nostri tests, ma potrebbe essere troppo lento per i gamers competitivi. In confronto, tutti i dispositivi di test variano da 0.1 (minimo) a 240 (massimo) ms. » 45 % di tutti i dispositivi è migliore. Questo significa che i tempi di risposta rilevati sono simili alla media di tutti i dispositivi testati (21.5 ms). | ||
| ↔ Tempo di risposta dal 50% Grigio all'80% Grigio | ||
| 31 ms ... aumenta ↗ e diminuisce ↘ combinato | ↗ 12 ms Incremento | 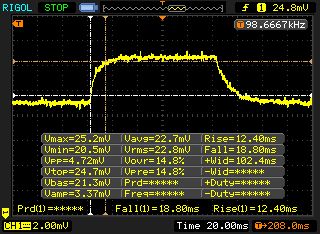 |
| ↘ 19 ms Calo | ||
| Lo schermo mostra tempi di risposta lenti nei nostri tests e sarà insoddisfacente per i gamers. In confronto, tutti i dispositivi di test variano da 0.2 (minimo) a 636 (massimo) ms. » 35 % di tutti i dispositivi è migliore. Questo significa che i tempi di risposta rilevati sono simili alla media di tutti i dispositivi testati (33.8 ms). | ||
Sfarfallio dello schermo / PWM (Pulse-Width Modulation)
| flickering dello schermo / PWM non rilevato | 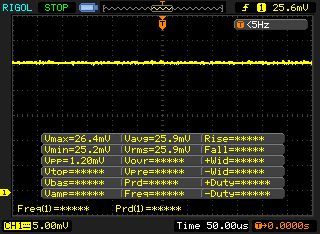 | ||
In confronto: 53 % di tutti i dispositivi testati non utilizza PWM per ridurre la luminosita' del display. Se è rilevato PWM, una media di 17951 (minimo: 5 - massimo: 3846000) Hz è stata rilevata. | |||
| Cinebench R15 | |
| CPU Multi 64Bit (ordina per valore) | |
| MSI GS40-6QE16H11 | |
| SCHENKER XMG P406 | |
| Gigabyte P34W V3 | |
| SCHENKER XMG C405 | |
| Asus Zenbook UX303UB-R4100T | |
| Alienware 15 R2 (Skylake) | |
| MSI GT72S 6QF | |
| CPU Single 64Bit (ordina per valore) | |
| MSI GS40-6QE16H11 | |
| SCHENKER XMG P406 | |
| Gigabyte P34W V3 | |
| SCHENKER XMG C405 | |
| Asus Zenbook UX303UB-R4100T | |
| Alienware 15 R2 (Skylake) | |
| MSI GT72S 6QF | |
| Cinebench R11.5 | |
| CPU Multi 64Bit (ordina per valore) | |
| MSI GS40-6QE16H11 | |
| SCHENKER XMG P406 | |
| Gigabyte P34W V3 | |
| SCHENKER XMG C405 | |
| Asus Zenbook UX303UB-R4100T | |
| Alienware 15 R2 (Skylake) | |
| MSI GT72S 6QF | |
| CPU Single 64Bit (ordina per valore) | |
| MSI GS40-6QE16H11 | |
| SCHENKER XMG P406 | |
| Gigabyte P34W V3 | |
| SCHENKER XMG C405 | |
| Asus Zenbook UX303UB-R4100T | |
| Alienware 15 R2 (Skylake) | |
| MSI GT72S 6QF | |
| PCMark 7 Score | 5451 punti | |
| PCMark 8 Home Score Accelerated v2 | 3776 punti | |
| PCMark 8 Creative Score Accelerated v2 | 4742 punti | |
| PCMark 8 Work Score Accelerated v2 | 4831 punti | |
Aiuto | ||
| PCMark 7 - Score (ordina per valore) | |
| MSI GS40-6QE16H11 | |
| SCHENKER XMG P406 | |
| Gigabyte P34W V3 | |
| Asus Zenbook UX303UB-R4100T | |
| Alienware 15 R2 (Skylake) | |
| PCMark 8 | |
| Home Score Accelerated v2 (ordina per valore) | |
| MSI GS40-6QE16H11 | |
| SCHENKER XMG P406 | |
| Gigabyte P34W V3 | |
| SCHENKER XMG C405 | |
| Asus Zenbook UX303UB-R4100T | |
| Alienware 15 R2 (Skylake) | |
| Creative Score Accelerated v2 (ordina per valore) | |
| MSI GS40-6QE16H11 | |
| Gigabyte P34W V3 | |
| SCHENKER XMG C405 | |
| Asus Zenbook UX303UB-R4100T | |
| Alienware 15 R2 (Skylake) | |
| Work Score Accelerated v2 (ordina per valore) | |
| MSI GS40-6QE16H11 | |
| SCHENKER XMG P406 | |
| Gigabyte P34W V3 | |
| SCHENKER XMG C405 | |
| Asus Zenbook UX303UB-R4100T | |
| Alienware 15 R2 (Skylake) | |

| MSI GS40-6QE16H11 Samsung MZFLV128 NVMe | SCHENKER XMG P406 Samsung SM951 MZHPV256HDGL m.2 PCI-e | Gigabyte P34W V3 Lite-On LMT-128L9M | SCHENKER XMG C405 Crucial M550 CT256M550SSD3 | Asus Zenbook UX303UB-R4100T Micron M600 MTFDDAK512MBF | Alienware 15 R2 (Skylake) Samsung PM951 NVMe MZ-VLV256D | |
|---|---|---|---|---|---|---|
| CrystalDiskMark 3.0 | 20% | -48% | -36% | -44% | -19% | |
| Read Seq | 1332 | 1634 23% | 504 -62% | 517 -61% | 484.2 -64% | 1213 -9% |
| Write Seq | 687 | 1290 88% | 337.4 -51% | 496.6 -28% | 444.9 -35% | 306 -55% |
| Read 4k | 49.57 | 43.82 -12% | 33.13 -33% | 33.03 -33% | 28.74 -42% | 42.62 -14% |
| Write 4k | 138.8 | 110.3 -21% | 75 -46% | 111.3 -20% | 90.5 -35% | 143.7 4% |
| AS SSD | 165% | 64% | 98% | 62% | ||
| Seq Read | 1834 | 1875 2% | 487 -73% | 523 -71% | 514 -72% | |
| Seq Write | 289.1 | 1252 333% | 322.9 12% | 475.6 65% | 399.9 38% | |
| 4K Read | 45.54 | 39.68 -13% | 30.97 -32% | 30.61 -33% | 26.51 -42% | |
| 4K Write | 102.4 | 92 -10% | 67.9 -34% | 97.6 -5% | 76.1 -26% | |
| 4K-64 Read | 738 | 707 -4% | 366.8 -50% | 384.8 -48% | 308.1 -58% | |
| 4K-64 Write | 34.73 | 351.2 911% | 256.3 638% | 304.5 777% | 254 631% | |
| Access Time Read * | 0.062 | 0.061 2% | 0.094 -52% | 0.063 -2% | 0.11 -77% | |
| Access Time Write * | 4.234 | 0.042 99% | 0.054 99% | 0.046 99% | 0.064 98% | |
| Media totale (Programma / Settaggio) | 93% /
117% | 8% /
26% | 31% /
53% | 9% /
26% | -19% /
-19% |
* ... Meglio usare valori piccoli
| 3DMark 11 Performance | 9544 punti | |
| 3DMark Ice Storm Standard Score | 87313 punti | |
| 3DMark Cloud Gate Standard Score | 21133 punti | |
| 3DMark Fire Strike Score | 6530 punti | |
Aiuto | ||
| 3DMark | |
| 1920x1080 Fire Strike Score (ordina per valore) | |
| MSI GS40-6QE16H11 | |
| SCHENKER XMG P406 | |
| Gigabyte P55 V4 | |
| Gigabyte P34W V3 | |
| SCHENKER XMG C405 | |
| Asus Zenbook UX303UB-R4100T | |
| Alienware 15 R2 (Skylake) | |
| 1280x720 Cloud Gate Standard Score (ordina per valore) | |
| MSI GS40-6QE16H11 | |
| SCHENKER XMG P406 | |
| Gigabyte P55 V4 | |
| Gigabyte P34W V3 | |
| SCHENKER XMG C405 | |
| Asus Zenbook UX303UB-R4100T | |
| Alienware 15 R2 (Skylake) | |
| 3DMark 11 - 1280x720 Performance (ordina per valore) | |
| MSI GS40-6QE16H11 | |
| SCHENKER XMG P406 | |
| Gigabyte P55 V4 | |
| Gigabyte P34W V3 | |
| SCHENKER XMG C405 | |
| Asus Zenbook UX303UB-R4100T | |
| Alienware 15 R2 (Skylake) | |
| basso | medio | alto | ultra | |
| Tomb Raider (2013) | 307.5 | 270.3 | 185 | 86.6 |
| The Witcher 3 (2015) | 134.5 | 84.6 | 38.9 | 26.4 |
| Fallout 4 (2015) | 135.5 | 101.3 | 53.5 | 43.7 |
| Tomb Raider - 1920x1080 Ultra Preset AA:FX AF:16x (ordina per valore) | |
| MSI GS40-6QE16H11 | |
| Gigabyte P34W V3 | |
| SCHENKER XMG C405 | |
| Asus Zenbook UX303UB-R4100T | |
| Alienware 15 R2 (Skylake) | |
| The Witcher 3 | |
| 1920x1080 High Graphics & Postprocessing (Nvidia HairWorks Off) (ordina per valore) | |
| MSI GS40-6QE16H11 | |
| Alienware 15 R2 (Skylake) | |
| 1920x1080 Ultra Graphics & Postprocessing (HBAO+) (ordina per valore) | |
| MSI GS40-6QE16H11 | |
| Alienware 15 R2 (Skylake) | |
| Fallout 4 | |
| 1920x1080 High Preset AA:T AF:16x (ordina per valore) | |
| MSI GS40-6QE16H11 | |
| SCHENKER XMG P406 | |
| Asus Zenbook UX303UB-R4100T | |
| 1920x1080 Ultra Preset AA:T AF:16x (ordina per valore) | |
| MSI GS40-6QE16H11 | |
| SCHENKER XMG P406 | |
| Asus Zenbook UX303UB-R4100T | |
Rumorosità
| Idle |
| 33 / 34 / 38 dB(A) |
| HDD |
| 34 dB(A) |
| Sotto carico |
| 44 / 52 dB(A) |
 | ||
30 dB silenzioso 40 dB(A) udibile 50 dB(A) rumoroso |
||
min: | ||
| MSI GS40-6QE16H11 GeForce GTX 970M, 6700HQ | SCHENKER XMG P406 GeForce GTX 970M, 6700HQ | Gigabyte P34W V3 GeForce GTX 970M, 4720HQ | SCHENKER XMG C405 GeForce GTX 965M, 4720HQ | Asus Zenbook UX303UB-R4100T GeForce 940M, 6500U | Alienware 15 R2 (Skylake) GeForce GTX 980M, 6700HQ | |
|---|---|---|---|---|---|---|
| Noise | 1% | -2% | -4% | 15% | 4% | |
| Idle Minimum * | 33 | 30 9% | 34.2 -4% | 29.2 12% | 31.5 5% | 33.6 -2% |
| Idle Average * | 34 | 32 6% | 34.3 -1% | 34.6 -2% | 31.5 7% | 33.8 1% |
| Idle Maximum * | 38 | 40 -5% | 38 -0% | 38.8 -2% | 31.5 17% | 34 11% |
| Load Average * | 44 | 47 -7% | 43.8 -0% | 54 -23% | 35.9 18% | 39.3 11% |
| Load Maximum * | 52 | 51 2% | 55 -6% | 54.4 -5% | 38.2 27% | 51.4 1% |
* ... Meglio usare valori piccoli
(-) La temperatura massima sul lato superiore è di 57.4 °C / 135 F, rispetto alla media di 40.4 °C / 105 F, che varia da 21.2 a 68.8 °C per questa classe Gaming.
(-) Il lato inferiore si riscalda fino ad un massimo di 68.8 °C / 156 F, rispetto alla media di 43.2 °C / 110 F
(±) In idle, la temperatura media del lato superiore è di 34.1 °C / 93 F, rispetto alla media deld ispositivo di 33.8 °C / 93 F.
(+) I poggiapolsi e il touchpad raggiungono la temperatura massima della pelle (35.3 °C / 95.5 F) e quindi non sono caldi.
(-) La temperatura media della zona del palmo della mano di dispositivi simili e'stata di 28.9 °C / 84 F (-6.4 °C / -11.5 F).
| MSI GS40-6QE16H11 GeForce GTX 970M, 6700HQ | SCHENKER XMG P406 GeForce GTX 970M, 6700HQ | Gigabyte P34W V3 GeForce GTX 970M, 4720HQ | SCHENKER XMG C405 GeForce GTX 965M, 4720HQ | Asus Zenbook UX303UB-R4100T GeForce 940M, 6500U | Alienware 15 R2 (Skylake) GeForce GTX 980M, 6700HQ | |
|---|---|---|---|---|---|---|
| Heat | 4% | 9% | 4% | 24% | 16% | |
| Maximum Upper Side * | 57.4 | 55 4% | 45.2 21% | 47.8 17% | 56.6 1% | 48 16% |
| Maximum Bottom * | 68.8 | 58.7 15% | 56.8 17% | 60.4 12% | 54.3 21% | 57.3 17% |
| Idle Upper Side * | 36.3 | 36.9 -2% | 34.6 5% | 37.7 -4% | 24 34% | 31.9 12% |
| Idle Bottom * | 41.2 | 41.7 -1% | 43.6 -6% | 44.8 -9% | 24.2 41% | 33.4 19% |
* ... Meglio usare valori piccoli
| Off / Standby | |
| Idle | |
| Sotto carico |
|
Leggenda:
min: Attualmente utilizziamo il Metrahit Energy, un multimetro digitale professionale per la misurazione della qualità della potenza e dell'energia monofase, per le nostre misurazioni. | |
| MSI GS40-6QE16H11 GeForce GTX 970M, 6700HQ | SCHENKER XMG P406 GeForce GTX 970M, 6700HQ | MSI GS60-6QE4K16H21 GeForce GTX 970M, 6700HQ | SCHENKER XMG C405 GeForce GTX 965M, 4720HQ | Asus Zenbook UX303UB-R4100T GeForce 940M, 6500U | Alienware 15 R2 (Skylake) GeForce GTX 980M, 6700HQ | |
|---|---|---|---|---|---|---|
| Power Consumption | -5% | -26% | -28% | 59% | -8% | |
| Idle Minimum * | 10 | 12 -20% | 17 -70% | 15.8 -58% | 3.2 68% | 11.4 -14% |
| Idle Average * | 14 | 16 -14% | 22 -57% | 22.8 -63% | 7.6 46% | 16.5 -18% |
| Idle Maximum * | 24 | 22 8% | 28 -17% | 27.3 -14% | 8 67% | 22 8% |
| Load Average * | 90 | 90 -0% | 91 -1% | 106.8 -19% | 47 48% | 94.2 -5% |
| Load Maximum * | 172 | 170 1% | 149 13% | 152 12% | 55 68% | 192.2 -12% |
* ... Meglio usare valori piccoli
| MSI GS40-6QE16H11 GeForce GTX 970M, 6700HQ, 61 Wh | SCHENKER XMG P406 GeForce GTX 970M, 6700HQ, 45 Wh | MSI GS60-6QE4K16H21 GeForce GTX 970M, 6700HQ, 47 Wh | SCHENKER XMG C405 GeForce GTX 965M, 4720HQ, 61 Wh | Asus Zenbook UX303UB-R4100T GeForce 940M, 6500U, 50 Wh | Alienware 15 R2 (Skylake) GeForce GTX 980M, 6700HQ, 96 Wh | |
|---|---|---|---|---|---|---|
| Autonomia della batteria | -9% | -26% | -21% | 98% | 84% | |
| Reader / Idle | 313 | 275 -12% | 213 -32% | 997 219% | 769 146% | |
| H.264 | 302 | 413 37% | 456 51% | |||
| WiFi v1.3 | 297 | 197 -34% | 157 -47% | 236 -21% | 410 38% | 446 50% |
| Load | 60 | 72 20% | 61 2% | 118 97% | 114 90% |
Pro
Contro
Error: More than one (2) Pro / Contra Item for this review found!
Il GS40 è un buon compromesso tra performance e dimensioni compatte. Le poche pecche son prevalentemente il risultato del concept "Mini-Max", ma potete conviverci. Le prestazioni (gaming) sono indubbie – il GS40 riesce a gestire anche i giochi impegnativi. Il display è impressionante, il consumo energetico è ragionevole e l'autonomia è abbastanza buona.
Il peso contenuto intacca la stabilità dello chassis, che si flette abbastanza sotto pressione (incluso quando si premono i tasti). Anche le ventole hanno difficoltà a dissipare il calore - forse dovrebbero girare sempre a velocità costante invece di pulsare? Questo potrebbe sicuramente migliorare anche la rumorosità.
Ma questo non cambia la nostra impressione complessiva del GS40. Non ci sono molte alternative da 14", almeno se volete moderne features come un CPU Skylake, DDR4-RAM ed USB 3.1. Ciò potrebbe cambiare rapidamente (a breve la recensione dello Schenker XMG P406), ma per ora potete solo guardare sistemi più piccoli, e meno potenti, o prendere un pesante portatile gaming da 15" o 17".
Per circa 1700 Euro (~$1851), il GS40 sicuramente non è un affare, ma il prezzo è simile a quello dei concorrenti.
Nota: si tratta di una recensione breve, con alcune sezioni non tradotte, per la versione integrale in inglese guardate qui.
MSI GS40-6QE16H11
-
03/08/2016 v5(old)
Oliver Moebel
Pricecompare
