 Deutsch
 English
 Español
 Français
 Italiano
 Nederlands
 Polski
 Português
 Русский
 Türkçe
 Svenska
 Chinese
 Magyar
Recensione breve del portatile MSI GL62M 7RD-077

| SD Card Reader | |
| average JPG Copy Test (av. of 3 runs) | |
| HP Omen 15-ax007ng | |
| Asus Strix GL502VM-FY039T | |
| MSI GL62M 7RD-077 | |
| MSI GL62-6QFi781H11 | |
| Acer Aspire VX5-591G-D0DD | |
| maximum AS SSD Seq Read Test (1GB) | |
| HP Omen 15-ax007ng | |
| Asus Strix GL502VM-FY039T | |
| Acer Aspire VX5-591G-D0DD | |
| MSI GL62M 7RD-077 | |
| MSI GL62-6QFi781H11 | |
| Networking | |
| iperf3 transmit AX12 | |
| Acer Aspire VX5-591G-D0DD | |
| Asus Strix GL502VM-FY039T | |
| MSI GL62M 7RD-077 (jseb) | |
| iperf3 receive AX12 | |
| Asus Strix GL502VM-FY039T | |
| Acer Aspire VX5-591G-D0DD | |
| MSI GL62M 7RD-077 (jseb) | |
| |||||||||||||||||||||||||
Distribuzione della luminosità: 79 %
Al centro con la batteria: 256 cd/m²
Contrasto: 478:1 (Nero: 0.54 cd/m²)
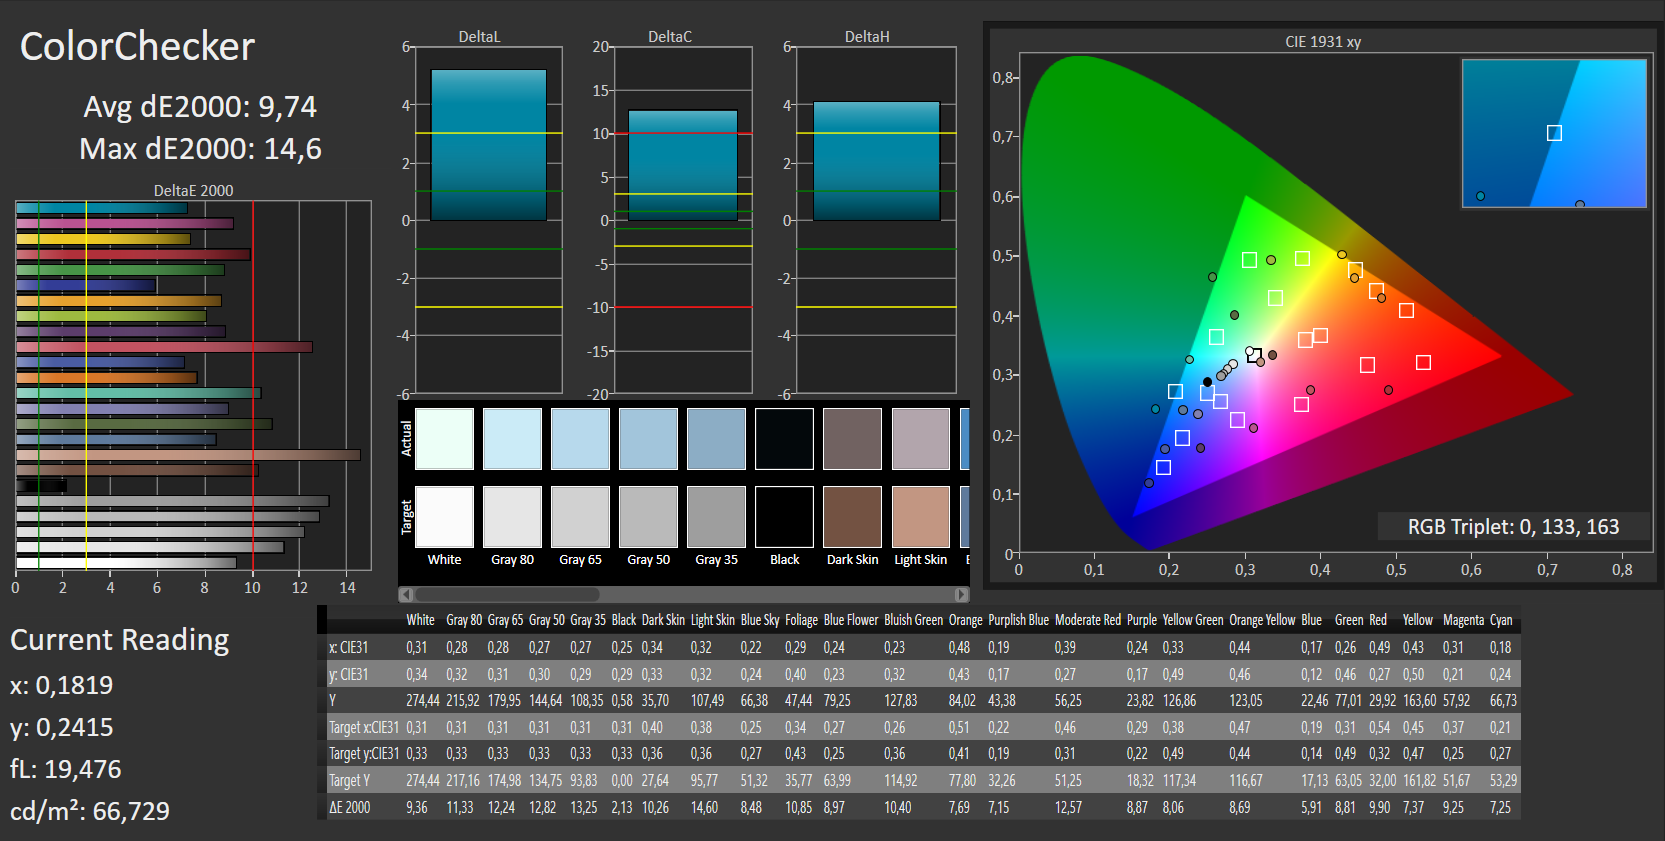
ΔE Color 9.74 | 0.5-29.43 Ø5
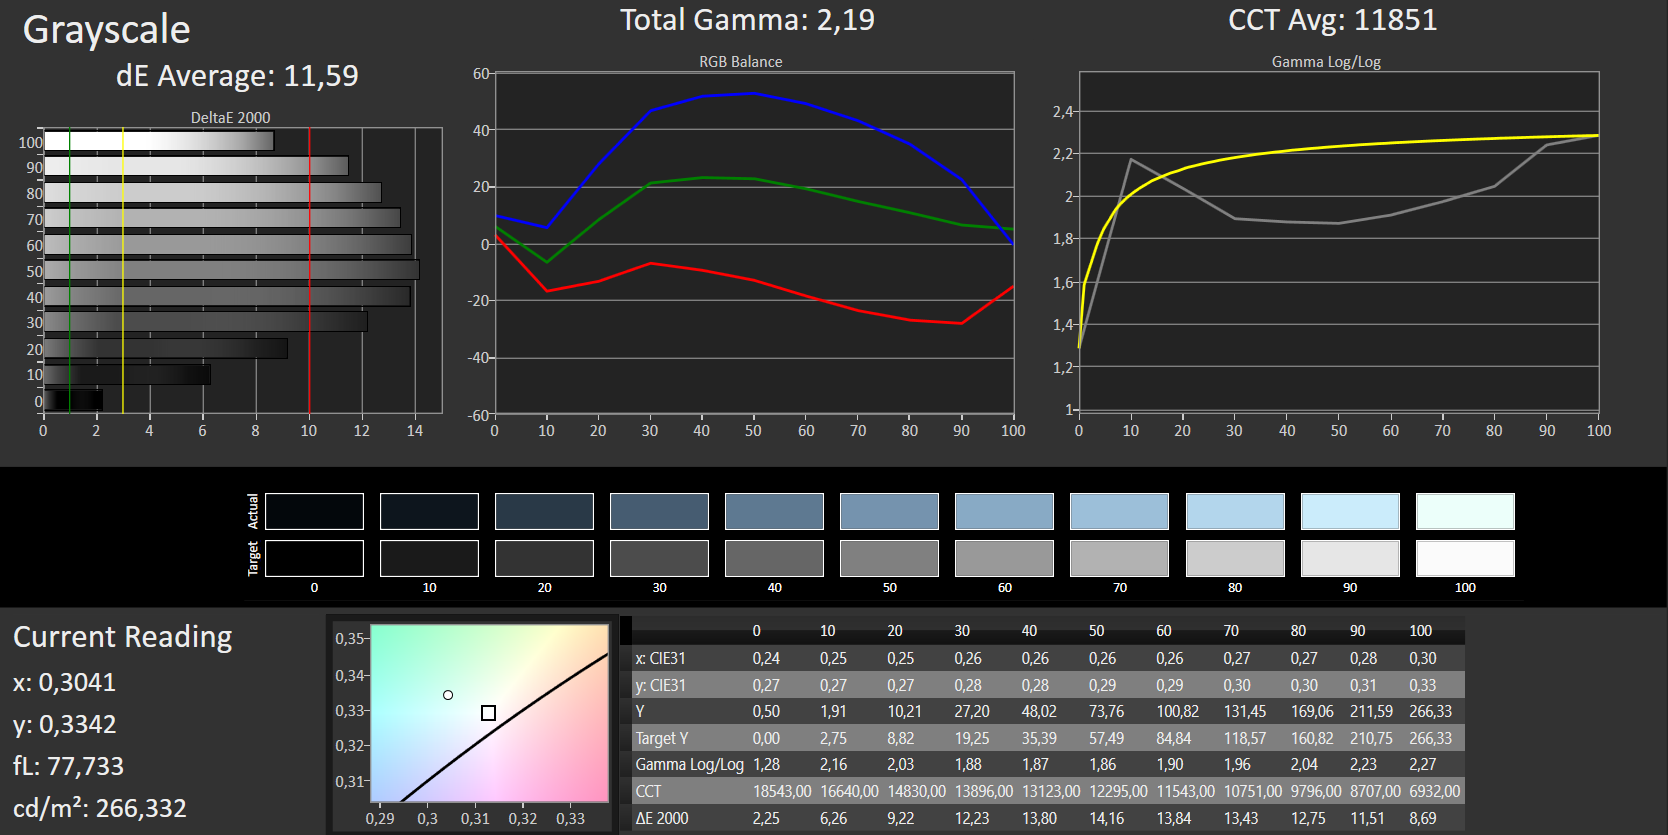
ΔE Greyscale 11.59 | 0.57-98 Ø5.3
100% sRGB (Argyll 1.6.3 3D)
76% AdobeRGB 1998 (Argyll 1.6.3 3D)
83.8% AdobeRGB 1998 (Argyll 2.2.0 3D)
100% sRGB (Argyll 2.2.0 3D)
85.4% Display P3 (Argyll 2.2.0 3D)
Gamma: 2.19
| MSI GL62M 7RD-077 TN LED, 1920x1080, 15.60 | MSI GL62-6QFi781H11 TN LED, 1920x1080, 15.60 | Asus Strix GL502VM-FY039T IPS, 1920x1080, 15.60 | HP Omen 15-ax007ng IPS, 1920x1080, 15.60 | |
|---|---|---|---|---|
| Display | 0% | -23% | -36% | |
| Display P3 Coverage | 85.4 | 85.8 0% | 64.5 -24% | 59.9 -30% 40.34 -53% |
| sRGB Coverage | 100 | 99.8 0% | 83.4 -17% | 85.9 -14% 60.3 -40% |
| AdobeRGB 1998 Coverage | 83.8 | 84.1 0% | 60.9 -27% | 61.6 -26% 41.73 -50% |
| Response Times | 143% | 12% | -16% | |
| Response Time Grey 50% / Grey 80% * | 44 ? | 43 ? 2% | 40 ? 9% | 55 ? -25% |
| Response Time Black / White * | 29 ? | 23 ? 21% | 25 ? 14% | 31 ? -7% |
| PWM Frequency | 198 ? | 1000 ? 405% | ||
| Screen | -3% | 32% | 9% | |
| Brightness middle | 258 | 216 -16% | 321 24% | 214 -17% |
| Brightness | 234 | 202 -14% | 296 26% | 203 -13% |
| Brightness Distribution | 79 | 83 5% | 88 11% | 79 0% |
| Black Level * | 0.54 | 0.48 11% | 0.33 39% | 0.28 48% |
| Contrast | 478 | 450 -6% | 973 104% | 764 60% |
| Colorchecker dE 2000 * | 9.74 | 9.98 -2% | 4.42 55% | 6.04 38% |
| Colorchecker dE 2000 max. * | 14.6 | 17.12 -17% | 9.78 33% | 12 18% |
| Greyscale dE 2000 * | 11.59 | 10.91 6% | 3.34 71% | 5.91 49% |
| Gamma | 2.19 100% | 2.31 95% | 2.4 92% | 2.44 90% |
| CCT | 11851 55% | 13185 49% | 6213 105% | 7362 88% |
| Color Space (Percent of AdobeRGB 1998) | 76 | 75 -1% | 55 -28% | 38 -50% |
| Color Space (Percent of sRGB) | 100 | 100 0% | 83 -17% | 60 -40% |
| Media totale (Programma / Settaggio) | 47% /
25% | 7% /
18% | -14% /
-8% |
* ... Meglio usare valori piccoli
Sfarfallio dello schermo / PWM (Pulse-Width Modulation)
| flickering dello schermo / PWM rilevato | 198 Hz | ≤ 90 % settaggio luminosita' | 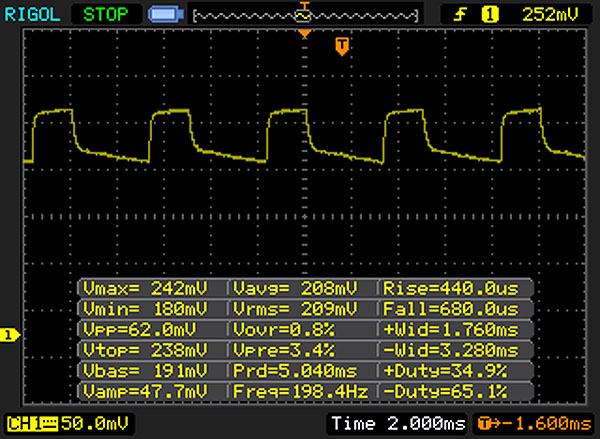 |
Il display sfarfalla a 198 Hz (Probabilmente a causa dell'uso di PWM) Flickering rilevato ad una luminosita' di 90 % o inferiore. Non dovrebbe verificarsi flickering o PWM sopra questo valore di luminosita'. La frequenza di 198 Hz è relativamente bassa, quindi gli utenti sensibili potrebbero notare il flickering ed accusare stanchezza agli occhi a questo livello di luminosità e a livelli inferiori. In confronto: 53 % di tutti i dispositivi testati non utilizza PWM per ridurre la luminosita' del display. Se è rilevato PWM, una media di 17900 (minimo: 5 - massimo: 3846000) Hz è stata rilevata. | |||
Tempi di risposta del Display
| ↔ Tempi di risposta dal Nero al Bianco | ||
|---|---|---|
| 29 ms ... aumenta ↗ e diminuisce ↘ combinato | ↗ 12 ms Incremento | 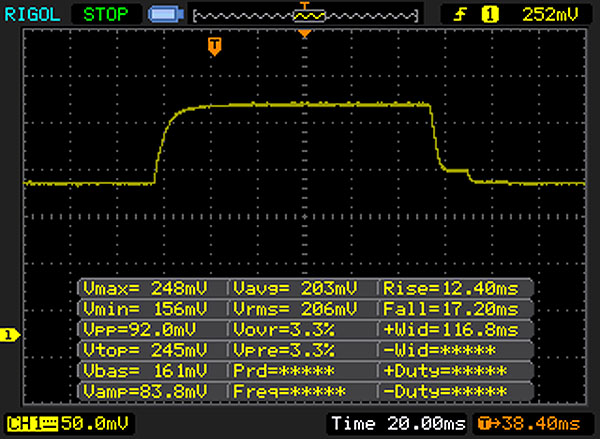 |
| ↘ 17 ms Calo | ||
| Lo schermo mostra tempi di risposta relativamente lenti nei nostri tests e potrebbe essere troppo lento per i gamers. In confronto, tutti i dispositivi di test variano da 0.1 (minimo) a 240 (massimo) ms. » 74 % di tutti i dispositivi è migliore. Questo significa che i tempi di risposta rilevati sono peggiori rispetto alla media di tutti i dispositivi testati (21.5 ms). | ||
| ↔ Tempo di risposta dal 50% Grigio all'80% Grigio | ||
| 44 ms ... aumenta ↗ e diminuisce ↘ combinato | ↗ 24 ms Incremento | 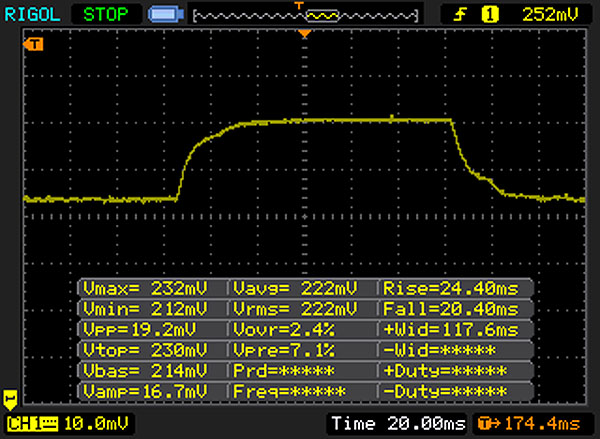 |
| ↘ 20 ms Calo | ||
| Lo schermo mostra tempi di risposta lenti nei nostri tests e sarà insoddisfacente per i gamers. In confronto, tutti i dispositivi di test variano da 0.2 (minimo) a 636 (massimo) ms. » 70 % di tutti i dispositivi è migliore. Questo significa che i tempi di risposta rilevati sono peggiori rispetto alla media di tutti i dispositivi testati (33.7 ms). | ||
| Cinebench R11.5 | |
| CPU Multi 64Bit | |
| MSI GL62M 7RD-077 | |
| Asus Strix GL753VD-GC045T | |
| Gigabyte P57X v7 | |
| Asus Strix GL502VM-FY039T | |
| MSI GL62-6QFi781H11 | |
| HP Omen 15-ax007ng | |
| Acer Aspire V15 Nitro BE VN7-592G-79DV | |
| CPU Single 64Bit | |
| Asus Strix GL753VD-GC045T | |
| Gigabyte P57X v7 | |
| HP Omen 15-ax007ng | |
| Asus Strix GL502VM-FY039T | |
| MSI GL62M 7RD-077 | |
| Acer Aspire V15 Nitro BE VN7-592G-79DV | |
| MSI GL62-6QFi781H11 | |
| Cinebench R10 | |
| Rendering Multiple CPUs 32Bit | |
| MSI GL62M 7RD-077 | |
| Asus Strix GL502VM-FY039T | |
| Acer Aspire V15 Nitro BE VN7-592G-79DV | |
| Rendering Single 32Bit | |
| MSI GL62M 7RD-077 | |
| Asus Strix GL502VM-FY039T | |
| Acer Aspire V15 Nitro BE VN7-592G-79DV | |
| Geekbench 3 | |
| 32 Bit Single-Core Score | |
| Asus Strix GL502VM-FY039T | |
| Acer Aspire V15 Nitro BE VN7-592G-79DV | |
| MSI GL62M 7RD-077 | |
| 32 Bit Multi-Core Score | |
| MSI GL62M 7RD-077 | |
| Acer Aspire V15 Nitro BE VN7-592G-79DV | |
| Asus Strix GL502VM-FY039T | |
| Geekbench 4.0 | |
| 64 Bit Single-Core Score | |
| Asus Strix GL502VM-FY039T | |
| MSI GL62M 7RD-077 | |
| 64 Bit Multi-Core Score | |
| Asus Strix GL502VM-FY039T | |
| MSI GL62M 7RD-077 | |
| JetStream 1.1 - Total Score | |
| MSI GL62M 7RD-077 | |
| Asus Strix GL502VM-FY039T | |
| Acer Aspire V15 Nitro BE VN7-592G-79DV | |
| Octane V2 - Total Score | |
| MSI GL62M 7RD-077 | |
| Asus Strix GL502VM-FY039T | |
| Acer Aspire V15 Nitro BE VN7-592G-79DV | |
| Mozilla Kraken 1.1 - Total | |
| Acer Aspire V15 Nitro BE VN7-592G-79DV | |
| MSI GL62M 7RD-077 | |
| Asus Strix GL502VM-FY039T | |
* ... Meglio usare valori piccoli
| PCMark 7 Score | 3818 punti | |
| PCMark 8 Home Score Accelerated v2 | 3899 punti | |
| PCMark 8 Creative Score Accelerated v2 | 4679 punti | |
| PCMark 8 Work Score Accelerated v2 | 4831 punti | |
Aiuto | ||
| PCMark 8 | |
| Home Score Accelerated v2 | |
| Asus Strix GL502VM-FY039T | |
| Asus Strix GL753VD-GC045T | |
| HP Omen 15-ax007ng | |
| MSI GL62M 7RD-077 | |
| Acer Aspire VX5-591G-D0DD | |
| MSI GL62-6QFi781H11 | |
| Gigabyte P57X v7 | |
| Acer Aspire V15 Nitro BE VN7-592G-79DV | |
| Work Score Accelerated v2 | |
| Asus Strix GL502VM-FY039T | |
| HP Omen 15-ax007ng | |
| MSI GL62-6QFi781H11 | |
| MSI GL62M 7RD-077 | |
| Gigabyte P57X v7 | |
| Acer Aspire V15 Nitro BE VN7-592G-79DV | |

| MSI GL62M 7RD-077 HGST Travelstar 7K1000 HTS721010A9E630 | MSI GL62-6QFi781H11 Toshiba HG6 THNSNJ128G8NY | Asus Strix GL502VM-FY039T Micron SSD 1100 (MTFDDAV256TBN) | HP Omen 15-ax007ng Adata IM2S3138E-128GM-B | Acer Aspire VX5-591G-D0DD SK Hynix Canvas SC300 512GB M.2 (HFS512G39MND) | |
|---|---|---|---|---|---|
| CrystalDiskMark 3.0 | 6466% | 7690% | 6732% | 8809% | |
| Read Seq | 112.4 | 530 372% | 462.5 311% | 475.7 323% | 494.2 340% |
| Write Seq | 107.3 | 442.7 313% | 462.7 331% | 169.2 58% | 449.6 319% |
| Read 512 | 43.19 | 409.1 847% | 335 676% | 327.6 659% | 348.1 706% |
| Write 512 | 57 | 417.3 632% | 407.1 614% | 169.6 198% | 418.2 634% |
| Read 4k | 0.494 | 21.81 4315% | 25.61 5084% | 33.14 6609% | 16.97 3335% |
| Write 4k | 1.122 | 93 8189% | 86.3 7592% | 81.4 7155% | 38.36 3319% |
| Read 4k QD32 | 1.088 | 257 23521% | 246.7 22575% | 276.8 25341% | 394.9 36196% |
| Write 4k QD32 | 1.234 | 168.3 13539% | 301.5 24333% | 168 13514% | 317.4 25621% |
| 3DMark 06 Standard Score | 28117 punti | |
| 3DMark Vantage P Result | 26560 punti | |
| 3DMark 11 Performance | 7980 punti | |
| 3DMark Ice Storm Standard Score | 73713 punti | |
| 3DMark Cloud Gate Standard Score | 19877 punti | |
| 3DMark Fire Strike Score | 5729 punti | |
| 3DMark Fire Strike Extreme Score | 2743 punti | |
| 3DMark Time Spy Score | 1897 punti | |
Aiuto | ||
| 3DMark 11 - 1280x720 Performance GPU | |
| Gigabyte P57X v7 | |
| Asus Strix GL502VM-FY039T | |
| Acer Aspire VX5-591G-D0DD | |
| MSI GL62M 7RD-077 | |
| HP Omen 15-ax007ng | |
| Asus X550IU | |
| Asus Strix GL753VD-GC045T | |
| Apple MacBook Pro 15 2016 (2.9 GHz, 460) | |
| Apple MacBook Pro 15 2016 (2.7 GHz, 455) | |
| Acer Aspire V15 Nitro BE VN7-592G-79DV | |
| MSI GL62-6QFi781H11 | |
| GFXBench (DX / GLBenchmark) 2.7 | |
| 1920x1080 T-Rex Offscreen | |
| MSI GL62M 7RD-077 | |
| Apple MacBook Pro 15 2016 (2.9 GHz, 460) | |
| Apple MacBook Pro 15 2016 (2.7 GHz, 455) | |
| T-Rex Onscreen | |
| MSI GL62M 7RD-077 | |
| Apple MacBook Pro 15 2016 (2.7 GHz, 455) | |
| GFXBench 3.0 | |
| 1920x1080 1080p Manhattan Offscreen | |
| MSI GL62M 7RD-077 | |
| Apple MacBook Pro 15 2016 (2.9 GHz, 460) | |
| Apple MacBook Pro 15 2016 (2.7 GHz, 455) | |
| on screen Manhattan Onscreen OGL | |
| MSI GL62M 7RD-077 | |
| Apple MacBook Pro 15 2016 (2.7 GHz, 455) | |
| GFXBench 3.1 | |
| 1920x1080 Manhattan ES 3.1 Offscreen | |
| MSI GL62M 7RD-077 | |
| on screen Manhattan ES 3.1 Onscreen | |
| MSI GL62M 7RD-077 | |
| GFXBench | |
| 1920x1080 Car Chase Offscreen | |
| MSI GL62M 7RD-077 | |
| on screen Car Chase Onscreen | |
| MSI GL62M 7RD-077 | |
| Geekbench 4.0 - Compute OpenCL Score | |
| MSI GL62M 7RD-077 | |
| Apple MacBook Pro 15 2016 (2.9 GHz, 460) | |
| Apple MacBook Pro 15 2016 (2.7 GHz, 455) | |
| basso | medio | alto | ultra | QHD | 4K | |
| Tomb Raider (2013) | 301.7 | 240.3 | 170.3 | 80.6 | ||
| BioShock Infinite (2013) | 196.6 | 160.4 | 156.2 | 66.2 | ||
| Battlefield 4 (2013) | 150.8 | 135 | 116.8 | 52 | ||
| Thief (2014) | 71.1 | 67.7 | 65.8 | 43.6 | ||
| Middle-earth: Shadow of Mordor (2014) | 156 | 102.7 | 59.4 | 45.3 | ||
| Dragon Age: Inquisition (2014) | 136 | 105 | 44.3 | 29.7 | ||
| Battlefield Hardline (2015) | 91.8 | 89.7 | 79.8 | 52.6 | ||
| GTA V (2015) | 129.4 | 116.9 | 65.9 | 17.9 | ||
| Dirt Rally (2015) | 223.2 | 117.1 | 88.4 | 53 | ||
| Batman: Arkham Knight (2015) | 94 | 84 | 39 | 28 | ||
| Call of Duty: Black Ops 3 (2015) | 119.7 | 73.9 | 52.2 | 49.1 | ||
| Star Wars Battlefront (2015) | 138 | 124.1 | 60.2 | 52.7 | ||
| Just Cause 3 (2015) | 101 | 86.1 | 48 | 45.1 | ||
| Rise of the Tomb Raider (2016) | 115.3 | 70 | 39.5 | 33.7 | ||
| Hitman 2016 (2016) | 58.4 | 57.3 | 42.3 | 41.1 | ||
| Need for Speed 2016 (2016) | 105 | 99.3 | 63.4 | 47.2 | ||
| Ashes of the Singularity (2016) | 50.5 | 34.4 | 29.1 | |||
| Overwatch (2016) | 56 | |||||
| Mirror's Edge Catalyst (2016) | 110.3 | 83.7 | 40.4 | 32.4 | ||
| Deus Ex Mankind Divided (2016) | 74.3 | 59.3 | 32.2 | 14.7 | ||
| Battlefield 1 (2016) | 114.7 | 97.6 | 49.9 | 44.4 | ||
| Civilization VI (2016) | 66.8 | 54.5 | 42.4 | 34.1 | ||
| Titanfall 2 (2016) | 143.1 | 118 | 53.4 | 45.5 | ||
| Resident Evil 7 (2017) | 223.8 | 98.1 | 57.6 | 19.8 | ||
| Ghost Recon Wildlands (2017) | 90.8 | 39.3 | 32.6 | 4.1 | ||
| Mass Effect Andromeda (2017) | 96 | 43.8 | 24.6 | 20.4 | ||
| Rocket League (2017) | 109 | |||||
| Dirt 4 (2017) | 63.7 | 31 | ||||
| Ark Survival Evolved (2017) | 76 | 24.3 | 16.5 | |||
| FIFA 18 (2017) | 132 | 55.6 | ||||
| Fortnite (2018) | 187 | 135 | 51 | 40 | ||
| Final Fantasy XV Benchmark (2018) | 62 | 30.2 | 18.6 | |||
| Kingdom Come: Deliverance (2018) | 93 | 41.6 | 33.3 | 25.1 | ||
| World of Tanks enCore (2018) | 335 | 139 | 49.3 | 32 | 15.5 | |
| The Crew 2 (2018) | 60 | 42.7 | 36.8 | 32.2 | 9.2 | |
| FIFA 19 (2018) | 187 | 129 | 116 | 96 | 35.6 | |
| Apex Legends (2019) | 36.7 | 35.2 | ||||
| Far Cry New Dawn (2019) | 63 | 36 | 36 | 32 | ||
| Metro Exodus (2019) | 45.1 | 18.8 | 14.5 | 12 | ||
| Dirt Rally 2.0 (2019) | 53.1 | 44.8 | 23.9 | |||
| The Division 2 (2019) | 95 | 37.9 | 34.1 | 21.2 | ||
| Total War: Three Kingdoms (2019) | 152 | 56.2 | 31 | 20.5 | ||
| League of Legends (2019) | 157 | 148 | 135 | 146 | 138 | 113 |
| Control (2019) | 80 | 24.4 | 17.4 | |||
| FIFA 20 (2019) | 108 | 65 | 32.6 |
| BioShock Infinite - 1920x1080 Ultra Preset, DX11 (DDOF) | |
| Gigabyte P57X v7 | |
| Asus Strix GL502VM-FY039T | |
| MSI GL62M 7RD-077 | |
| Acer Aspire V15 Nitro BE VN7-592G-79DV | |
| Apple MacBook Pro 15 2016 (2.7 GHz, 455) | |
| Battlefield 4 - 1920x1080 Ultra Preset AA:4x MS | |
| Asus Strix GL502VM-FY039T | |
| MSI GL62M 7RD-077 | |
| Acer Aspire V15 Nitro BE VN7-592G-79DV | |
| Tomb Raider - 1920x1080 Ultra Preset AA:FX AF:16x | |
| Asus Strix GL502VM-FY039T | |
| MSI GL62M 7RD-077 | |
| Acer Aspire V15 Nitro BE VN7-592G-79DV | |
| Star Wars Battlefront - 1920x1080 Ultra Preset AA:FX | |
| MSI GL62M 7RD-077 | |
| Battlefield 1 - 1920x1080 High Preset AA:T | |
| Acer Aspire VX5-591G-D0DD | |
| MSI GL62M 7RD-077 | |
| Asus Strix GL753VD-GC045T | |
| Apple MacBook Pro 15 2016 (2.9 GHz, 460) | |
| Apple MacBook Pro 15 2016 (2.7 GHz, 455) | |
| Ashes of the Singularity - 1280x768 low | |
| Asus Strix GL502VM-FY039T | |
| MSI GL62M 7RD-077 | |
| Apple MacBook Pro 15 2016 (2.7 GHz, 455) | |
| Deus Ex Mankind Divided - 1366x768 Medium Preset AF:2x | |
| MSI GL62M 7RD-077 | |
| Asus Strix GL753VD-GC045T | |
| Rise of the Tomb Raider - 1366x768 Medium Preset AF:2x | |
| Acer Aspire VX5-591G-D0DD | |
| MSI GL62M 7RD-077 | |
| HP Omen 15-ax007ng | |
| Asus Strix GL753VD-GC045T | |
| Acer Aspire V15 Nitro BE VN7-592G-79DV | |
Rumorosità
| Idle |
| 32.5 / 32.5 / 32.5 dB(A) |
| HDD |
| 32.6 dB(A) |
| Sotto carico |
| 36.4 / 52.4 dB(A) |
 | ||
30 dB silenzioso 40 dB(A) udibile 50 dB(A) rumoroso |
||
min: | ||
| MSI GL62M 7RD-077 i7-7700HQ, GeForce GTX 1050 Mobile | MSI GL62-6QFi781H11 6700HQ, GeForce GTX 960M | Asus Strix GL502VM-FY039T 6700HQ, GeForce GTX 1060 Mobile | HP Omen 15-ax007ng 6700HQ, GeForce GTX 965M | Gigabyte P57X v7 i7-7700HQ, GeForce GTX 1070 Mobile | Asus Strix GL753VD-GC045T i7-7700HQ, GeForce GTX 1050 Mobile | |
|---|---|---|---|---|---|---|
| Noise | -5% | -5% | -4% | -2% | -4% | |
| off /ambiente * | 30.6 | 30 2% | 31 -1% | 30 2% | 29 5% | 28.8 6% |
| Idle Minimum * | 32.5 | 35 -8% | 32 2% | 32 2% | 30.4 6% | 33.9 -4% |
| Idle Average * | 32.5 | 36 -11% | 33 -2% | 33 -2% | 32.1 1% | 33.9 -4% |
| Idle Maximum * | 32.5 | 37 -14% | 34 -5% | 36 -11% | 32.1 1% | 37.8 -16% |
| Load Average * | 36.4 | 41 -13% | 44 -21% | 43 -18% | 45.6 -25% | 42.7 -17% |
| Load Maximum * | 52.4 | 46 12% | 53 -1% | 49 6% | 51.5 2% | 47.4 10% |
* ... Meglio usare valori piccoli
(±) La temperatura massima sul lato superiore è di 44.9 °C / 113 F, rispetto alla media di 40.4 °C / 105 F, che varia da 21.2 a 68.8 °C per questa classe Gaming.
(+) Il lato inferiore si riscalda fino ad un massimo di 38.2 °C / 101 F, rispetto alla media di 43.2 °C / 110 F
(+) In idle, la temperatura media del lato superiore è di 25.6 °C / 78 F, rispetto alla media deld ispositivo di 33.8 °C / 93 F.
(±) I poggiapolsi e il touchpad possono diventare molto caldi al tatto con un massimo di 38 °C / 100.4 F.
(-) La temperatura media della zona del palmo della mano di dispositivi simili e'stata di 28.9 °C / 84 F (-9.1 °C / -16.4 F).
| MSI GL62M 7RD-077 i7-7700HQ, GeForce GTX 1050 Mobile | MSI GL62-6QFi781H11 6700HQ, GeForce GTX 960M | Asus Strix GL502VM-FY039T 6700HQ, GeForce GTX 1060 Mobile | HP Omen 15-ax007ng 6700HQ, GeForce GTX 965M | Gigabyte P57X v7 i7-7700HQ, GeForce GTX 1070 Mobile | Asus Strix GL753VD-GC045T i7-7700HQ, GeForce GTX 1050 Mobile | |
|---|---|---|---|---|---|---|
| Heat | -8% | -38% | -14% | -18% | 11% | |
| Maximum Upper Side * | 44.9 | 49.1 -9% | 65.3 -45% | 48.5 -8% | 51.2 -14% | 37.7 16% |
| Maximum Bottom * | 38.2 | 43.4 -14% | 64.4 -69% | 59 -54% | 56.8 -49% | 36.3 5% |
| Idle Upper Side * | 27.4 | 29.2 -7% | 35.4 -29% | 28.7 -5% | 29.2 -7% | 25.7 6% |
| Idle Bottom * | 29 | 29.6 -2% | 31.6 -9% | 25.7 11% | 29.2 -1% | 24.4 16% |
* ... Meglio usare valori piccoli
MSI GL62M 7RD-077 analisi audio
(+) | gli altoparlanti sono relativamente potenti (86 dB)
Bassi 100 - 315 Hz
(-) | quasi nessun basso - in media 28.4% inferiori alla media
(±) | la linearità dei bassi è media (9.6% delta rispetto alla precedente frequenza)
Medi 400 - 2000 Hz
(±) | medi elevati - circa 9% superiore alla media
(±) | linearità dei medi adeguata (8.2% delta rispetto alla precedente frequenza)
Alti 2 - 16 kHz
(±) | alti elevati - circa 7% superiori alla media
(+) | alti lineari (6.8% delta rispetto alla precedente frequenza)
Nel complesso 100 - 16.000 Hz
(±) | la linearità complessiva del suono è media (27.7% di differenza rispetto alla media
Rispetto alla stessa classe
» 92% di tutti i dispositivi testati in questa classe è stato migliore, 2% simile, 6% peggiore
» Il migliore ha avuto un delta di 6%, medio di 18%, peggiore di 132%
Rispetto a tutti i dispositivi testati
» 82% di tutti i dispositivi testati in questa classe è stato migliore, 4% similare, 15% peggiore
» Il migliore ha avuto un delta di 4%, medio di 25%, peggiore di 134%
Apple MacBook 12 (Early 2016) 1.1 GHz analisi audio
(+) | gli altoparlanti sono relativamente potenti (83.6 dB)
Bassi 100 - 315 Hz
(±) | bassi ridotti - in media 11.3% inferiori alla media
(±) | la linearità dei bassi è media (14.2% delta rispetto alla precedente frequenza)
Medi 400 - 2000 Hz
(+) | medi bilanciati - solo only 2.4% rispetto alla media
(+) | medi lineari (5.5% delta rispetto alla precedente frequenza)
Alti 2 - 16 kHz
(+) | Alti bilanciati - appena 2% dalla media
(+) | alti lineari (4.5% delta rispetto alla precedente frequenza)
Nel complesso 100 - 16.000 Hz
(+) | suono nel complesso lineare (10.2% differenza dalla media)
Rispetto alla stessa classe
» 5% di tutti i dispositivi testati in questa classe è stato migliore, 2% simile, 93% peggiore
» Il migliore ha avuto un delta di 5%, medio di 19%, peggiore di 53%
Rispetto a tutti i dispositivi testati
» 3% di tutti i dispositivi testati in questa classe è stato migliore, 1% similare, 96% peggiore
» Il migliore ha avuto un delta di 4%, medio di 25%, peggiore di 134%
| Off / Standby | |
| Idle | |
| Sotto carico |
|
Leggenda:
min: Attualmente utilizziamo il Metrahit Energy, un multimetro digitale professionale per la misurazione della qualità della potenza e dell'energia monofase, per le nostre misurazioni. | |
| MSI GL62M 7RD-077 i7-7700HQ, GeForce GTX 1050 Mobile | MSI GL62-6QFi781H11 6700HQ, GeForce GTX 960M | Asus Strix GL502VM-FY039T 6700HQ, GeForce GTX 1060 Mobile | HP Omen 15-ax007ng 6700HQ, GeForce GTX 965M | Gigabyte P57X v7 i7-7700HQ, GeForce GTX 1070 Mobile | Asus Strix GL753VD-GC045T i7-7700HQ, GeForce GTX 1050 Mobile | |
|---|---|---|---|---|---|---|
| Power Consumption | 1% | -25% | 11% | -69% | 15% | |
| Idle Minimum * | 10.6 | 10 6% | 16 -51% | 7 34% | 15.7 -48% | 6.2 42% |
| Idle Average * | 14.5 | 14 3% | 19 -31% | 11 24% | 23.4 -61% | 12.2 16% |
| Idle Maximum * | 15 | 19 -27% | 23 -53% | 19 -27% | 23.5 -57% | 14.8 1% |
| Load Average * | 90 | 82 9% | 68 24% | 79 12% | 184.6 -105% | 84.9 6% |
| Load Maximum * | 135 | 118 13% | 157 -16% | 119 12% | 233.1 -73% | 120.7 11% |
* ... Meglio usare valori piccoli
| MSI GL62M 7RD-077 i7-7700HQ, GeForce GTX 1050 Mobile, 41 Wh | MSI GL62-6QFi781H11 6700HQ, GeForce GTX 960M, 41.4 Wh | Asus Strix GL502VM-FY039T 6700HQ, GeForce GTX 1060 Mobile, 64 Wh | HP Omen 15-ax007ng 6700HQ, GeForce GTX 965M, 61.5 Wh | Gigabyte P57X v7 i7-7700HQ, GeForce GTX 1070 Mobile, 75.81 Wh | Asus Strix GL753VD-GC045T i7-7700HQ, GeForce GTX 1050 Mobile, 48 Wh | Acer Aspire VX5-591G-D0DD i7-7700HQ, GeForce GTX 1050 Ti Mobile, 52 Wh | |
|---|---|---|---|---|---|---|---|
| Autonomia della batteria | 10% | 25% | 45% | 25% | 20% | 62% | |
| Reader / Idle | 387 | 339 -12% | 315 -19% | 467 21% | 256 -34% | 515 33% | |
| H.264 | 217 | 235 8% | 244 12% | ||||
| WiFi v1.3 | 225 | 158 -30% | 220 -2% | 272 21% | 155 -31% | 261 16% | 365 62% |
| Load | 41 | 71 73% | 87 112% | 93 127% | 98 139% | 45 10% |
Pro
Contro
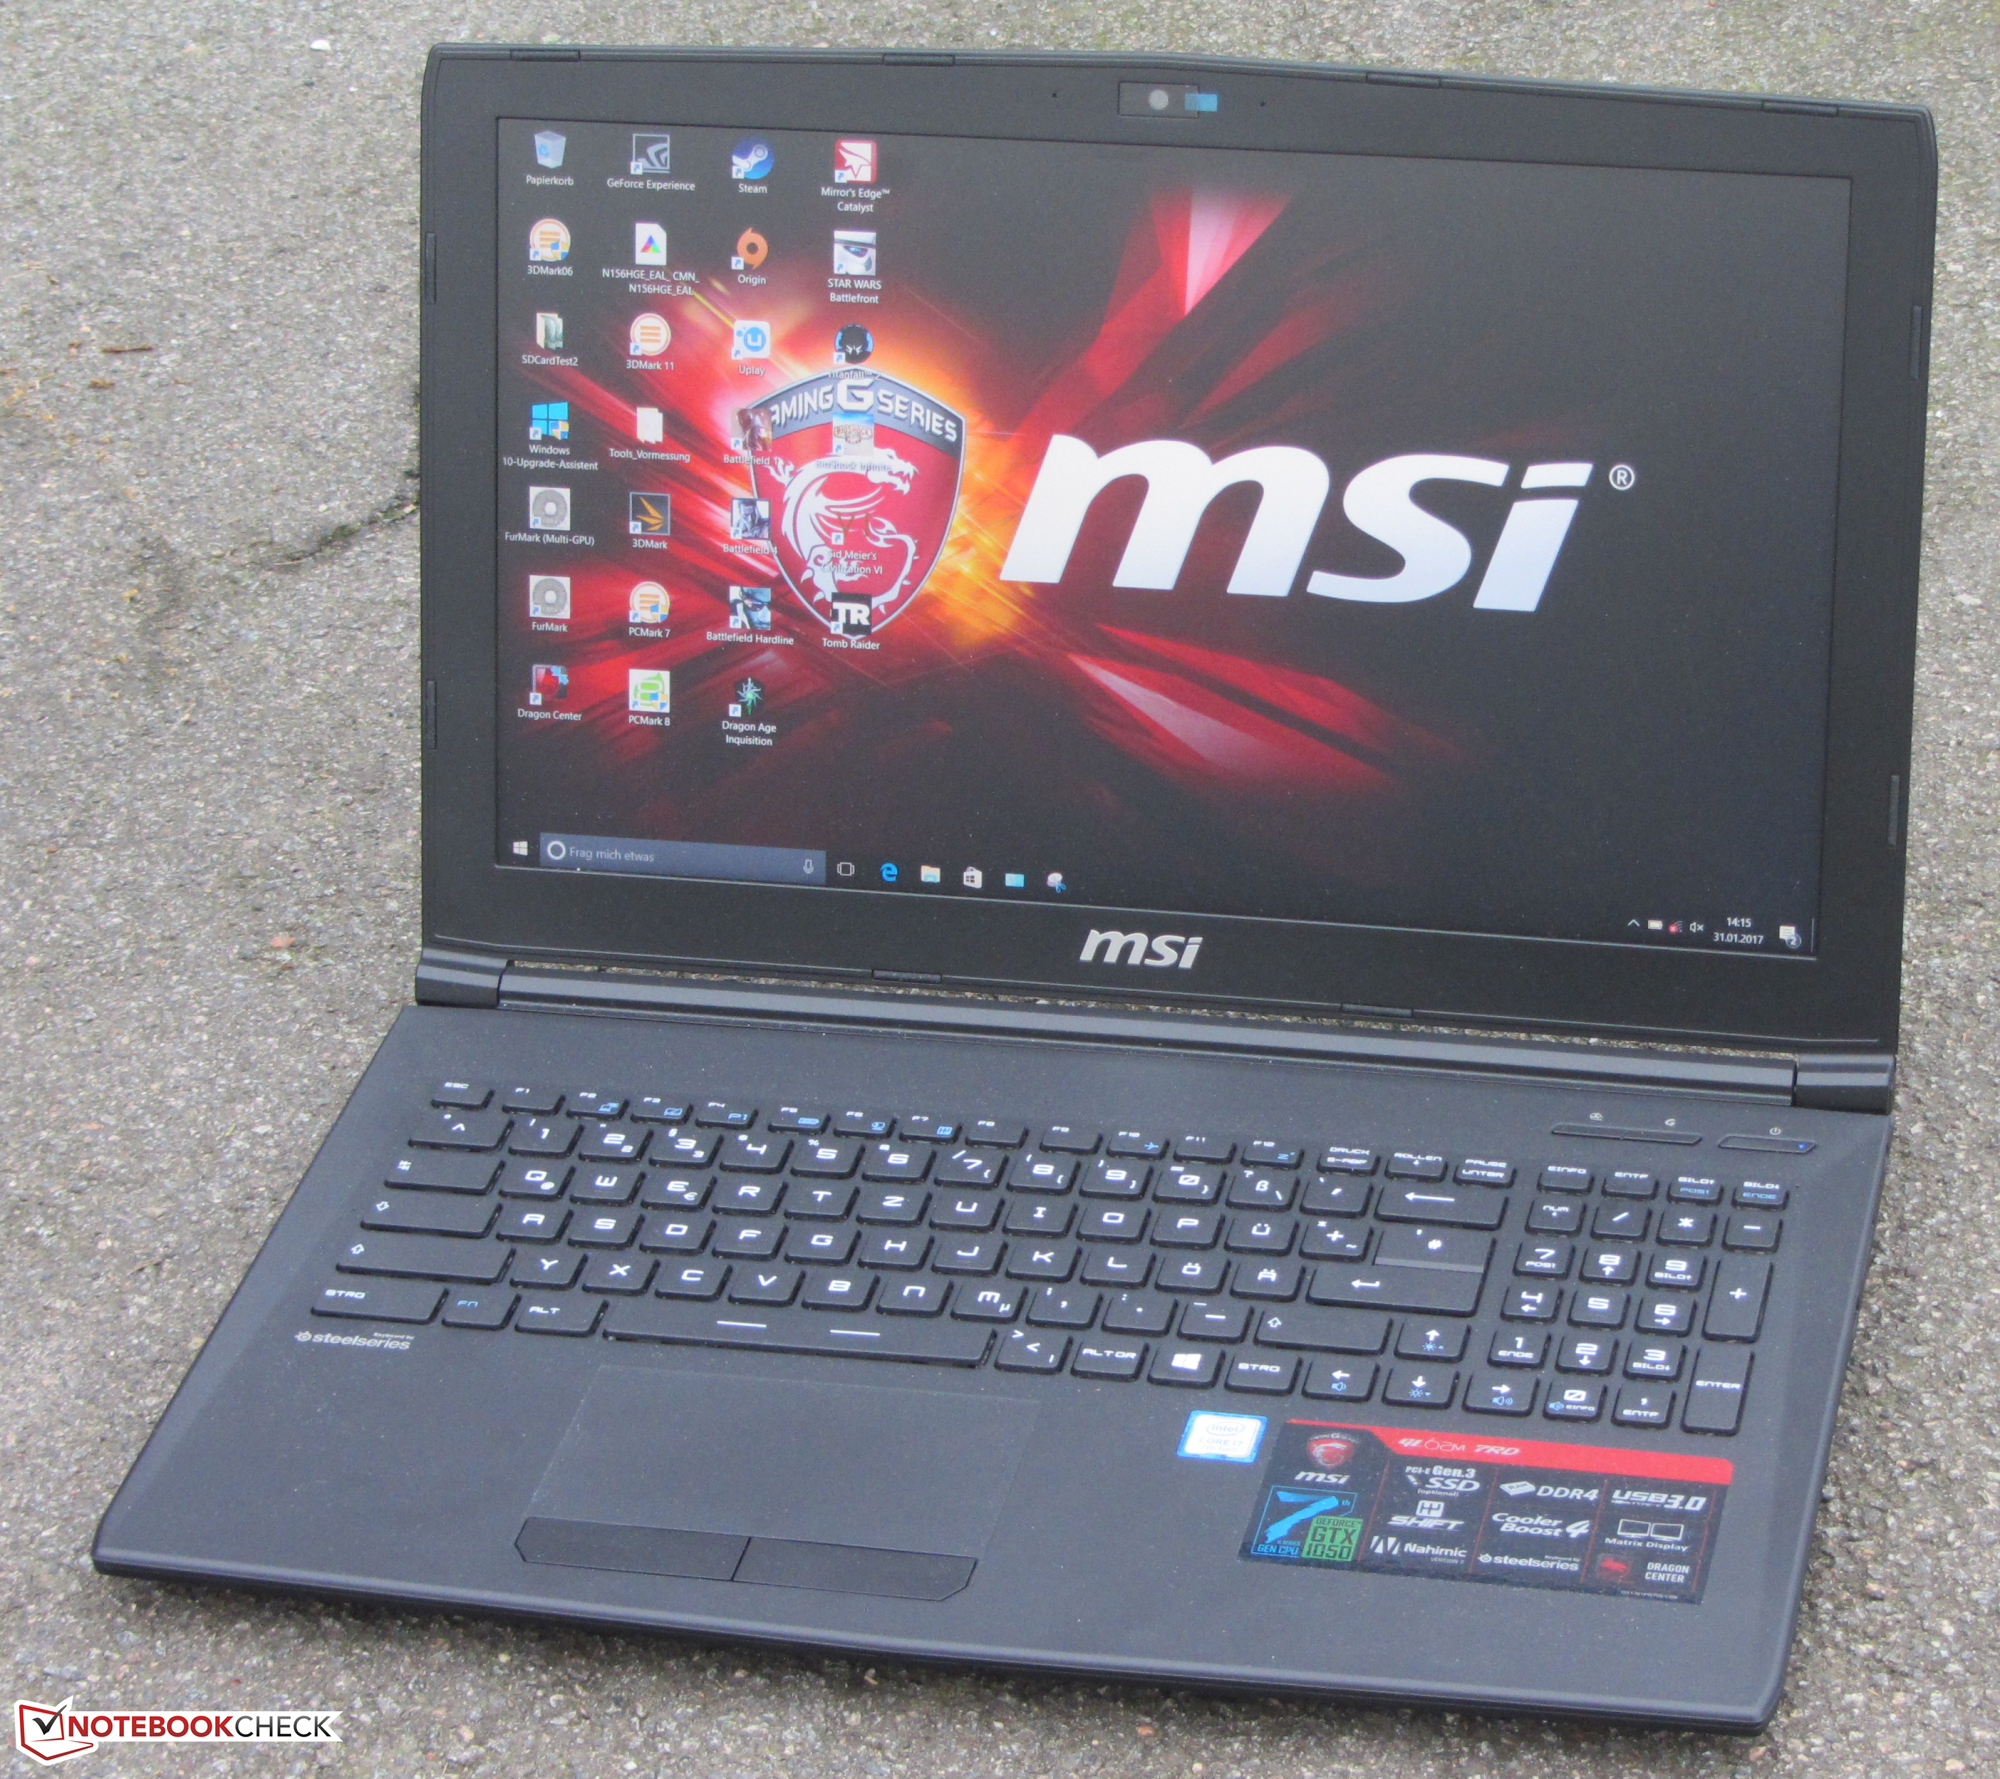
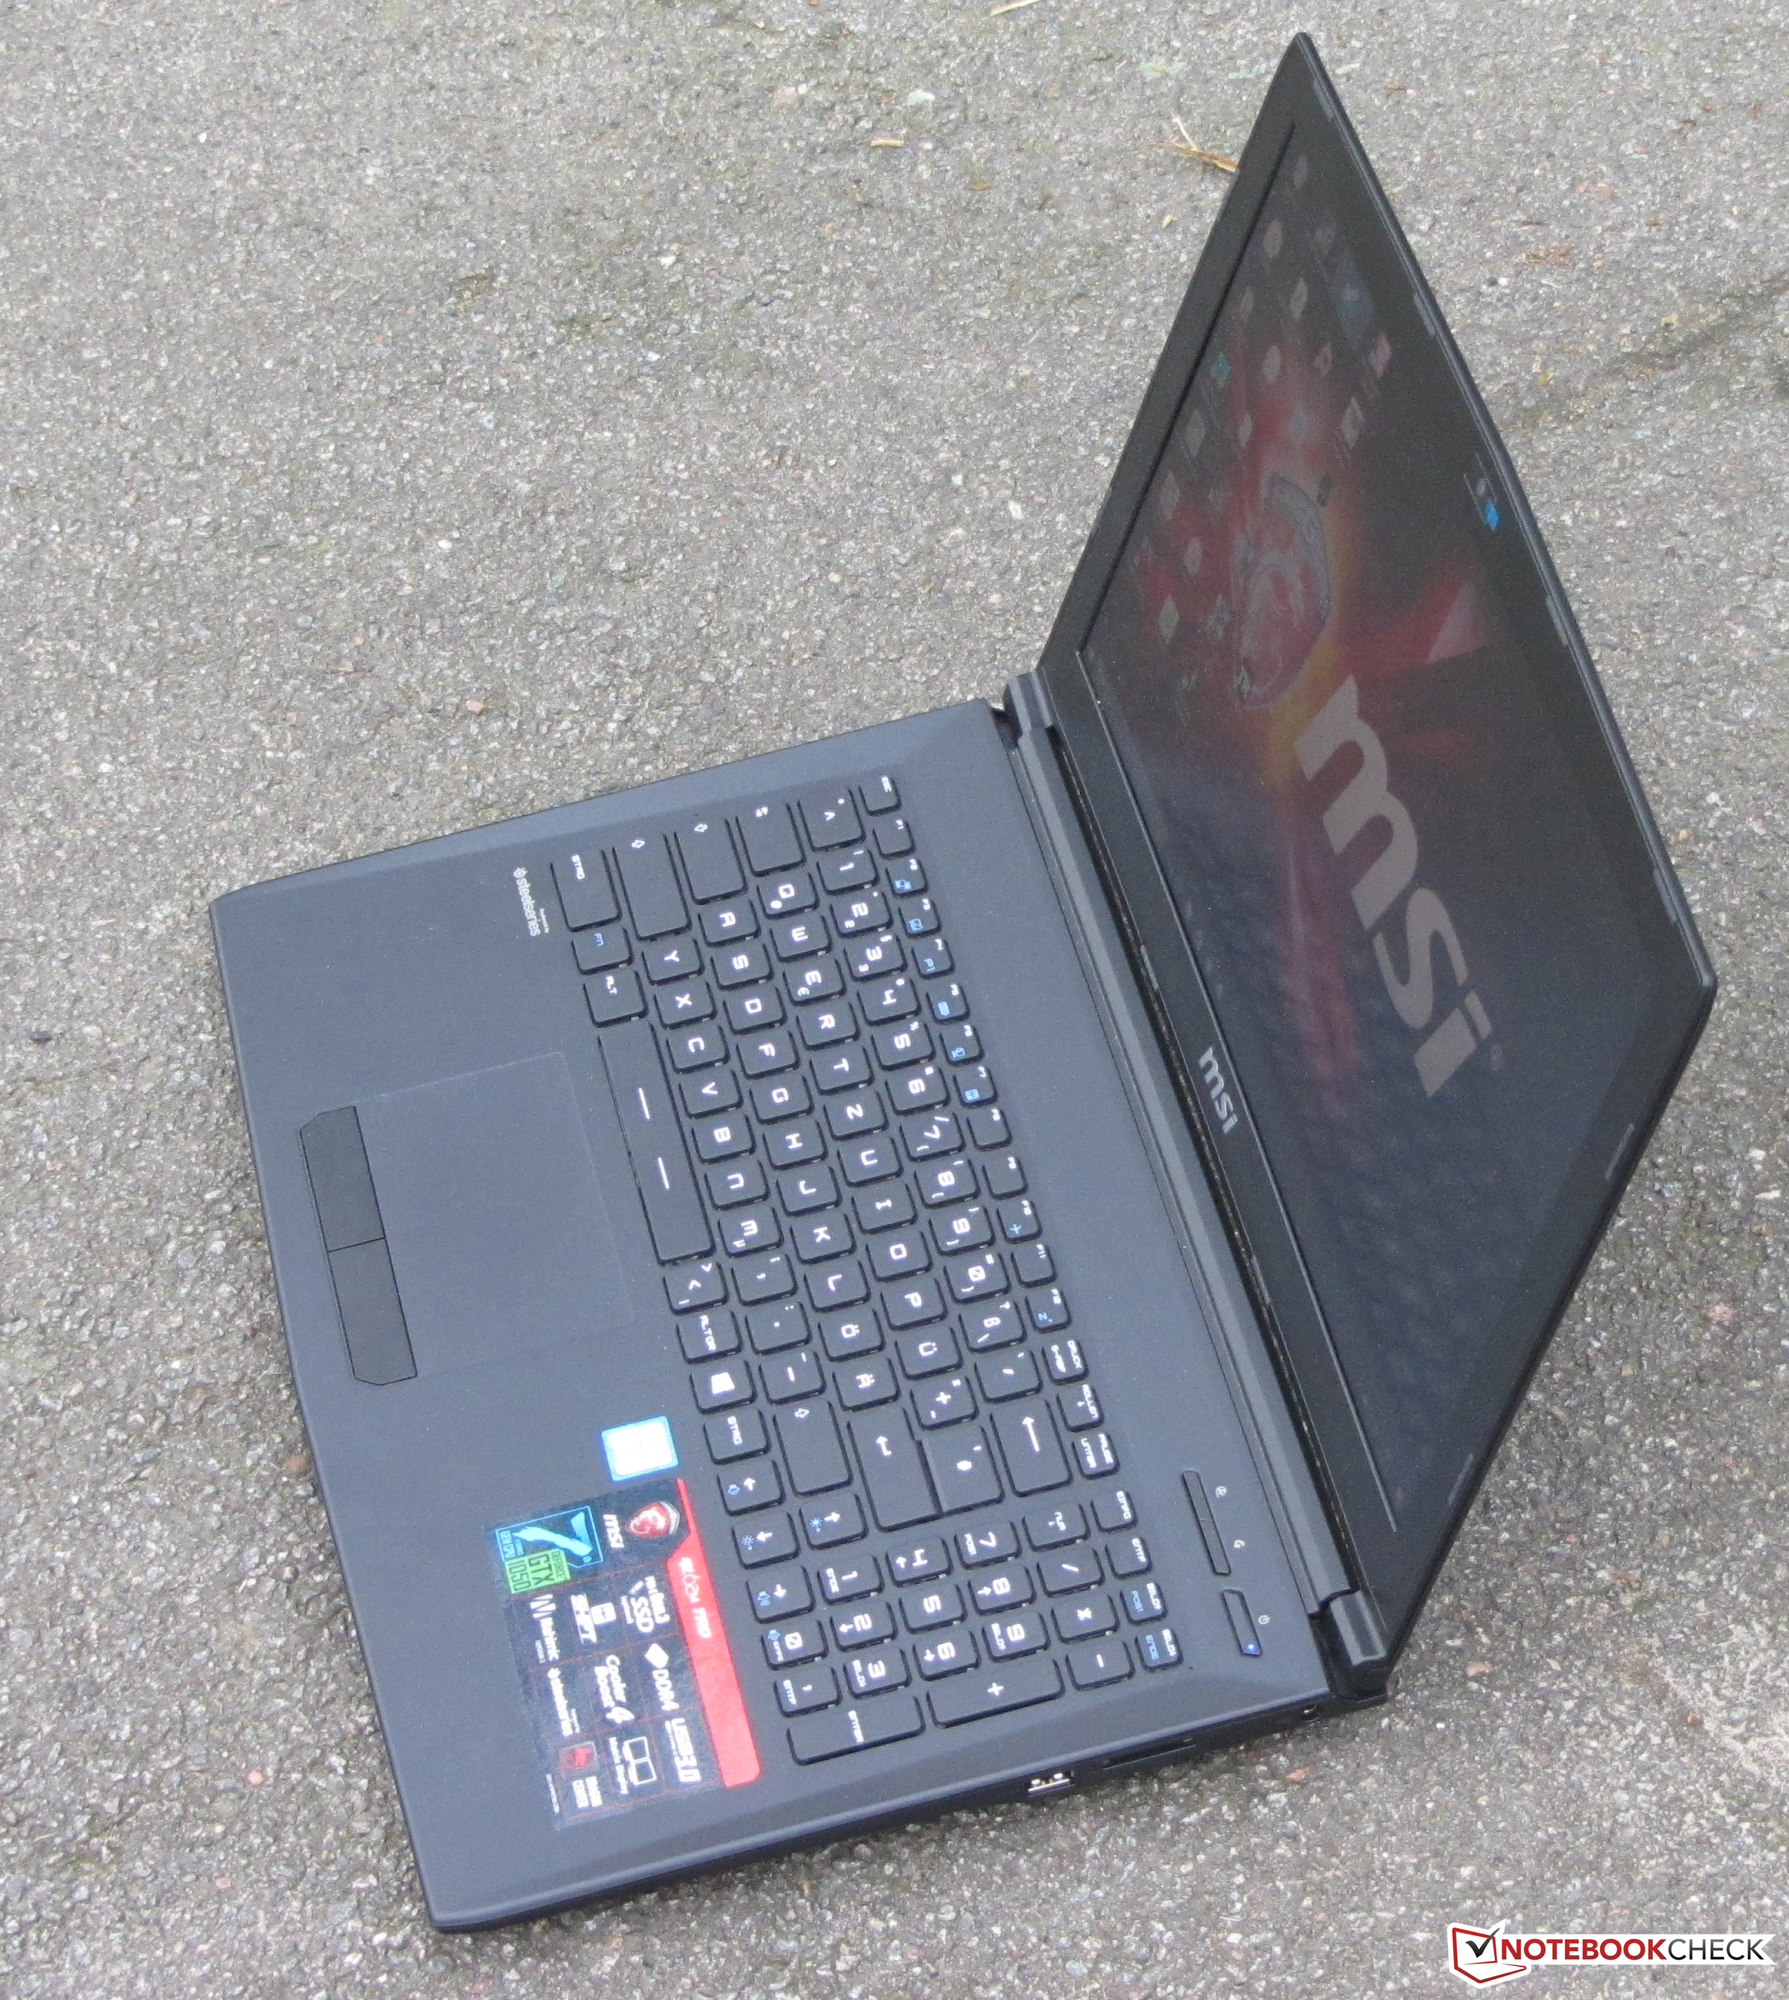
Il GL62M si propone come un economico dispositivo entry-level nel settore gaming. Di conseguenza è in grado di gestire i giochi attuali con risoluzione elevata e settaggi massimi sul suo display matto Full HD. La scheda grafica Nvidia GeForce GTX 1050 lo rende possibile. Consente prestazioni nettamente superiori rispetto al suo predecessore. Tuttavia, il portatile non si comporta bene solo nel gaming, ma anche in altri campi applicativi. Il suo potente processore Kaby Lake lo consente. Nonostante il potente hardware, il computer non si scalda molto indipendentemente dal carico di lavoro.
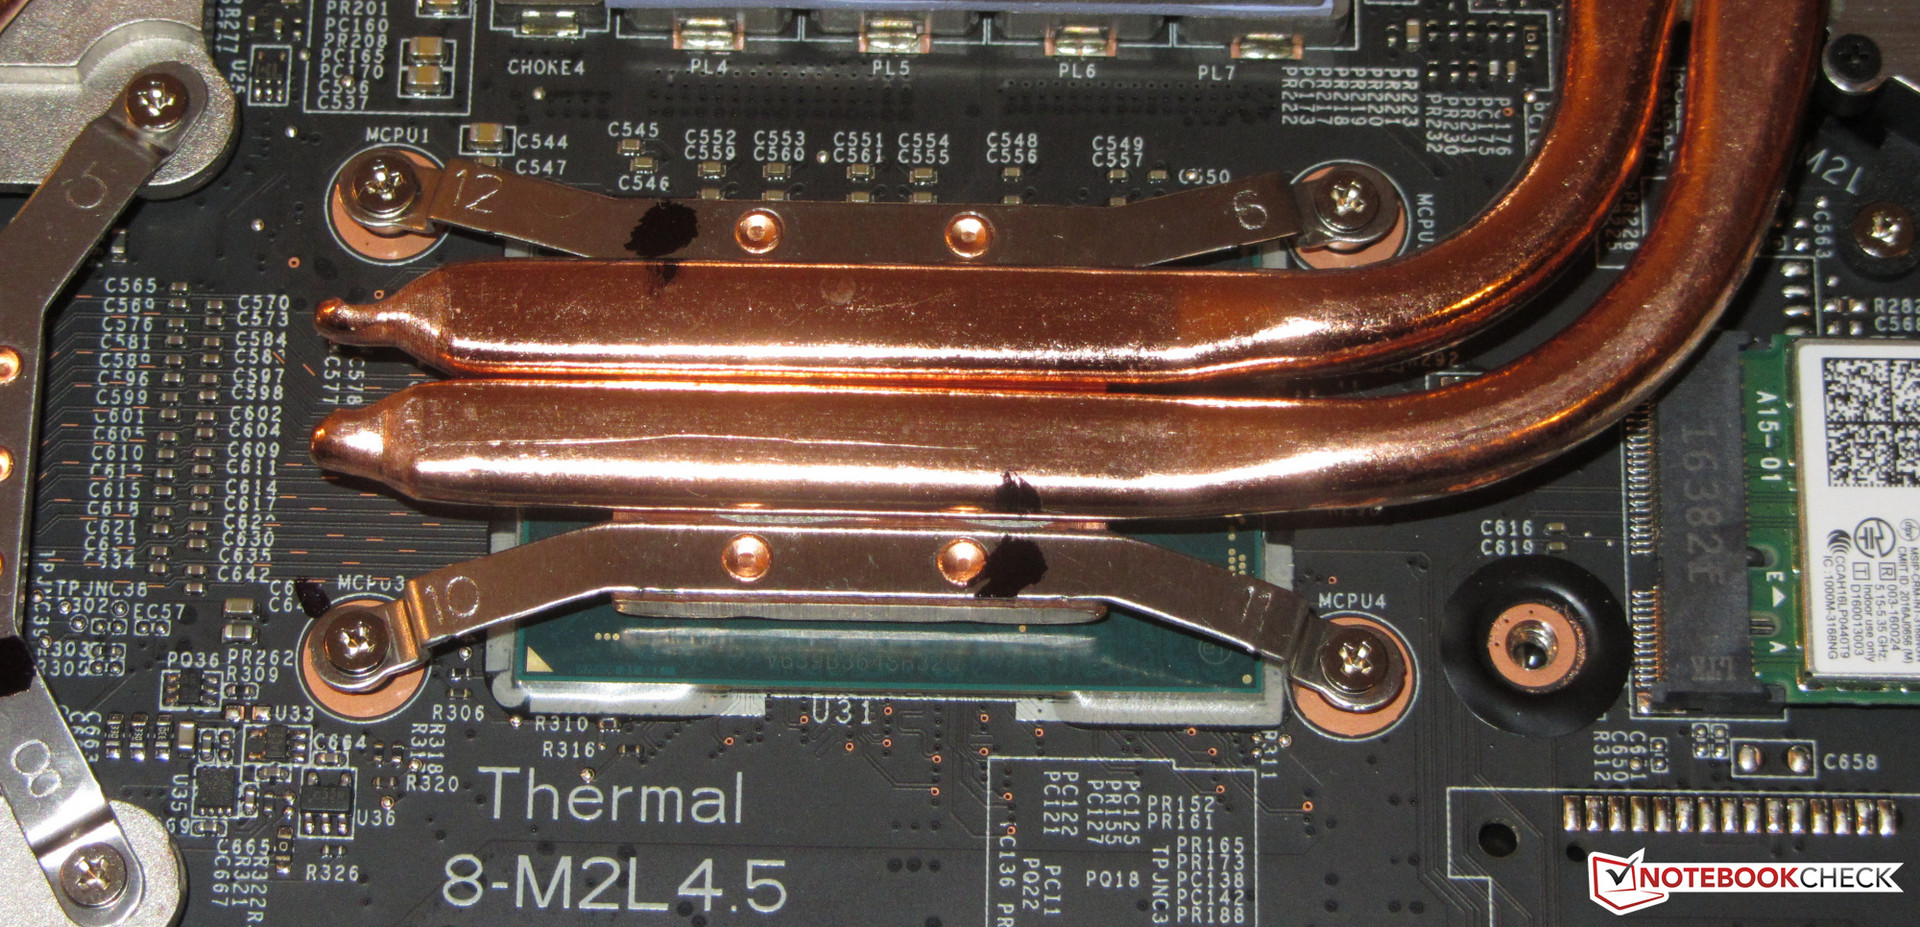
MSI dovrebbe migliorare la gestione automatica della ventola con un aggiornamento del BIOS. La ventola della CPU gira costantemente in idle e genera un rumore pulsante. Gli utenti devono risolvere da soli e questo non dovrebbe succedere.
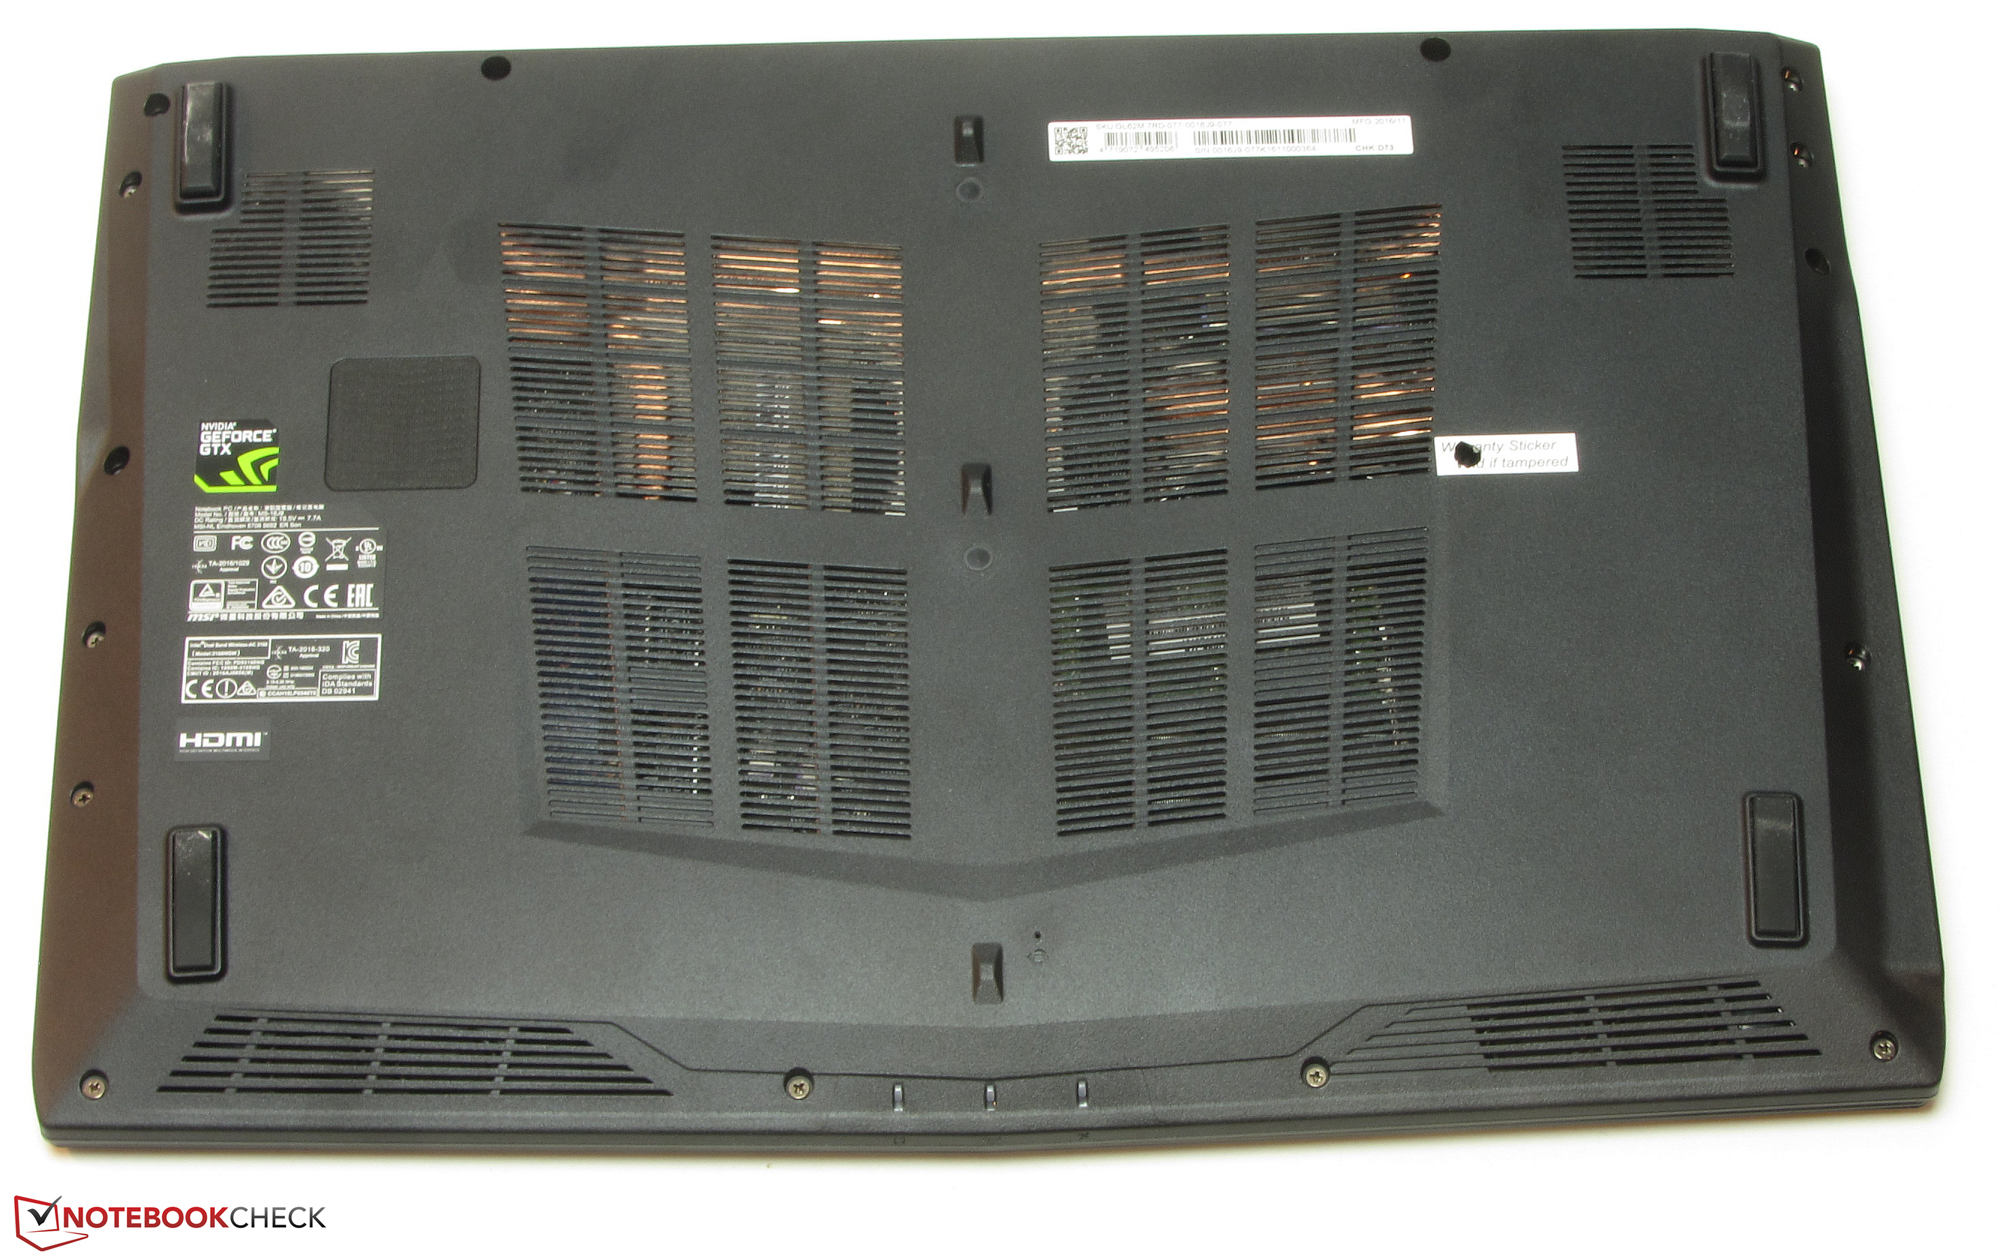
La tastiera va bene ed è adatta per l'utilizzo domestico. Tuttavia, la tastiera è leggermente carente. Grazie all'hard drive da 1 TB e 2.5", c'è abbastanza spazio. E' possibile sostituire l'HDD dopo aver rimosso il lato inferiore del portatile. Allo stesso tempo, potete aggiungere un SSD M.2. Lo slot esistente supporta modelli SATA-3 e PCIe/NVMe.
Il display del GL62M' è deludente.
MSI ha inserito un modello TN scuro concontrasto basso e angoli di visuale limitati. Ci aspetteremmo un pannello IPS luminoso con contrasto elevato per un prezzo di oltre 1000 Euro (~$1064). L'autonomia non convince.
Nel complesso, MSI ha fatto troppi tagli per collocare il portatile nel segmento entry-level. Molti concorrenti offrono modelli più bilanciati, ad esempio l'HP Omen 15-ax206ng. Usa la stessa combinazione CPU/GPU del GL62M, ma ha anche un display IPS, tastiera illuminata, e una combinazione SSD HDD. Il prezzo è simile a quello del portatile MSI.
Nota: si tratta di una recensione breve, con alcune sezioni non tradotte, per la versione integrale in inglese guardate qui.
MSI GL62M 7RD-077
-
02/07/2017 v6(old)
Sascha Mölck