 Deutsch
 English
 Español
 Français
 Italiano
 Nederlands
 Polski
 Português
 Русский
 Türkçe
 Svenska
 Chinese
 Magyar
Recensione breve del portatile Dell XPS 13 9360 FHD i5


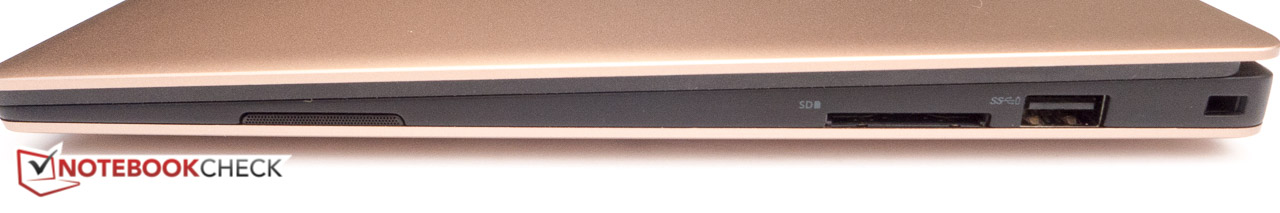
| SD Card Reader | |
| average JPG Copy Test (av. of 3 runs) | |
| Dell XPS 13 9360 QHD+ i7 | |
| Dell XPS 13 9360 FHD i5 | |
| Lenovo IdeaPad 710S-13ISK | |
| Asus Zenbook UX330UA-FC059T | |
| maximum AS SSD Seq Read Test (1GB) | |
| Dell XPS 13 9360 FHD i5 | |
| Dell XPS 13 9360 QHD+ i7 | |
| Lenovo IdeaPad 710S-13ISK | |
| Asus Zenbook UX330UA-FC059T | |
| |||||||||||||||||||||||||
Distribuzione della luminosità: 89 %
Al centro con la batteria: 328 cd/m²
Contrasto: 1801:1 (Nero: 0.195 cd/m²)
ΔE Color 7.4 | 0.5-29.43 Ø5
ΔE Greyscale 6.71 | 0.57-98 Ø5.3
73.31% sRGB (Argyll 1.6.3 3D)
50.48% AdobeRGB 1998 (Argyll 1.6.3 3D)
50.5% AdobeRGB 1998 (Argyll 2.2.0 3D)
73.3% sRGB (Argyll 2.2.0 3D)
48.94% Display P3 (Argyll 2.2.0 3D)
Gamma: 2.74
| Dell XPS 13 9360 FHD i5 Sharp SHP1449 LQ133M1, IPS, 13.30, 1920x1080 | Dell XPS 13 2016 9350 (FHD, i7-6560U) Sharp SHP1449 LQ133M1, IPS, 13.30, 1920x1080 | Asus Zenbook UX330UA-FC059T AU Optronics AUO272D / B133HAN02.7, IPS, 13.30, 1920x1080 | Dell XPS 13 9360 QHD+ i7 Sharp SHP144A, IPS, 13.30, 3200x1800 | Lenovo IdeaPad 710S-13ISK Sharp SHP 1447 / LQ133M1JW15, IPS, 13.30, 1920x1080 | HP Spectre 13 IPS UWVA, 13.30, 1920x1080 | Acer Aspire S 13 S5-371-71QZ AUO B133HAN04.1, IPS, 13.30, 1920x1080 | Razer Blade Stealth QHD i7-7500U Sharp SHP142F (LQ125T1JW02), , 12.50, 2560x1440 | |
|---|---|---|---|---|---|---|---|---|
| Display | 12% | 28% | 26% | 35% | 32% | 36% | ||
| Display P3 Coverage | 48.94 | 54.8 12% | 64.2 31% | 62.8 28% | 66.4 36% | 65.6 34% | 68.7 40% | |
| sRGB Coverage | 73.3 | 82.3 12% | 90.6 24% | 89.4 22% | 97.5 33% | 94.7 29% | 95.8 31% | |
| AdobeRGB 1998 Coverage | 50.5 | 56.6 12% | 65.3 29% | 64.6 28% | 68.4 35% | 67.5 34% | 69.9 38% | |
| Response Times | -3% | 14% | -11% | -16% | -28% | -21% | -7% | |
| Response Time Grey 50% / Grey 80% * | 32.8 ? | 42.8 ? -30% | 32 ? 2% | 43.6 ? -33% | 52.4 ? -60% | 50.8 ? -55% | 50 ? -52% | 37 ? -13% |
| Response Time Black / White * | 33.2 ? | 24.8 ? 25% | 25 ? 25% | 29.2 ? 12% | 23.6 ? 29% | 33.2 ? -0% | 29.6 ? 11% | 33.4 ? -1% |
| PWM Frequency | 200 ? | 220 ? | 200 ? | |||||
| Screen | 19% | 6% | 10% | -5% | 18% | -2% | 1% | |
| Brightness middle | 351.2 | 385 10% | 360 3% | 396.2 13% | 344 -2% | 300.5 -14% | 375 7% | 402 14% |
| Brightness | 325 | 350 8% | 337 4% | 357 10% | 326 0% | 305 -6% | 358 10% | 382 18% |
| Brightness Distribution | 89 | 86 -3% | 86 -3% | 84 -6% | 87 -2% | 76 -15% | 87 -2% | 88 -1% |
| Black Level * | 0.195 | 0.17 13% | 0.22 -13% | 0.266 -36% | 0.36 -85% | 0.184 6% | 0.39 -100% | 0.45 -131% |
| Contrast | 1801 | 2265 26% | 1636 -9% | 1489 -17% | 956 -47% | 1633 -9% | 962 -47% | 893 -50% |
| Colorchecker dE 2000 * | 7.4 | 4.17 44% | 5.21 30% | 3.9 47% | 6.09 18% | 2.64 64% | 4.6 38% | 3.6 51% |
| Colorchecker dE 2000 max. * | 9.08 | 7.61 16% | 8.85 3% | 7.58 17% | 10 -10% | 5.06 44% | 8.8 3% | 7.5 17% |
| Greyscale dE 2000 * | 6.71 | 5.39 20% | 6.23 7% | 4.16 38% | 5.36 20% | 2.8 58% | 4 40% | 4.3 36% |
| Gamma | 2.74 80% | 2.12 104% | 2.5 88% | 2.31 95% | 2.01 109% | 2.16 102% | 2.34 94% | 2.1 105% |
| CCT | 7222 90% | 7404 88% | 6506 100% | 6514 100% | 7230 90% | 6999 93% | 7304 89% | 6572 99% |
| Color Space (Percent of AdobeRGB 1998) | 50.48 | 62.7 24% | 59 17% | 57.5 14% | 62.25 23% | 60.9 21% | 57.9 15% | 62.3 23% |
| Color Space (Percent of sRGB) | 73.31 | 99.8 36% | 90 23% | 88.7 21% | 97.54 33% | 94.3 29% | 88.7 21% | 95.7 31% |
| Media totale (Programma / Settaggio) | 9% /
15% | 16% /
12% | 8% /
11% | 5% /
1% | 7% /
15% | -12% /
-5% | 10% /
7% |
* ... Meglio usare valori piccoli
Tempi di risposta del Display
| ↔ Tempi di risposta dal Nero al Bianco | ||
|---|---|---|
| 33.2 ms ... aumenta ↗ e diminuisce ↘ combinato | ↗ 10.8 ms Incremento | 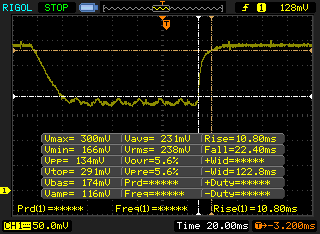 |
| ↘ 22.4 ms Calo | ||
| Lo schermo mostra tempi di risposta lenti nei nostri tests e sarà insoddisfacente per i gamers. In confronto, tutti i dispositivi di test variano da 0.1 (minimo) a 240 (massimo) ms. » 88 % di tutti i dispositivi è migliore. Questo significa che i tempi di risposta rilevati sono peggiori rispetto alla media di tutti i dispositivi testati (21.5 ms). | ||
| ↔ Tempo di risposta dal 50% Grigio all'80% Grigio | ||
| 32.8 ms ... aumenta ↗ e diminuisce ↘ combinato | ↗ 16 ms Incremento |  |
| ↘ 16.8 ms Calo | ||
| Lo schermo mostra tempi di risposta lenti nei nostri tests e sarà insoddisfacente per i gamers. In confronto, tutti i dispositivi di test variano da 0.2 (minimo) a 636 (massimo) ms. » 38 % di tutti i dispositivi è migliore. Questo significa che i tempi di risposta rilevati sono simili alla media di tutti i dispositivi testati (33.7 ms). | ||
Sfarfallio dello schermo / PWM (Pulse-Width Modulation)
| flickering dello schermo / PWM non rilevato | 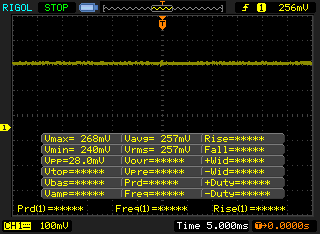 | ||
In confronto: 53 % di tutti i dispositivi testati non utilizza PWM per ridurre la luminosita' del display. Se è rilevato PWM, una media di 17924 (minimo: 5 - massimo: 3846000) Hz è stata rilevata. | |||
| Cinebench R10 | |
| Rendering Multiple CPUs 32Bit | |
| Dell XPS 13 9360 QHD+ i7 | |
| Dell XPS 13 9360 FHD i5 | |
| HP Spectre 13 | |
| Rendering Single 32Bit | |
| Dell XPS 13 9360 QHD+ i7 | |
| Dell XPS 13 9360 FHD i5 | |
| HP Spectre 13 | |
| wPrime 2.10 - 1024m | |
| Dell XPS 13 9360 QHD+ i5 | |
| HP Spectre 13 | |
| Dell XPS 13 9360 QHD+ i7 | |
| Super Pi Mod 1.5 XS 32M - 32M | |
| HP Spectre 13 | |
| Dell XPS 13 9360 FHD i5 | |
| Dell XPS 13 9360 QHD+ i7 | |
* ... Meglio usare valori piccoli
| PCMark 8 Home Score Accelerated v2 | 3535 punti | |
| PCMark 8 Creative Score Accelerated v2 | 4211 punti | |
| PCMark 8 Work Score Accelerated v2 | 4568 punti | |
Aiuto | ||
| Dell XPS 13 9360 FHD i5 Toshiba NVMe THNSN5256GPUK | HP Spectre 13 Samsung PM951 NVMe MZVLV256 | Acer Aspire S 13 S5-371-71QZ LiteOn CV1-8B512 | Asus Zenbook UX330UA-FC059T SanDisk SD8SNAT256G1002 | Lenovo IdeaPad 710S-13ISK Samsung PM951 NVMe MZVLV256 | Razer Blade Stealth QHD i7-7500U Samsung PM951 NVMe MZVLV256 | Dell XPS 13 9360 QHD+ i7 Toshiba NVMe THNSN5256GPUK | |
|---|---|---|---|---|---|---|---|
| CrystalDiskMark 3.0 | -9% | -31% | -46% | -1% | -0% | 1% | |
| Read Seq | 1233 | 1322 7% | 502 -59% | 447.6 -64% | 1193 -3% | 1178 -4% | 1214 -2% |
| Write Seq | 733 | 305.5 -58% | 418.9 -43% | 309.4 -58% | 309.6 -58% | 305.4 -58% | 655 -11% |
| Read 512 | 1036 | 621 -40% | 341.3 -67% | 265.9 -74% | 613 -41% | 638 -38% | 1019 -2% |
| Write 512 | 439.9 | 306 -30% | 389.7 -11% | 275.2 -37% | 311 -29% | 305.7 -31% | 445.7 1% |
| Read 4k | 29.31 | 40.09 37% | 29.69 1% | 18.89 -36% | 42.43 45% | 38.54 31% | 35.55 21% |
| Write 4k | 116.9 | 119 2% | 86.8 -26% | 75.1 -36% | 144.9 24% | 153.4 31% | 130 11% |
| Read 4k QD32 | 479.2 | 513 7% | 301.3 -37% | 142.2 -70% | 549 15% | 614 28% | 537 12% |
| Write 4k QD32 | 218.3 | 231.5 6% | 211.2 -3% | 228.9 5% | 311.3 43% | 302.7 39% | 173.8 -20% |

| 3DMark | |
| 1280x720 Cloud Gate Standard Graphics | |
| Lenovo IdeaPad 710S-13ISK | |
| Dell XPS 13 2016 9350 (FHD, i7-6560U) | |
| Dell XPS 13 9360 FHD i5 | |
| Dell XPS 13 9360 QHD+ i7 | |
| Asus Zenbook UX330UA-FC059T | |
| HP Spectre 13 | |
| Dell XPS 13 9360 QHD+ i5 | |
| 1920x1080 Fire Strike Graphics | |
| Dell XPS 13 2016 9350 (FHD, i7-6560U) | |
| Dell XPS 13 9360 FHD i5 | |
| Dell XPS 13 9360 QHD+ i7 | |
| Dell XPS 13 9360 QHD+ i5 | |
| HP Spectre 13 | |
| 3DMark 11 Performance | 1699 punti | |
| 3DMark Ice Storm Standard Score | 64297 punti | |
| 3DMark Cloud Gate Standard Score | 6349 punti | |
| 3DMark Fire Strike Score | 892 punti | |
| 3DMark Fire Strike Extreme Score | 405 punti | |
Aiuto | ||
| Tomb Raider | |
| 1024x768 Low Preset (ordina per valore) | |
| Dell XPS 13 9360 FHD i5 | |
| 1366x768 Normal Preset AA:FX AF:4x (ordina per valore) | |
| Dell XPS 13 9360 FHD i5 | |
| 1366x768 High Preset AA:FX AF:8x (ordina per valore) | |
| Dell XPS 13 9360 FHD i5 | |
| 1920x1080 Ultra Preset AA:FX AF:16x (ordina per valore) | |
| Dell XPS 13 9360 FHD i5 | |
| basso | medio | alto | ultra | |
| Tomb Raider (2013) | 83.8 | 42.6 | 25.9 | 12 |
| GRID 2 (2013) | 79.7 | 46.4 | 33.7 | 12.5 |
Rumorosità
| Idle |
| 28.9 / 28.9 / 28.9 dB(A) |
| Sotto carico |
| 30.9 / 33.5 dB(A) |
 | ||
30 dB silenzioso 40 dB(A) udibile 50 dB(A) rumoroso |
||
min: | ||
| Dell XPS 13 9360 FHD i5 HD Graphics 620, i5-7200U, Toshiba NVMe THNSN5256GPUK | HP Spectre 13 HD Graphics 520, 6500U, Samsung PM951 NVMe MZVLV256 | Acer Aspire S 13 S5-371-71QZ HD Graphics 520, 6500U, LiteOn CV1-8B512 | Asus Zenbook UX330UA-FC059T HD Graphics 520, 6500U, SanDisk SD8SNAT256G1002 | Lenovo IdeaPad 710S-13ISK Iris Graphics 540, 6560U, Samsung PM951 NVMe MZVLV256 | Razer Blade Stealth QHD i7-7500U HD Graphics 620, i7-7500U, Samsung PM951 NVMe MZVLV256 | Dell XPS 13 2016 9350 (FHD, i7-6560U) Iris Graphics 540, 6560U, Samsung PM951 NVMe MZ-VLV256D | Dell XPS 13 9360 QHD+ i5 HD Graphics 620, i5-7200U, Toshiba NVMe THNSN5256GPUK | |
|---|---|---|---|---|---|---|---|---|
| Noise | -13% | -10% | -14% | -11% | -11% | -9% | -8% | |
| Idle Minimum * | 28.9 | 28.5 1% | 31.2 -8% | 31.2 -8% | 30.1 -4% | 31 -7% | 30 -4% | 30.6 -6% |
| Idle Average * | 28.9 | 30.9 -7% | 31.2 -8% | 31.2 -8% | 30.1 -4% | 31 -7% | 30 -4% | 30.6 -6% |
| Idle Maximum * | 28.9 | 31.6 -9% | 31.5 -9% | 31.2 -8% | 30.1 -4% | 31 -7% | 30 -4% | 32.2 -11% |
| Load Average * | 30.9 | 38.8 -26% | 35.7 -16% | 37.4 -21% | 39.2 -27% | 35 -13% | 36.5 -18% | 32.2 -4% |
| Load Maximum * | 33.5 | 41.4 -24% | 35.8 -7% | 41.4 -24% | 39.3 -17% | 40.5 -21% | 38.3 -14% | 38.5 -15% |
| off /ambiente * | 28.5 | 31.2 | 31.2 | 29 | 31 | 30 | 30.3 |
* ... Meglio usare valori piccoli
(±) La temperatura massima sul lato superiore è di 43.4 °C / 110 F, rispetto alla media di 35.9 °C / 97 F, che varia da 21.4 a 59 °C per questa classe Subnotebook.
(-) Il lato inferiore si riscalda fino ad un massimo di 49.2 °C / 121 F, rispetto alla media di 39.4 °C / 103 F
(+) In idle, la temperatura media del lato superiore è di 25.1 °C / 77 F, rispetto alla media deld ispositivo di 30.7 °C / 87 F.
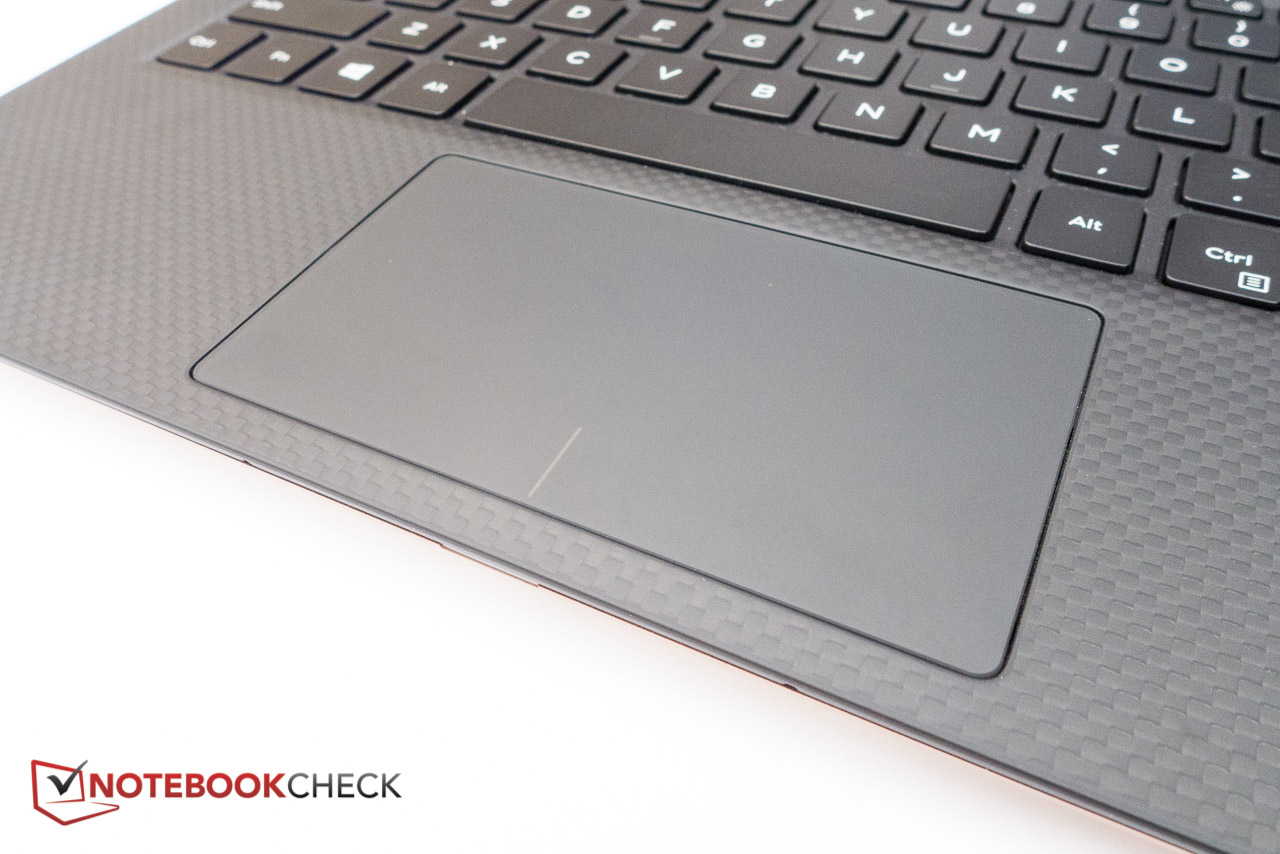
(+) I poggiapolsi e il touchpad sono piu' freddi della temperatura della pelle con un massimo di 29.4 °C / 84.9 F e sono quindi freddi al tatto.
(±) La temperatura media della zona del palmo della mano di dispositivi simili e'stata di 28.3 °C / 82.9 F (-1.1 °C / -2 F).
Dell XPS 13 9360 FHD i5 analisi audio
(-) | altoparlanti non molto potenti (70.3 dB)
Bassi 100 - 315 Hz
(±) | bassi ridotti - in media 6.9% inferiori alla media
(±) | la linearità dei bassi è media (10.5% delta rispetto alla precedente frequenza)
Medi 400 - 2000 Hz
(+) | medi bilanciati - solo only 3.7% rispetto alla media
(+) | medi lineari (4% delta rispetto alla precedente frequenza)
Alti 2 - 16 kHz
(+) | Alti bilanciati - appena 2% dalla media
(±) | la linearità degli alti è media (10.3% delta rispetto alla precedente frequenza)
Nel complesso 100 - 16.000 Hz
(±) | la linearità complessiva del suono è media (18.3% di differenza rispetto alla media
Rispetto alla stessa classe
» 48% di tutti i dispositivi testati in questa classe è stato migliore, 7% simile, 45% peggiore
» Il migliore ha avuto un delta di 5%, medio di 19%, peggiore di 53%
Rispetto a tutti i dispositivi testati
» 34% di tutti i dispositivi testati in questa classe è stato migliore, 8% similare, 58% peggiore
» Il migliore ha avuto un delta di 4%, medio di 25%, peggiore di 134%
Apple MacBook 12 (Early 2016) 1.1 GHz analisi audio
(+) | gli altoparlanti sono relativamente potenti (83.6 dB)
Bassi 100 - 315 Hz
(±) | bassi ridotti - in media 11.3% inferiori alla media
(±) | la linearità dei bassi è media (14.2% delta rispetto alla precedente frequenza)
Medi 400 - 2000 Hz
(+) | medi bilanciati - solo only 2.4% rispetto alla media
(+) | medi lineari (5.5% delta rispetto alla precedente frequenza)
Alti 2 - 16 kHz
(+) | Alti bilanciati - appena 2% dalla media
(+) | alti lineari (4.5% delta rispetto alla precedente frequenza)
Nel complesso 100 - 16.000 Hz
(+) | suono nel complesso lineare (10.2% differenza dalla media)
Rispetto alla stessa classe
» 5% di tutti i dispositivi testati in questa classe è stato migliore, 2% simile, 93% peggiore
» Il migliore ha avuto un delta di 5%, medio di 19%, peggiore di 53%
Rispetto a tutti i dispositivi testati
» 3% di tutti i dispositivi testati in questa classe è stato migliore, 1% similare, 96% peggiore
» Il migliore ha avuto un delta di 4%, medio di 25%, peggiore di 134%
| Off / Standby | |
| Idle | |
| Sotto carico |
|
Leggenda:
min: Attualmente utilizziamo il Metrahit Energy, un multimetro digitale professionale per la misurazione della qualità della potenza e dell'energia monofase, per le nostre misurazioni. | |
| Dell XPS 13 9360 FHD i5 i5-7200U, HD Graphics 620, Toshiba NVMe THNSN5256GPUK, IPS, 1920x1080, 13.30 | HP Spectre 13 6500U, HD Graphics 520, Samsung PM951 NVMe MZVLV256, IPS UWVA, 1920x1080, 13.30 | Acer Aspire S 13 S5-371-71QZ 6500U, HD Graphics 520, LiteOn CV1-8B512, IPS, 1920x1080, 13.30 | Asus Zenbook UX330UA-FC059T 6500U, HD Graphics 520, SanDisk SD8SNAT256G1002, IPS, 1920x1080, 13.30 | Lenovo IdeaPad 710S-13ISK 6560U, Iris Graphics 540, Samsung PM951 NVMe MZVLV256, IPS, 1920x1080, 13.30 | Razer Blade Stealth QHD i7-7500U i7-7500U, HD Graphics 620, Samsung PM951 NVMe MZVLV256, , 2560x1440, 12.50 | Dell XPS 13 9360 QHD+ i7 i7-7500U, HD Graphics 620, Toshiba NVMe THNSN5256GPUK, IPS, 3200x1800, 13.30 | Dell XPS 13 2016 9350 (FHD, i7-6560U) 6560U, Iris Graphics 540, Samsung PM951 NVMe MZ-VLV256D, IPS, 1920x1080, 13.30 | Dell XPS 13 9360 QHD+ i5 i5-7200U, HD Graphics 620, Toshiba NVMe THNSN5256GPUK, , 3200x1800, 13.30 | |
|---|---|---|---|---|---|---|---|---|---|
| Power Consumption | -94% | -32% | -28% | -46% | -50% | -36% | -46% | -21% | |
| Idle Minimum * | 4.1 | 8.6 -110% | 4.1 -0% | 3 27% | 3.3 20% | 4.4 -7% | 6.4 -56% | 5.8 -41% | 3.7 10% |
| Idle Average * | 4.2 | 11 -162% | 6.7 -60% | 6.3 -50% | 7.4 -76% | 5.8 -38% | 6.6 -57% | 7.3 -74% | 6.1 -45% |
| Idle Maximum * | 5.1 | 11.3 -122% | 7.4 -45% | 7.5 -47% | 8.2 -61% | 8.6 -69% | 6.8 -33% | 8.5 -67% | 6.5 -27% |
| Load Average * | 22.1 | 33.8 -53% | 32.4 -47% | 36 -63% | 36.5 -65% | 35.2 -59% | 27.5 -24% | 30.6 -38% | 29.5 -33% |
| Load Maximum * | 29.4 | 36.2 -23% | 32.4 -10% | 31.5 -7% | 43.7 -49% | 52 -77% | 32.4 -10% | 32.5 -11% | 33 -12% |
* ... Meglio usare valori piccoli
| Dell XPS 13 9360 FHD i5 i5-7200U, HD Graphics 620, 60 Wh | HP Spectre 13 6500U, HD Graphics 520, 38 Wh | Acer Aspire S 13 S5-371-71QZ 6500U, HD Graphics 520, 45 Wh | Asus Zenbook UX330UA-FC059T 6500U, HD Graphics 520, 57 Wh | Lenovo IdeaPad 710S-13ISK 6560U, Iris Graphics 540, 46 Wh | Razer Blade Stealth QHD i7-7500U i7-7500U, HD Graphics 620, 53.6 Wh | Dell XPS 13 9360 QHD+ i7 i7-7500U, HD Graphics 620, 60 Wh | Dell XPS 13 9360 QHD+ i5 i5-7200U, HD Graphics 620, 60 Wh | |
|---|---|---|---|---|---|---|---|---|
| Autonomia della batteria | -48% | -29% | -14% | -39% | -32% | -20% | -18% | |
| Reader / Idle | 1295 | 715 -45% | 1028 -21% | 1225 -5% | 810 -37% | 817 -37% | 1053 -19% | |
| WiFi v1.3 | 677 | 338 -50% | 472 -30% | 612 -10% | 418 -38% | 498 -26% | 516 -24% | 526 -22% |
| Load | 157 | 78 -50% | 99 -37% | 115 -27% | 89 -43% | 105 -33% | 129 -18% | 137 -13% |
Pro
Contro
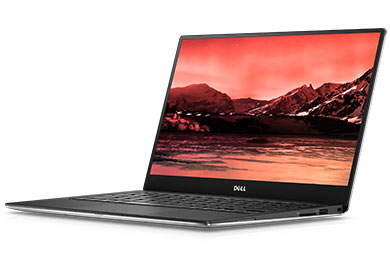
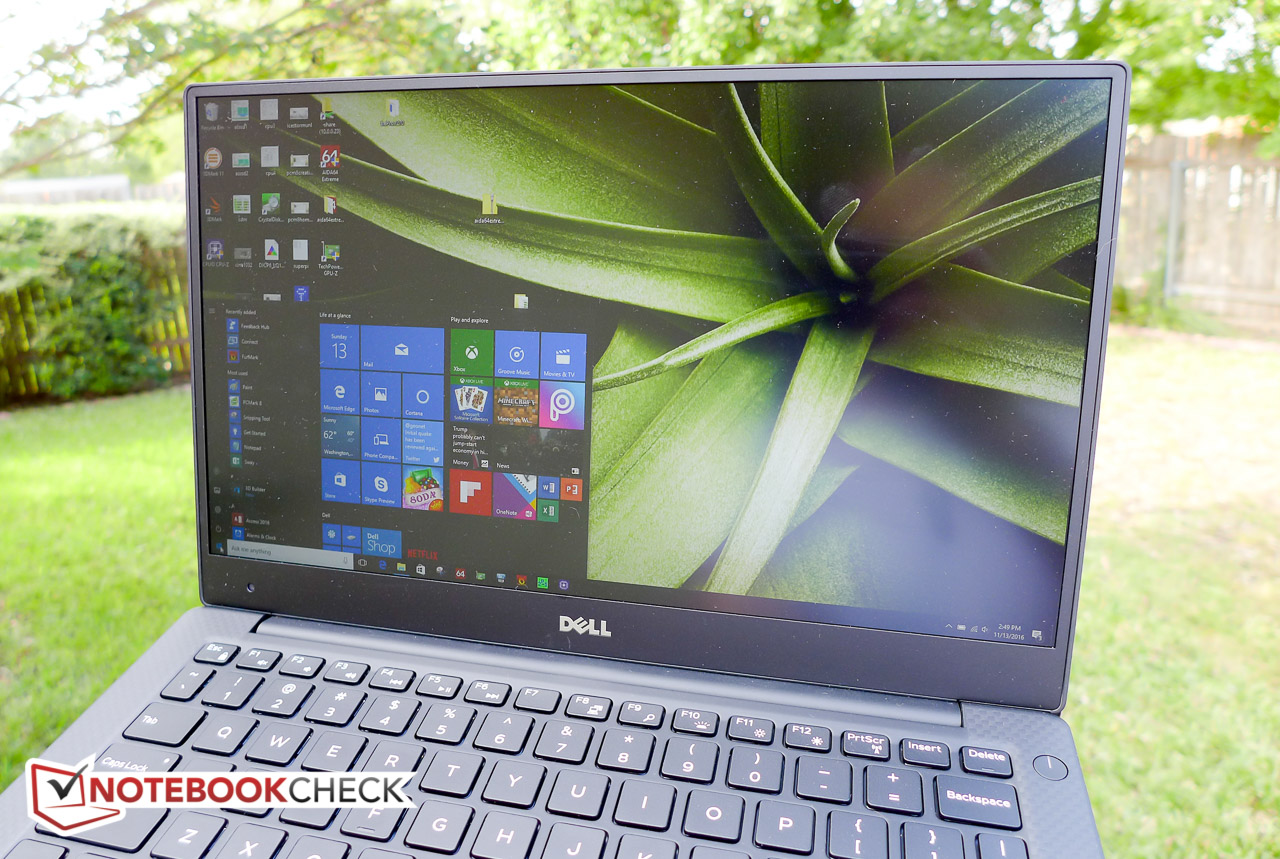
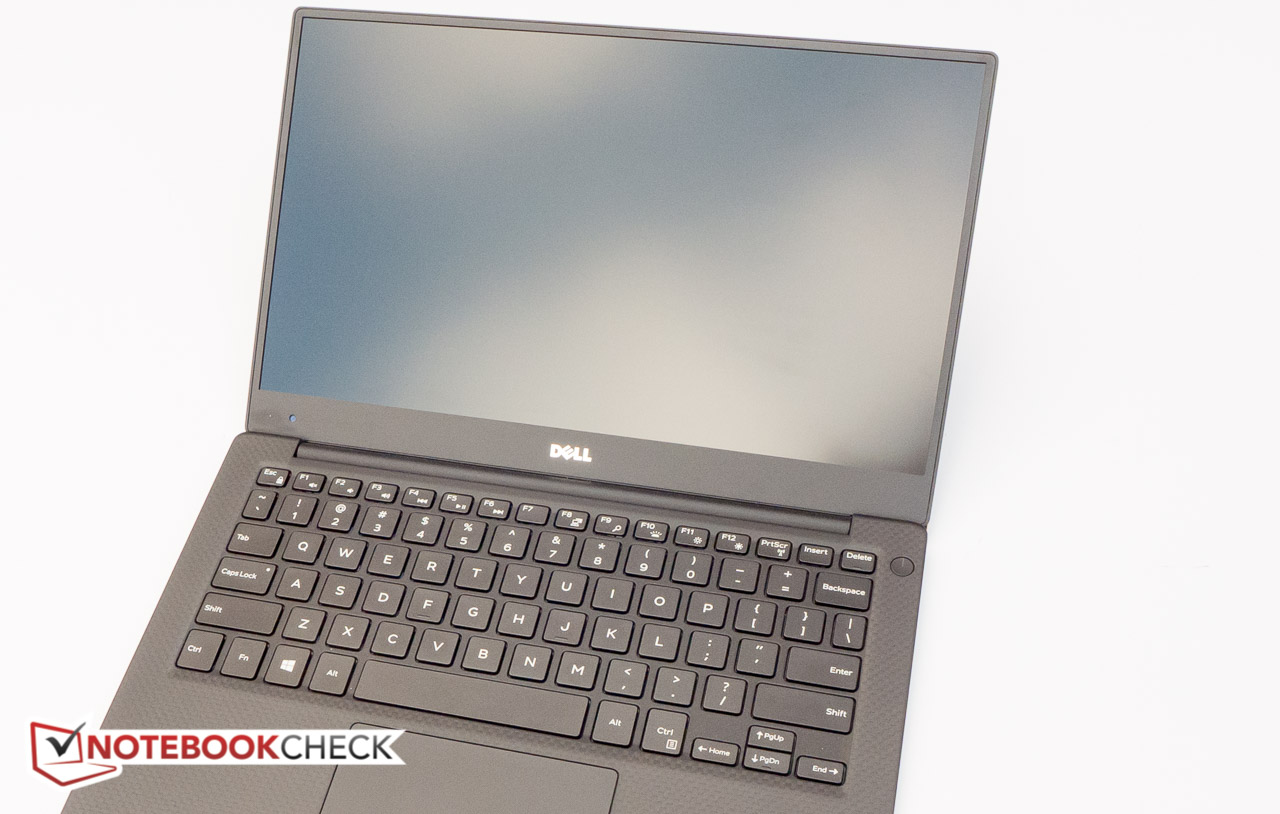
Il Dell XPS 13 9360 con display FHD e il processore i5 7a generazione riprende da dove i predecessori hanno lasciato. Il chipset Kaby Lake lavora come previsto, il funzionamento è agevole e veloce e il notebook resta discreto durante tutti gli scenari più estremi. Il nuovo processore i5 è più o meno alla pari con la precedente CPU i7 (Skylake). L'aggiornamento alla nuova CPU i7 al costo di $ 200 in più non rende perfomance maggiori - soprattutto perché Intel Iris GPU non è parte del pacchetto. Per la maggior parte degli utenti, la recensione della configurazione con i5-7200U, 8 GB di RAM e 256 NVMe SSD probabilmente ha colpito il punto caro. L'aggiornamento alla QHD + display ha senso solo per chi desidera la risoluzione molto più elevata e vuole un touchscreen - siamo onestamente abbastanza soddisfatti con il display FHD. Con una durata della batteria che si avvicina quasi alle 12 ore, il laptop dura il doppio del tempo rispetto ad alcuni concorrenti. Le nostre lamentele sono minori: preferiremmo display con una migliore precisione del colore e la luminosità più elevata, il sistema può diventare piuttosto caldo quando sottoposto a stress notevole. C'è anche la posizione della webcam sul bordo inferiore sinistro del display, che potrebbe interessare ad alcuni potenziali acquirenti.
L'XPS 13 spunta tutte le corrette caselle di controllo. Le perfomance del display potrebbero non essere il meglio rispetto alla concorrenza dell'ultra-portatile, ma questo è un inconveniente davvero di poco conto.
Gli altri sistemi nella nostra recensione sono tutti - ciascuno a suo modo - scelte decenti. Anche se è giunto alla sua quarta generazione, l'XPS 13 è ancora abbastanza unico con la sua cornice ultra-sottile e l'equilibrio tra leggerezza, design, potenza e valore. È pertanto ancora un top pick in questa categoria.
Nota: si tratta di una recensione breve, con alcune sezioni non tradotte, per la versione integrale in inglese guardate qui.
Dell XPS 13 9360 FHD i5
-
12/07/2016 v6(old)
Bernhard Pechlaner
Pricecompare
