 Deutsch
 English
 Español
 Français
 Italiano
 Nederlands
 Polski
 Português
 Русский
 Türkçe
 Svenska
 Chinese
 Magyar
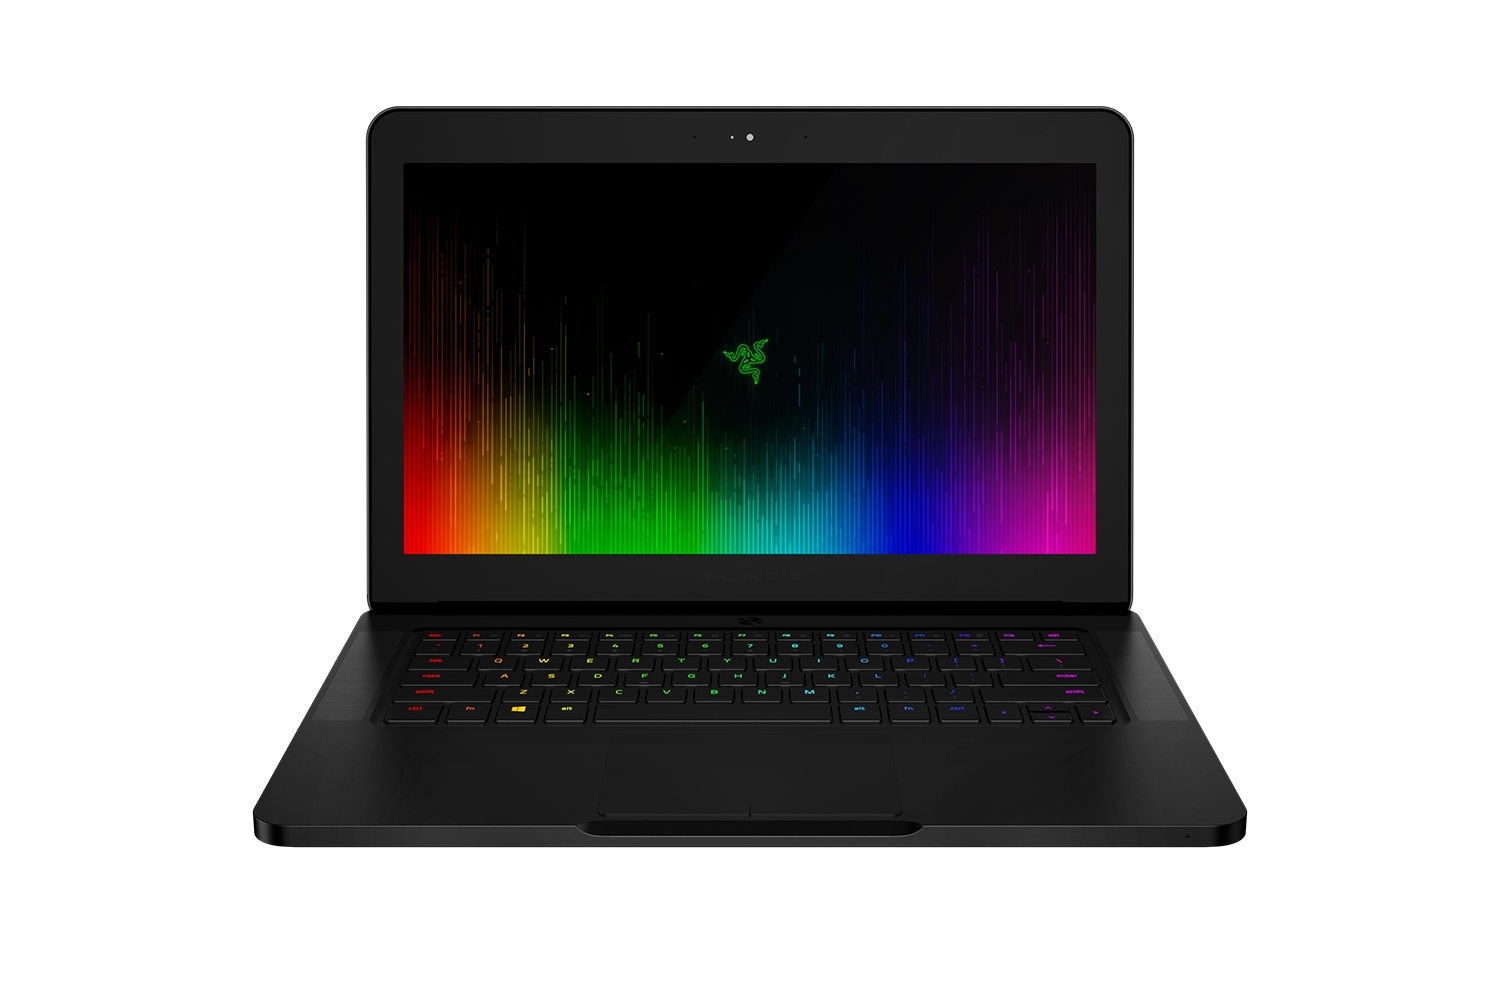
Recensione breve del Portatile Razer Blade (2016) FHD


| Networking | |
| iperf3 transmit AX12 | |
| Razer Blade (2016) | |
| Razer Blade (2016) FHD | |
| Asus Strix GL502VM-FY039T | |
| iperf3 receive AX12 | |
| Asus Strix GL502VM-FY039T | |
| Razer Blade (2016) | |
| Razer Blade (2016) FHD | |
| |||||||||||||||||||||||||
Distribuzione della luminosità: 84 %
Al centro con la batteria: 272 cd/m²
Contrasto: 1046:1 (Nero: 0.26 cd/m²)
ΔE Color 4.59 | 0.5-29.43 Ø5
ΔE Greyscale 4.28 | 0.57-98 Ø5.3
83% sRGB (Argyll 1.6.3 3D)
55% AdobeRGB 1998 (Argyll 1.6.3 3D)
60.9% AdobeRGB 1998 (Argyll 2.2.0 3D)
83.4% sRGB (Argyll 2.2.0 3D)
65.2% Display P3 (Argyll 2.2.0 3D)
Gamma: 2.23
| Razer Blade (2016) FHD LG Philips LP140WF3-SPD1 (LGD046D), 1920x1080 | Razer Blade (2016) Sharp LQ140Z1JW01 (SHP1401), 3200x1800 | MSI GS43VR 6RE-006US Name: LG Philips LP140WF3-SPD1, ID: LGD046D, 1920x1080 | Gigabyte P34W v5 2560x1440 | SCHENKER XMG P406 LG Philips 140WF1 (LGD040A), 1920x1080 | Asus Strix GL502VM-FY039T LG Philips LP156WF6-SPB6 (LGD046F), 1920x1080 | |
|---|---|---|---|---|---|---|
| Display | 10% | 3% | -14% | 0% | -0% | |
| Display P3 Coverage | 65.2 | 66.9 3% | 65.5 0% | 51.4 -21% | 66.2 2% | 64.5 -1% |
| sRGB Coverage | 83.4 | 96.8 16% | 86.4 4% | 76.6 -8% | 82.8 -1% | 83.4 0% |
| AdobeRGB 1998 Coverage | 60.9 | 68.2 12% | 63.1 4% | 52.8 -13% | 60.5 -1% | 60.9 0% |
| Response Times | -15% | 20% | 7% | -17% | 10% | |
| Response Time Grey 50% / Grey 80% * | 47 ? | 41 ? 13% | 31.6 ? 33% | 41.2 ? 12% | 56 ? -19% | 40 ? 15% |
| Response Time Black / White * | 26 ? | 37 ? -42% | 24.4 ? 6% | 25.4 ? 2% | 30 ? -15% | 25 ? 4% |
| PWM Frequency | 200 ? | |||||
| Screen | 29% | 9% | 3% | 1% | 1% | |
| Brightness middle | 272 | 328 21% | 288.4 6% | 277.8 2% | 282 4% | 321 18% |
| Brightness | 277 | 328 18% | 282 2% | 270 -3% | 266 -4% | 296 7% |
| Brightness Distribution | 84 | 69 -18% | 83 -1% | 83 -1% | 81 -4% | 88 5% |
| Black Level * | 0.26 | 0.22 15% | 0.35 -35% | 0.38 -46% | 0.22 15% | 0.33 -27% |
| Contrast | 1046 | 1491 43% | 824 -21% | 731 -30% | 1282 23% | 973 -7% |
| Colorchecker dE 2000 * | 4.59 | 1.91 58% | 2.61 43% | 2.71 41% | 4.98 -8% | 4.42 4% |
| Colorchecker dE 2000 max. * | 8.49 | 3.23 62% | 7.34 14% | 5.47 36% | 10.2 -20% | 9.78 -15% |
| Greyscale dE 2000 * | 4.28 | 1.69 61% | 1.18 72% | 2.11 51% | 4.08 5% | 3.34 22% |
| Gamma | 2.23 99% | 2.3 96% | 2.24 98% | 2.19 100% | 2.51 88% | 2.4 92% |
| CCT | 6848 95% | 6418 101% | 6506 100% | 6314 103% | 5877 111% | 6213 105% |
| Color Space (Percent of AdobeRGB 1998) | 55 | 63 15% | 56.4 3% | 48.5 -12% | 54 -2% | 55 0% |
| Color Space (Percent of sRGB) | 83 | 97 17% | 86.4 4% | 76.9 -7% | 83 0% | 83 0% |
| Media totale (Programma / Settaggio) | 8% /
20% | 11% /
9% | -1% /
0% | -5% /
-2% | 4% /
2% |
* ... Meglio usare valori piccoli
Sfarfallio dello schermo / PWM (Pulse-Width Modulation)
| flickering dello schermo / PWM non rilevato | 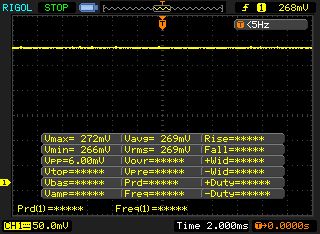 | ||
In confronto: 53 % di tutti i dispositivi testati non utilizza PWM per ridurre la luminosita' del display. Se è rilevato PWM, una media di 17915 (minimo: 5 - massimo: 3846000) Hz è stata rilevata. | |||
Tempi di risposta del Display
| ↔ Tempi di risposta dal Nero al Bianco | ||
|---|---|---|
| 26 ms ... aumenta ↗ e diminuisce ↘ combinato | ↗ 6 ms Incremento |  |
| ↘ 20 ms Calo | ||
| Lo schermo mostra tempi di risposta relativamente lenti nei nostri tests e potrebbe essere troppo lento per i gamers. In confronto, tutti i dispositivi di test variano da 0.1 (minimo) a 240 (massimo) ms. » 57 % di tutti i dispositivi è migliore. Questo significa che i tempi di risposta rilevati sono peggiori rispetto alla media di tutti i dispositivi testati (21.5 ms). | ||
| ↔ Tempo di risposta dal 50% Grigio all'80% Grigio | ||
| 47 ms ... aumenta ↗ e diminuisce ↘ combinato | ↗ 14 ms Incremento | 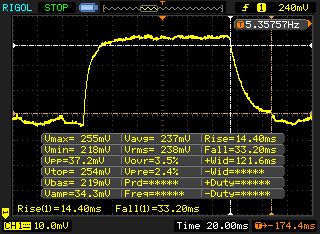 |
| ↘ 33 ms Calo | ||
| Lo schermo mostra tempi di risposta lenti nei nostri tests e sarà insoddisfacente per i gamers. In confronto, tutti i dispositivi di test variano da 0.2 (minimo) a 636 (massimo) ms. » 78 % di tutti i dispositivi è migliore. Questo significa che i tempi di risposta rilevati sono peggiori rispetto alla media di tutti i dispositivi testati (33.7 ms). | ||

| Cinebench R10 | |
| Rendering Multiple CPUs 32Bit | |
| Razer Blade (2016) FHD | |
| Asus Strix GL502VM-FY039T | |
| SCHENKER XMG P406 | |
| Gigabyte P34W v5 | |
| MSI GS43VR 6RE-006US | |
| Rendering Single 32Bit | |
| Razer Blade (2016) FHD | |
| Asus Strix GL502VM-FY039T | |
| Gigabyte P34W v5 | |
| SCHENKER XMG P406 | |
| MSI GS43VR 6RE-006US | |
| Geekbench 3 | |
| 32 Bit Single-Core Score | |
| Razer Blade (2016) FHD | |
| Asus Strix GL502VM-FY039T | |
| 32 Bit Multi-Core Score | |
| Razer Blade (2016) FHD | |
| Asus Strix GL502VM-FY039T | |
| Geekbench 4.0 | |
| 64 Bit Single-Core Score | |
| Razer Blade (2016) FHD | |
| Asus Strix GL502VM-FY039T | |
| 64 Bit Multi-Core Score | |
| Razer Blade (2016) FHD | |
| Asus Strix GL502VM-FY039T | |
| JetStream 1.1 - Total Score | |
| Asus Strix GL502VM-FY039T | |
| Razer Blade (2016) FHD | |
| MSI GS43VR 6RE-006US | |
| PCMark 7 Score | 5874 punti | |
| PCMark 8 Home Score Accelerated v2 | 4010 punti | |
| PCMark 8 Creative Score Accelerated v2 | 4942 punti | |
| PCMark 8 Work Score Accelerated v2 | 4920 punti | |
Aiuto | ||
| PCMark 8 | |
| Home Score Accelerated v2 | |
| Asus Strix GL502VM-FY039T | |
| MSI GS43VR 6RE-006US | |
| Razer Blade (2016) FHD | |
| Gigabyte P34W v5 | |
| Razer Blade (2016) | |
| SCHENKER XMG P406 | |
| Work Score Accelerated v2 | |
| Asus Strix GL502VM-FY039T | |
| SCHENKER XMG P406 | |
| Razer Blade (2016) FHD | |
| MSI GS43VR 6RE-006US | |
| Gigabyte P34W v5 | |
| Razer Blade (2016) | |

| Razer Blade (2016) FHD | Razer Blade (2016) Samsung PM951 NVMe MZVLV512 | MSI GS43VR 6RE-006US SanDisk SD8SN8U1T001122 | Gigabyte P34W v5 Samsung SSD 950 Pro 512GB m.2 NVMe | SCHENKER XMG P406 Samsung SM951 MZHPV256HDGL m.2 PCI-e | Asus Strix GL502VM-FY039T Micron SSD 1100 (MTFDDAV256TBN) | |
|---|---|---|---|---|---|---|
| CrystalDiskMark 3.0 | -25% | -73% | 8% | -14% | -58% | |
| Read Seq | 1977 | 1296 -34% | 335.3 -83% | 2269 15% | 1634 -17% | 462.5 -77% |
| Write Seq | 1668 | 603 -64% | 299 -82% | 1524 -9% | 1290 -23% | 462.7 -72% |
| Read 512 | 800 | 655 -18% | 223 -72% | 937 17% | 1149 44% | 335 -58% |
| Write 512 | 1030 | 604 -41% | 246.7 -76% | 1483 44% | 1285 25% | 407.1 -60% |
| Read 4k | 58.1 | 42.22 -27% | 17.68 -70% | 53.8 -7% | 43.82 -25% | 25.61 -56% |
| Write 4k | 145.6 | 139.6 -4% | 35.31 -76% | 167.3 15% | 110.3 -24% | 86.3 -41% |
| Read 4k QD32 | 592 | 573 -3% | 247.4 -58% | 622 5% | 320.5 -46% | 246.7 -58% |
| Write 4k QD32 | 508 | 480 -6% | 156.3 -69% | 418.9 -18% | 287.3 -43% | 301.5 -41% |
| 3DMark 06 Standard Score | 25367 punti | |
| 3DMark 11 Performance | 11616 punti | |
| 3DMark Ice Storm Standard Score | 78946 punti | |
| 3DMark Cloud Gate Standard Score | 21402 punti | |
| 3DMark Fire Strike Score | 9117 punti | |
| 3DMark Fire Strike Extreme Score | 4873 punti | |
| 3DMark Time Spy Score | 3443 punti | |
Aiuto | ||
| 3DMark | |
| 2560x1440 Time Spy Graphics | |
| Asus Strix GL502VM-FY039T | |
| Razer Blade (2016) FHD | |
| 1920x1080 Fire Strike Graphics | |
| MSI GS43VR 6RE-006US | |
| Asus Strix GL502VM-FY039T | |
| Razer Blade (2016) | |
| Razer Blade (2016) FHD | |
| Gigabyte P34W v5 | |
| SCHENKER XMG P406 | |
| 3DMark 11 - 1280x720 Performance GPU | |
| Asus Strix GL502VM-FY039T | |
| MSI GS43VR 6RE-006US | |
| Razer Blade (2016) | |
| Razer Blade (2016) FHD | |
| Gigabyte P34W v5 | |
| SCHENKER XMG P406 | |
| BioShock Infinite - 1920x1080 Ultra Preset, DX11 (DDOF) | |
| Asus Strix GL502VM-FY039T | |
| MSI GS43VR 6RE-006US | |
| Razer Blade (2016) FHD | |
| Gigabyte P34W v5 | |
| Battlefield 4 - 1920x1080 Ultra Preset AA:4x MS | |
| Asus Strix GL502VM-FY039T | |
| Razer Blade (2016) FHD | |
| SCHENKER XMG P406 | |
| basso | medio | alto | ultra | |
| Tomb Raider (2013) | 347.4 | 312.1 | 261.9 | 131.7 |
| BioShock Infinite (2013) | 184.5 | 164.6 | 148.3 | 94 |
| Battlefield 4 (2013) | 168.1 | 167.8 | 154.1 | 94 |
| Anno 2205 (2015) | 110.4 | 103.3 | 79.2 | 28.6 |
| XCOM 2 (2016) | 85.5 | 62.8 | 52.8 | 27.8 |
| The Division (2016) | 184.6 | 120.7 | 61.2 | 48.2 |
| Ashes of the Singularity (2016) | 67.9 | 54.8 | 49.4 | |
| Deus Ex Mankind Divided (2016) | 114.4 | 93.8 | 52.4 | 28.1 |
Rumorosità
| Idle |
| 35 / 36 / 37 dB(A) |
| Sotto carico |
| 43 / 57 dB(A) |
 | ||
30 dB silenzioso 40 dB(A) udibile 50 dB(A) rumoroso |
||
min: | ||
| Razer Blade (2016) FHD 6700HQ, GeForce GTX 1060 Mobile | Razer Blade (2016) 6700HQ, GeForce GTX 1060 Mobile | MSI GS43VR 6RE-006US 6700HQ, GeForce GTX 1060 Mobile | Gigabyte P34W v5 6700HQ, GeForce GTX 970M | SCHENKER XMG P406 6700HQ, GeForce GTX 970M | Asus Strix GL502VM-FY039T 6700HQ, GeForce GTX 1060 Mobile | |
|---|---|---|---|---|---|---|
| Noise | 8% | 5% | 7% | 4% | 5% | |
| off /ambiente * | 31 | 30 3% | 29.1 6% | 31 -0% | ||
| Idle Minimum * | 35 | 31 11% | 32 9% | 31.6 10% | 30 14% | 32 9% |
| Idle Average * | 36 | 33 8% | 32 11% | 31.6 12% | 32 11% | 33 8% |
| Idle Maximum * | 37 | 35 5% | 33.5 9% | 32.5 12% | 40 -8% | 34 8% |
| Load Average * | 43 | 39 9% | 50 -16% | 46.5 -8% | 47 -9% | 44 -2% |
| Load Maximum * | 57 | 51 11% | 51.5 10% | 52.5 8% | 51 11% | 53 7% |
* ... Meglio usare valori piccoli
(-) La temperatura massima sul lato superiore è di 54 °C / 129 F, rispetto alla media di 40.4 °C / 105 F, che varia da 21.2 a 68.8 °C per questa classe Gaming.
(-) Il lato inferiore si riscalda fino ad un massimo di 49.4 °C / 121 F, rispetto alla media di 43.2 °C / 110 F
(+) In idle, la temperatura media del lato superiore è di 26.3 °C / 79 F, rispetto alla media deld ispositivo di 33.8 °C / 93 F.
(±) I poggiapolsi e il touchpad possono diventare molto caldi al tatto con un massimo di 39.9 °C / 103.8 F.
(-) La temperatura media della zona del palmo della mano di dispositivi simili e'stata di 28.9 °C / 84 F (-11 °C / -19.8 F).
| Razer Blade (2016) FHD 6700HQ, GeForce GTX 1060 Mobile | Razer Blade (2016) 6700HQ, GeForce GTX 1060 Mobile | MSI GS43VR 6RE-006US 6700HQ, GeForce GTX 1060 Mobile | Gigabyte P34W v5 6700HQ, GeForce GTX 970M | SCHENKER XMG P406 6700HQ, GeForce GTX 970M | Asus Strix GL502VM-FY039T 6700HQ, GeForce GTX 1060 Mobile | |
|---|---|---|---|---|---|---|
| Heat | -2% | -22% | -11% | -27% | -24% | |
| Maximum Upper Side * | 54 | 52.7 2% | 55.6 -3% | 59.3 -10% | 55 -2% | 65.3 -21% |
| Maximum Bottom * | 49.4 | 48.4 2% | 62.4 -26% | 56.5 -14% | 58.7 -19% | 64.4 -30% |
| Idle Upper Side * | 28 | 29.3 -5% | 33.2 -19% | 27.8 1% | 36.9 -32% | 35.4 -26% |
| Idle Bottom * | 26.8 | 28.4 -6% | 37.2 -39% | 31.8 -19% | 41.7 -56% | 31.6 -18% |
* ... Meglio usare valori piccoli
Razer Blade (2016) FHD analisi audio
(±) | potenza degli altiparlanti media ma buona (79 dB)
Bassi 100 - 315 Hz
(±) | bassi ridotti - in media 10.6% inferiori alla media
(±) | la linearità dei bassi è media (12.4% delta rispetto alla precedente frequenza)
Medi 400 - 2000 Hz
(+) | medi bilanciati - solo only 4.3% rispetto alla media
(+) | medi lineari (3.9% delta rispetto alla precedente frequenza)
Alti 2 - 16 kHz
(+) | Alti bilanciati - appena 3.5% dalla media
(+) | alti lineari (5.7% delta rispetto alla precedente frequenza)
Nel complesso 100 - 16.000 Hz
(±) | la linearità complessiva del suono è media (17.3% di differenza rispetto alla media
Rispetto alla stessa classe
» 44% di tutti i dispositivi testati in questa classe è stato migliore, 12% simile, 44% peggiore
» Il migliore ha avuto un delta di 6%, medio di 18%, peggiore di 132%
Rispetto a tutti i dispositivi testati
» 27% di tutti i dispositivi testati in questa classe è stato migliore, 8% similare, 65% peggiore
» Il migliore ha avuto un delta di 4%, medio di 25%, peggiore di 134%
MSI GS43VR 6RE-006US analisi audio
(±) | potenza degli altiparlanti media ma buona (76.7 dB)
Bassi 100 - 315 Hz
(-) | quasi nessun basso - in media 17.5% inferiori alla media
(±) | la linearità dei bassi è media (12% delta rispetto alla precedente frequenza)
Medi 400 - 2000 Hz
(+) | medi bilanciati - solo only 3.9% rispetto alla media
(±) | linearità dei medi adeguata (9.5% delta rispetto alla precedente frequenza)
Alti 2 - 16 kHz
(±) | alti elevati - circa 6.4% superiori alla media
(±) | la linearità degli alti è media (8.5% delta rispetto alla precedente frequenza)
Nel complesso 100 - 16.000 Hz
(±) | la linearità complessiva del suono è media (28.9% di differenza rispetto alla media
Rispetto alla stessa classe
» 94% di tutti i dispositivi testati in questa classe è stato migliore, 2% simile, 5% peggiore
» Il migliore ha avuto un delta di 6%, medio di 18%, peggiore di 132%
Rispetto a tutti i dispositivi testati
» 84% di tutti i dispositivi testati in questa classe è stato migliore, 3% similare, 13% peggiore
» Il migliore ha avuto un delta di 4%, medio di 25%, peggiore di 134%
| Off / Standby | |
| Idle | |
| Sotto carico |
|
Leggenda:
min: Attualmente utilizziamo il Metrahit Energy, un multimetro digitale professionale per la misurazione della qualità della potenza e dell'energia monofase, per le nostre misurazioni. | |
| Razer Blade (2016) FHD 6700HQ, GeForce GTX 1060 Mobile | Razer Blade (2016) 6700HQ, GeForce GTX 1060 Mobile | MSI GS43VR 6RE-006US 6700HQ, GeForce GTX 1060 Mobile | SCHENKER XMG P406 6700HQ, GeForce GTX 970M | Asus Strix GL502VM-FY039T 6700HQ, GeForce GTX 1060 Mobile | |
|---|---|---|---|---|---|
| Power Consumption | 13% | -9% | -5% | -7% | |
| Idle Minimum * | 14 | 9 36% | 12.1 14% | 12 14% | 16 -14% |
| Idle Average * | 18 | 14 22% | 19 -6% | 16 11% | 19 -6% |
| Idle Maximum * | 21 | 22 -5% | 19.5 7% | 22 -5% | 23 -10% |
| Load Average * | 70 | 72 -3% | 106.7 -52% | 90 -29% | 68 3% |
| Load Maximum * | 146 | 124 15% | 159 -9% | 170 -16% | 157 -8% |
* ... Meglio usare valori piccoli
| Razer Blade (2016) FHD 6700HQ, GeForce GTX 1060 Mobile, 70 Wh | Razer Blade (2016) 6700HQ, GeForce GTX 1060 Mobile, 70 Wh | MSI GS43VR 6RE-006US 6700HQ, GeForce GTX 1060 Mobile, 61 Wh | Gigabyte P34W v5 6700HQ, GeForce GTX 970M, 61 Wh | SCHENKER XMG P406 6700HQ, GeForce GTX 970M, 45 Wh | Asus Strix GL502VM-FY039T 6700HQ, GeForce GTX 1060 Mobile, 64 Wh | |
|---|---|---|---|---|---|---|
| Autonomia della batteria | -43% | -10% | -38% | -32% | -21% | |
| Reader / Idle | 760 | 577 -24% | 392 -48% | 275 -64% | 315 -59% | |
| H.264 | 312 | 235 -25% | ||||
| WiFi v1.3 | 427 | 243 -43% | 261 -39% | 232 -46% | 197 -54% | 220 -48% |
| Load | 59 | 78 32% | 47 -20% | 72 22% | 87 47% |
Pro
Contro
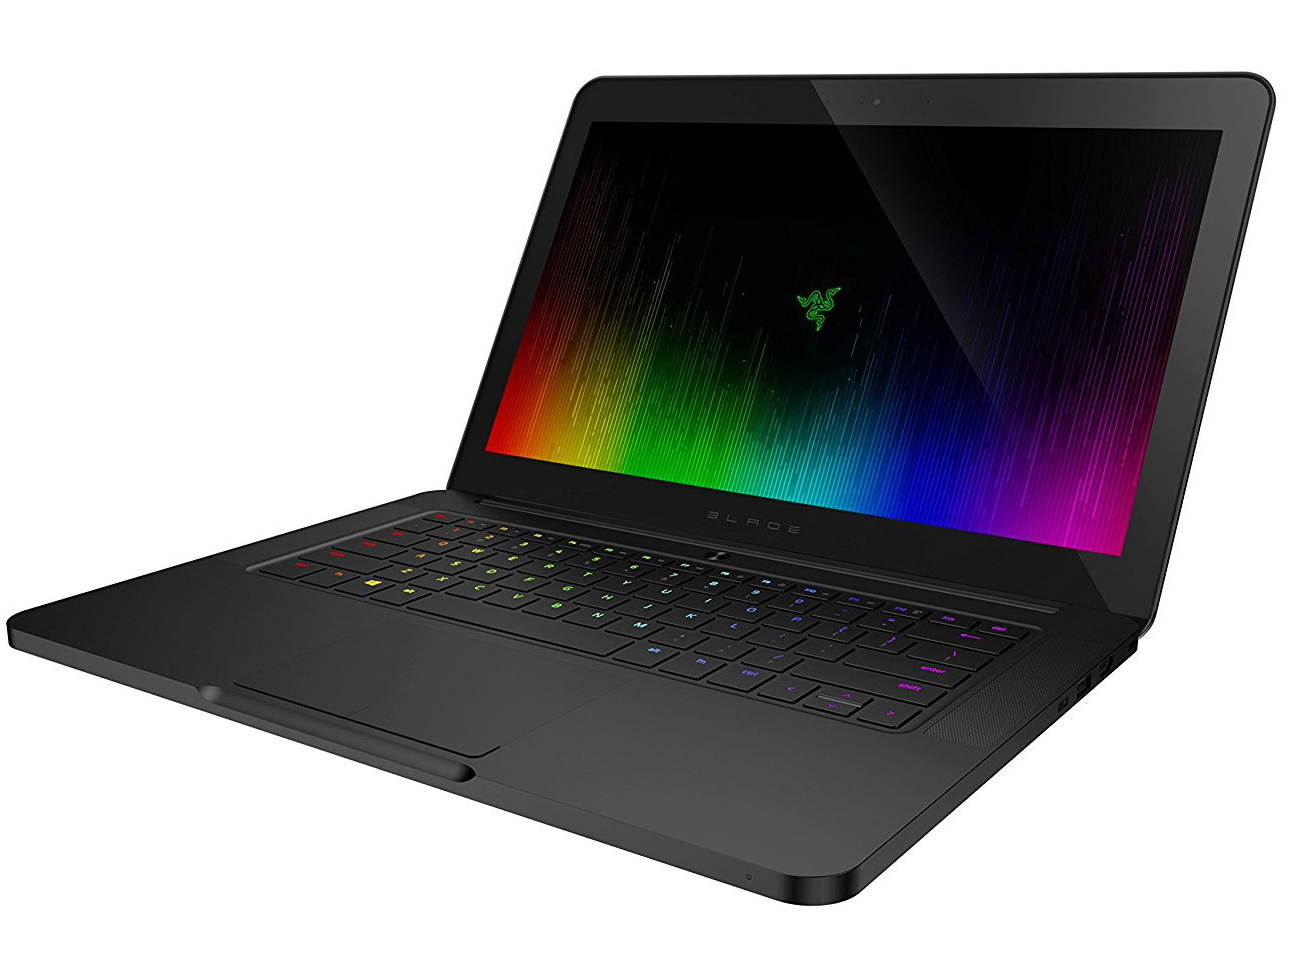
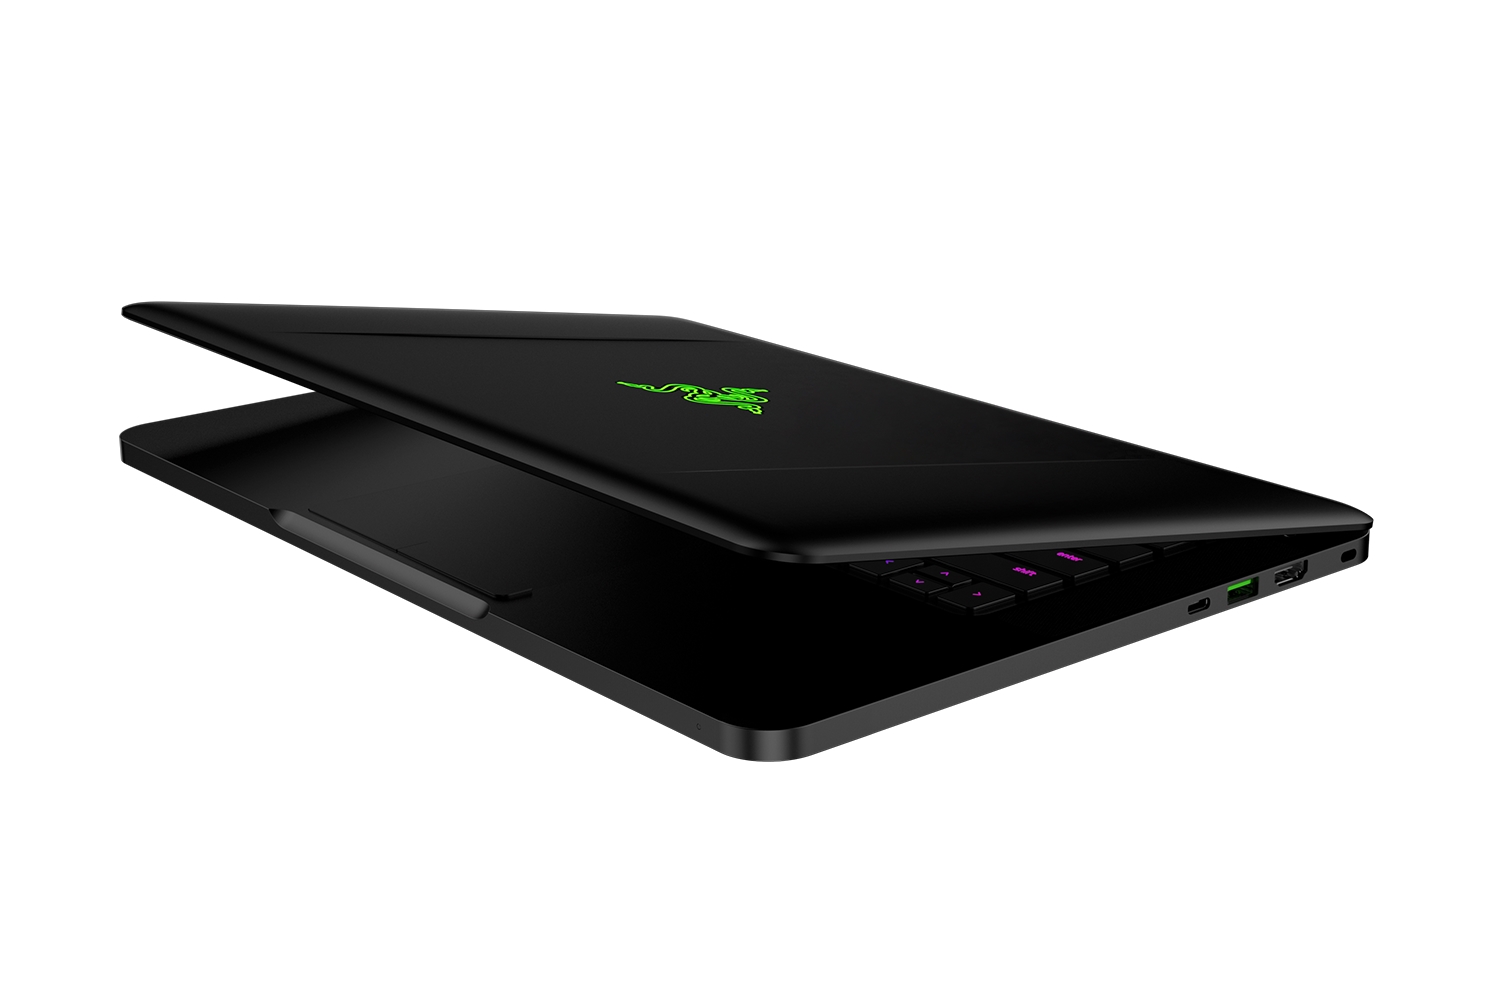
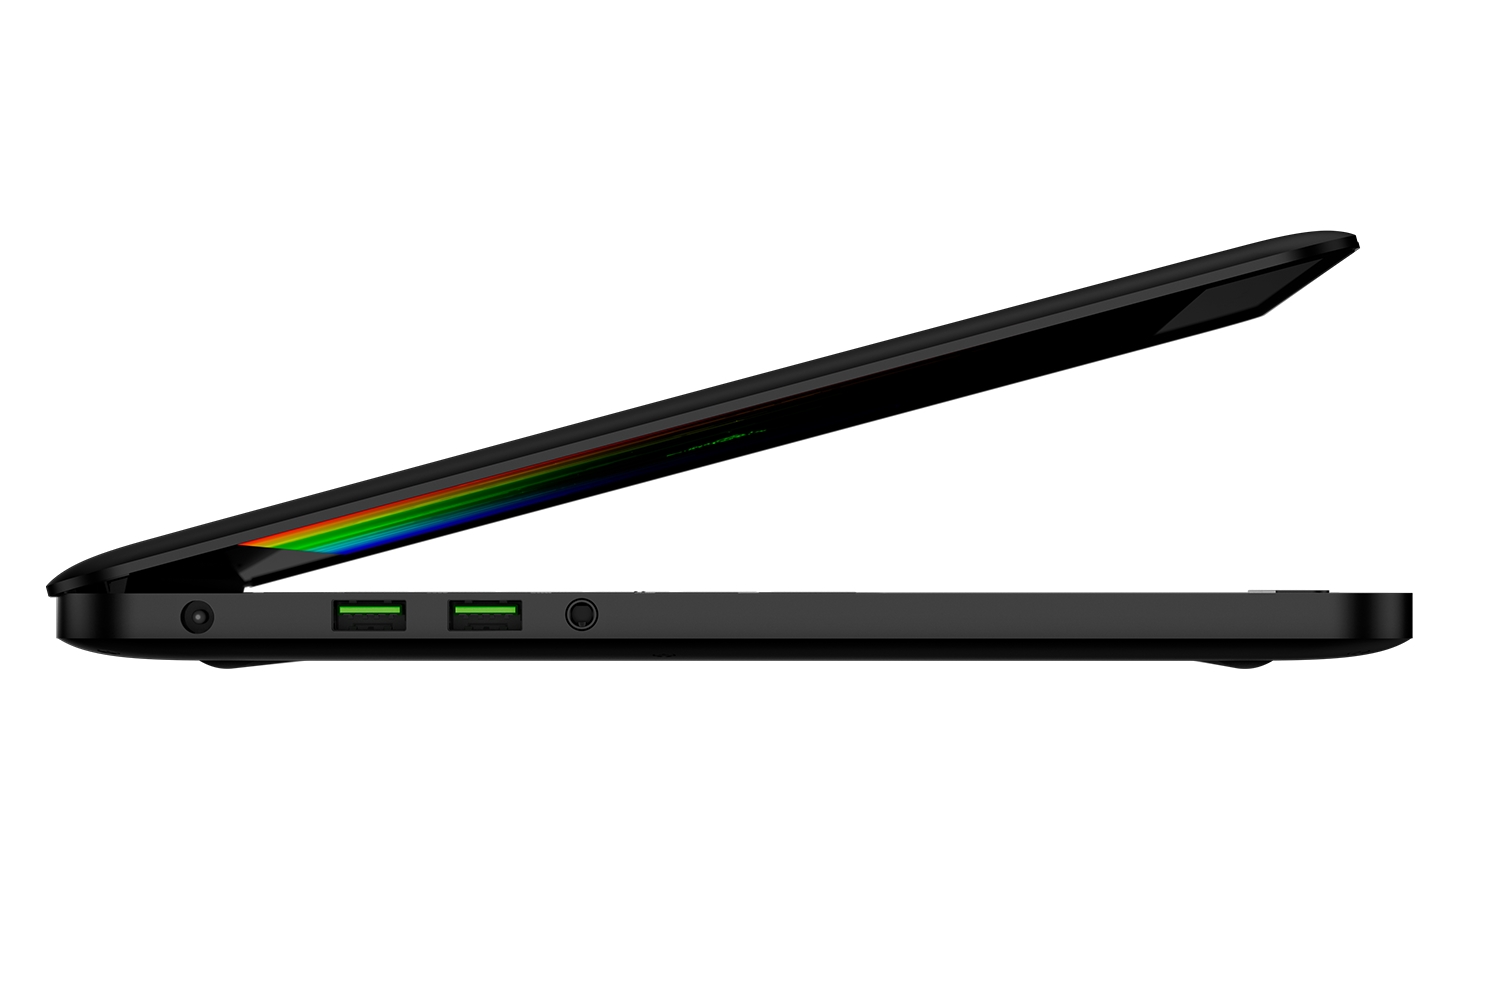
Razer mette molte prestazioni in un case molto sottile ed attraente. Il sistema riesce a gestire tutti i giochi moderni, ma i frame rates sono leggermente inferiori rispetto ai concorrenti più grandi. Le prestazioni di raffreddamento sono limitate a causa dello chassis piccolo, quindi il clock GPU soffre un po'. Non è mai completamente silenzioso - e non ce l'aspettavamo. Potete tuttavia convivere con la rumorosità. Un SSD estremamente veloce garantisce un sistema reattivo. Non è un problema rimuovere il pannello inferiore, ed il dispositivo è pronto anche al futuro con le sue porte. Manca solo una porta Gigabit-Ethernet, che se necessario si ottiene con un adattatore.
Il Full HD Blade è il miglior pacchetto completo.
La principale differenza con il modello precedentemente recensito del Blade è il display. Lo schermo con ampi angoli di visuale IPS Full HD ha una buona luminosità ed un adeguato valore di contrasto. Positivo: rispetto al display QHD+ del gemello, non notiamo alcun PWM flickering sul display Full HD. Quest'ultimo è anche più efficiente rispetto al touchscreen QHD+ e consente di avere una maggiore autonomia della batteria.
Nota: si tratta di una recensione breve, con alcune sezioni non tradotte, per la versione integrale in inglese guardate qui.
Razer Blade (2016) FHD
-
12/25/2016 v6(old)
Sascha Mölck
Pricecompare
