 Deutsch
 English
 Español
 Français
 Italiano
 Nederlands
 Polski
 Português
 Русский
 Türkçe
 Svenska
 Chinese
 Magyar
Recensione breve del Portatile MSI GE72VR 6RF Apache Pro


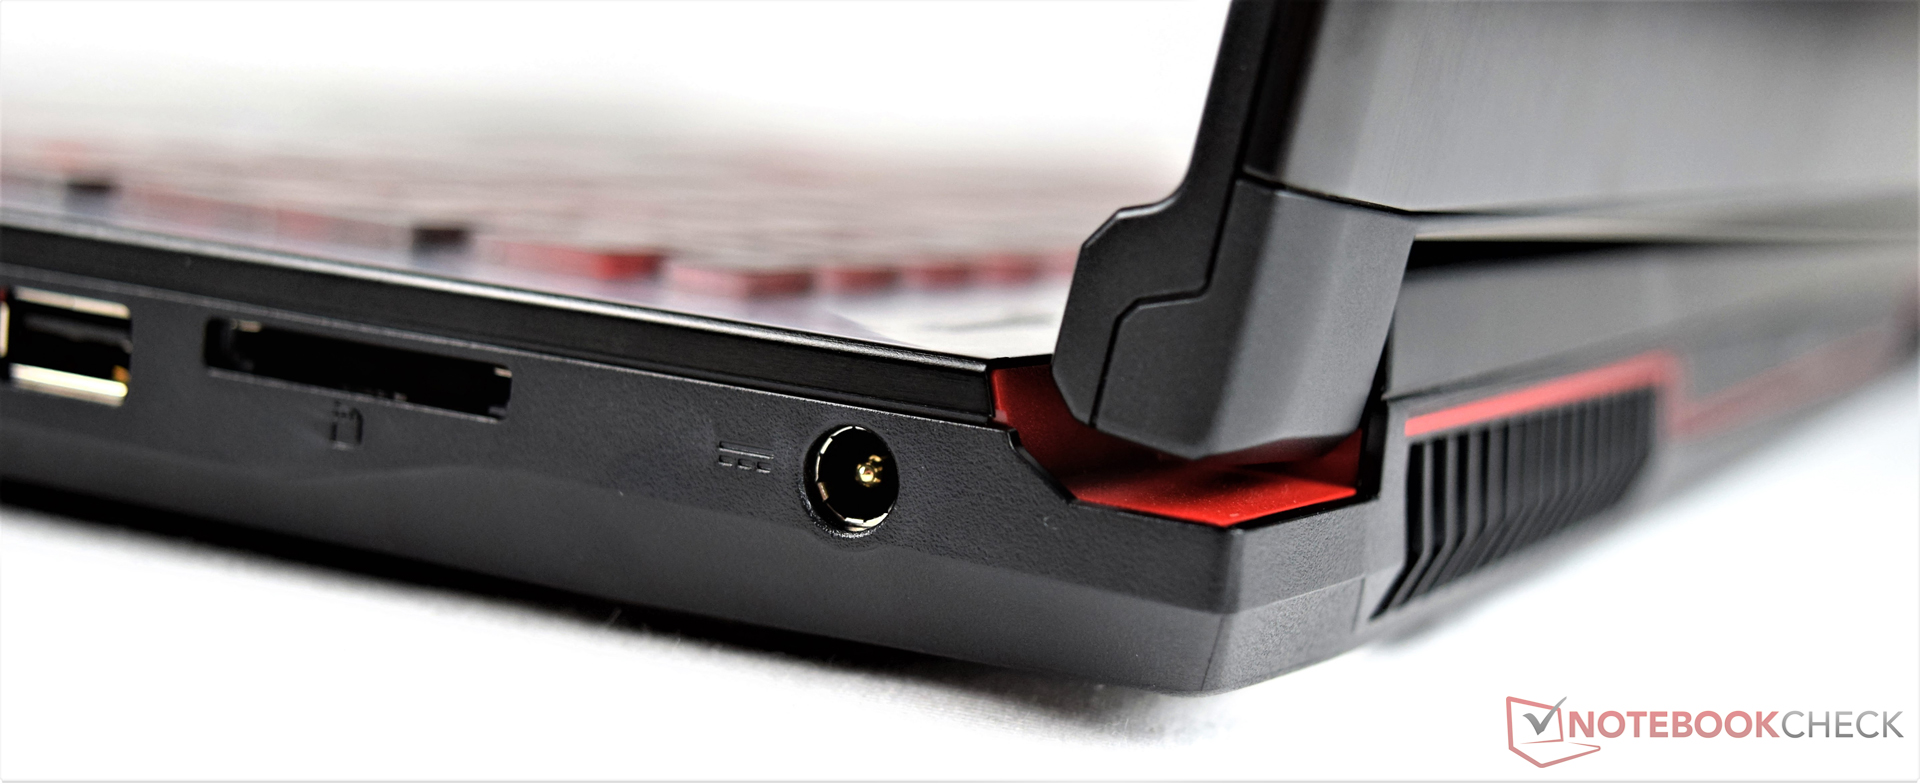

| SD Card Reader | |
| average JPG Copy Test (av. of 3 runs) | |
| Acer Predator 17 G9-793-77LG | |
| Aorus X7 v6 | |
| HP Omen 17-w110ng | |
| Asus GL702VM-GC102D | |
| Medion Erazer X7849 MD 60292 | |
| MSI GS73VR 6RF | |
| MSI GE72VR-6RF16H21 | |
| maximum AS SSD Seq Read Test (1GB) | |
| Acer Predator 17 G9-793-77LG | |
| HP Omen 17-w110ng | |
| Aorus X7 v6 | |
| Medion Erazer X7849 MD 60292 | |
| Asus GL702VM-GC102D | |
| MSI GS73VR 6RF | |
| MSI GE72VR-6RF16H21 | |
| Networking | |
| iperf3 transmit AX12 | |
| Aorus X7 v6 | |
| HP Omen 17-w110ng | |
| MSI GE72VR-6RF16H21 | |
| iperf3 receive AX12 | |
| HP Omen 17-w110ng | |
| Aorus X7 v6 | |
| MSI GE72VR-6RF16H21 | |
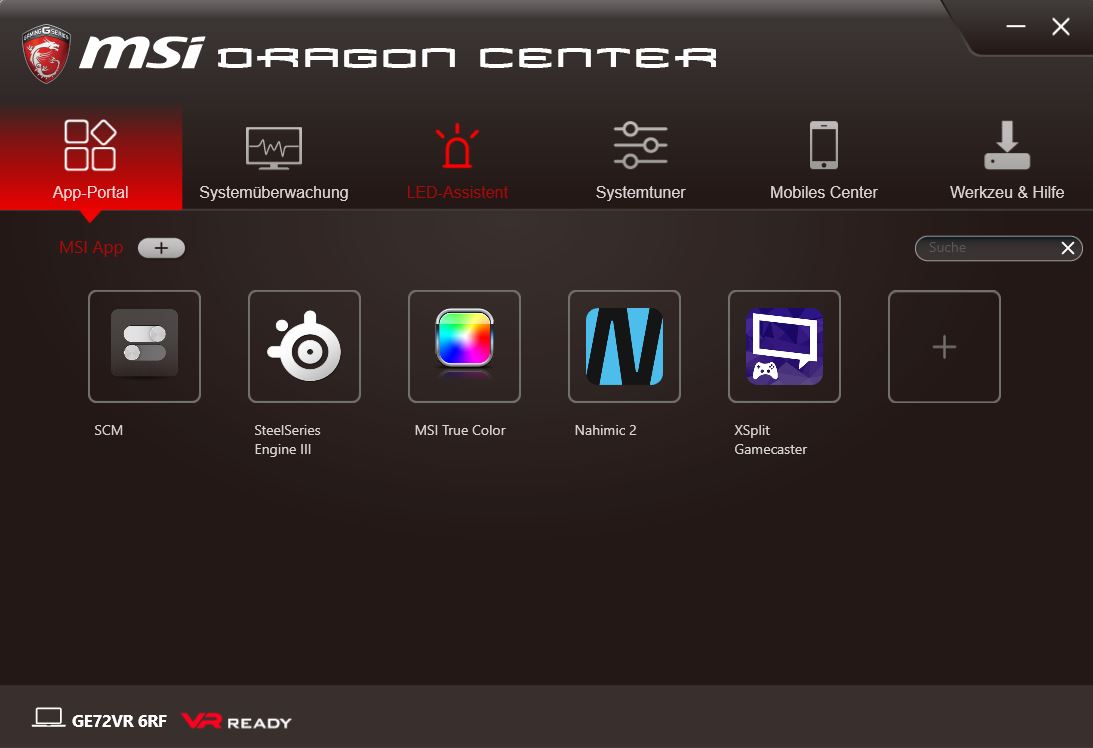
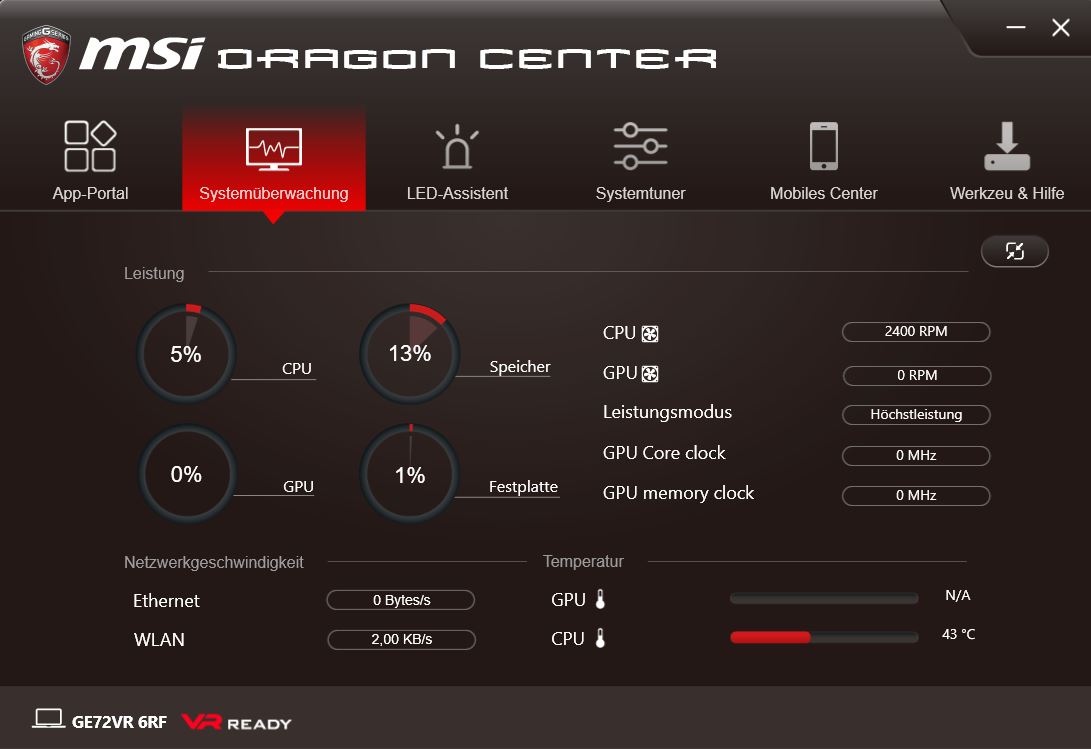
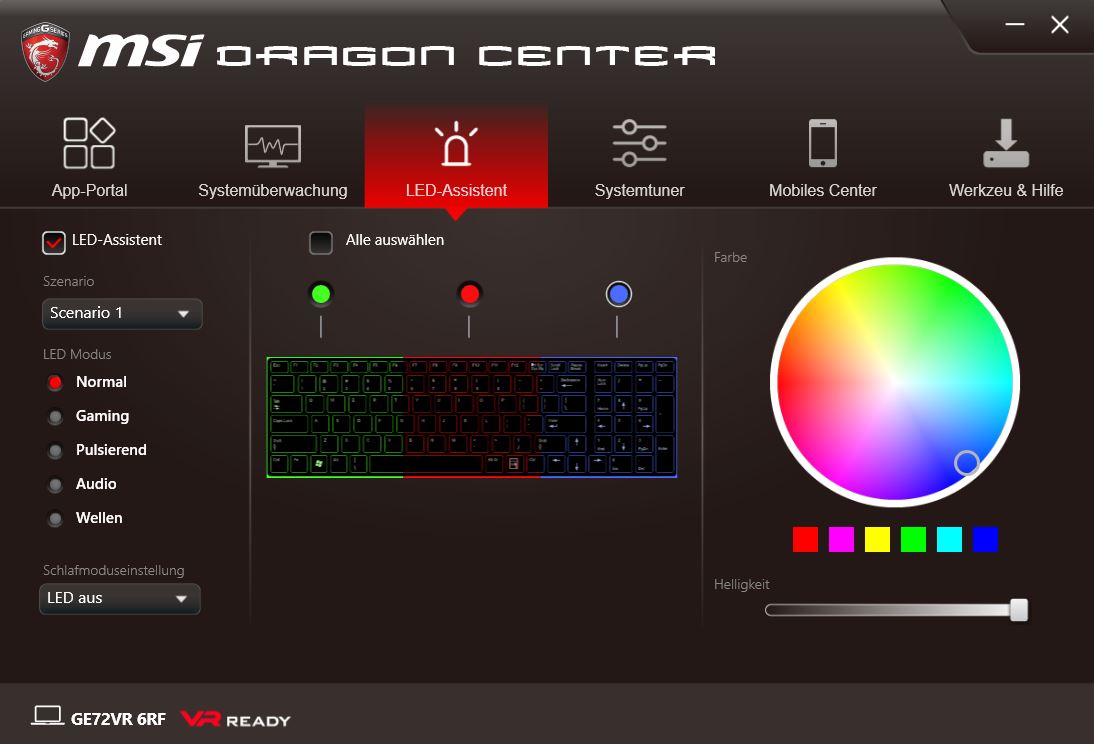
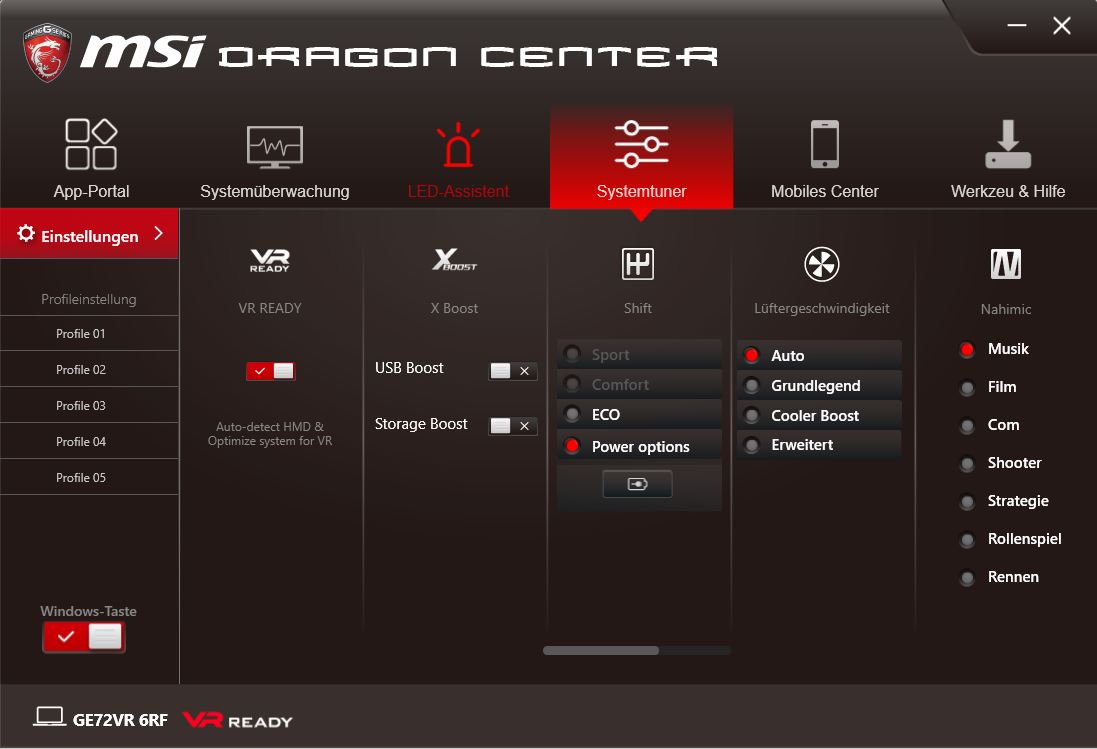
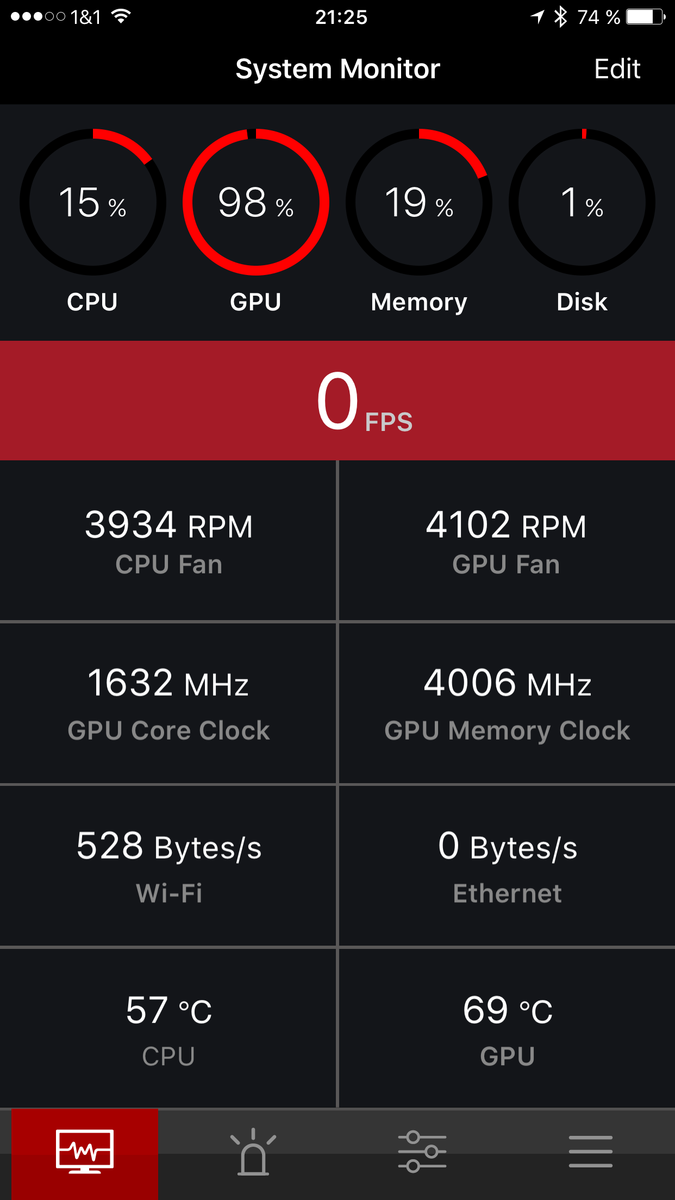
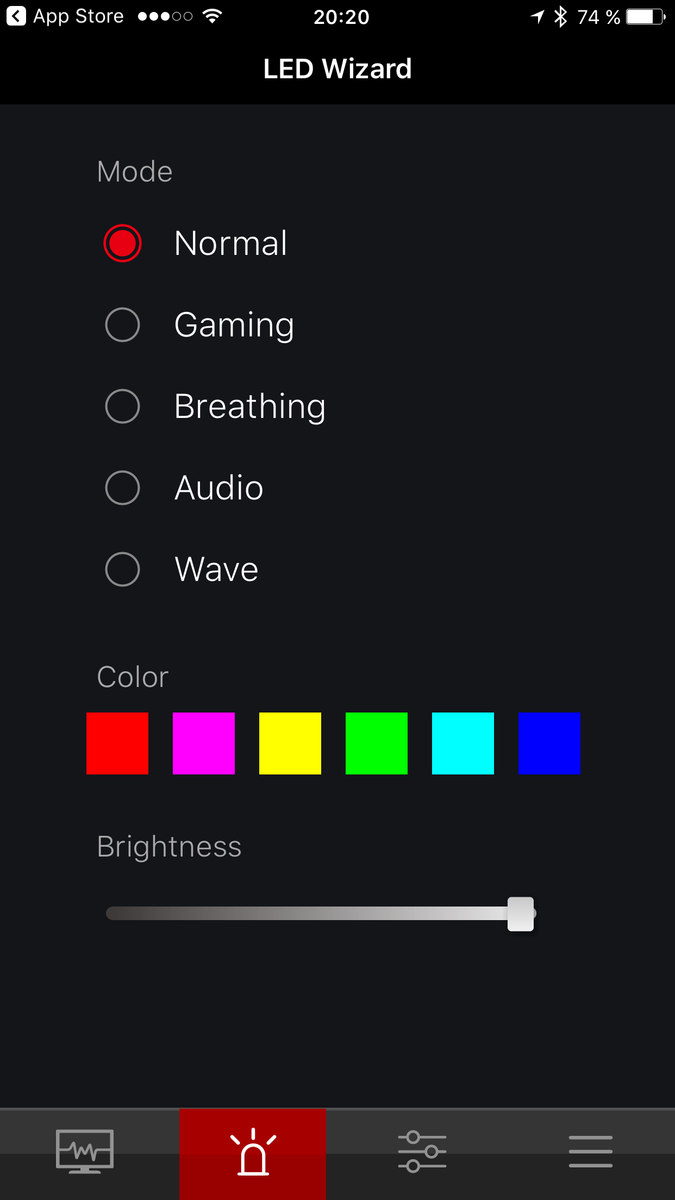
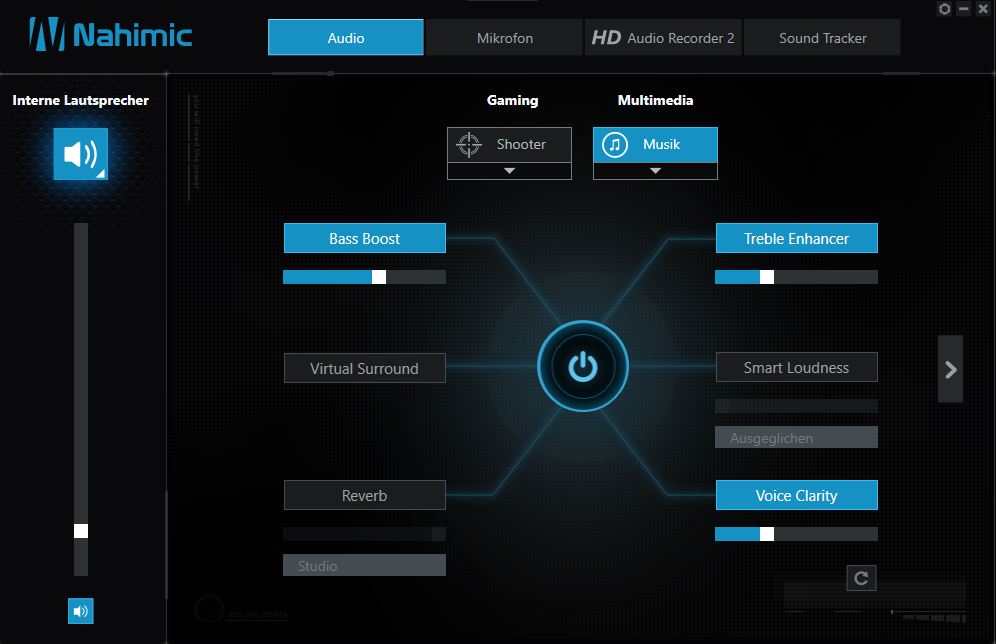
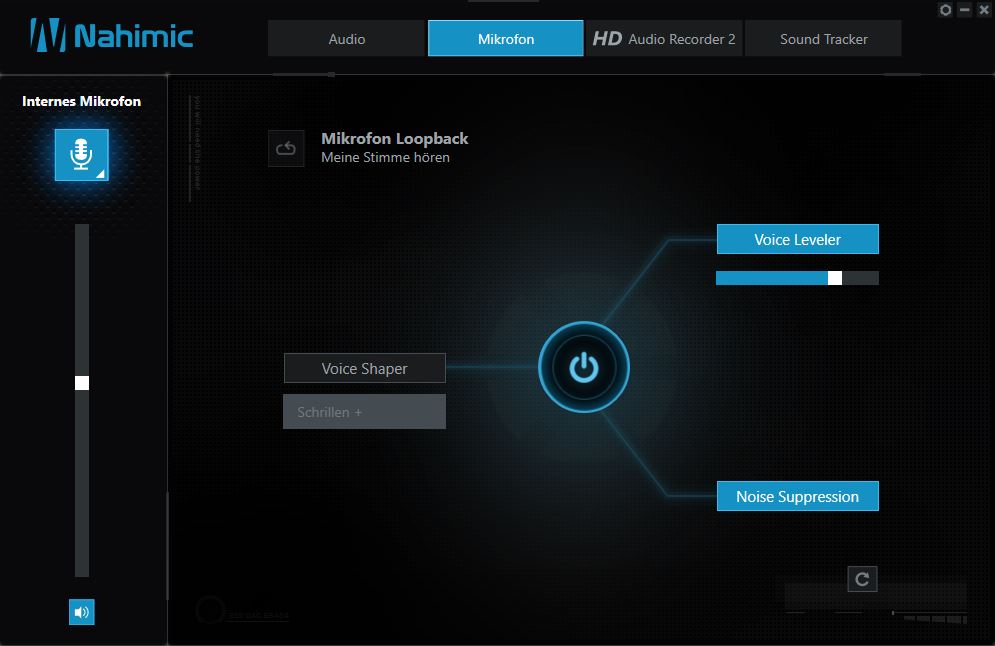
MSI Dragon Center
MSI Dragon Dashboard

| |||||||||||||||||||||||||
Distribuzione della luminosità: 86 %
Al centro con la batteria: 270 cd/m²
Contrasto: 1038:1 (Nero: 0.26 cd/m²)
ΔE Color 3.33 | 0.5-29.43 Ø5
ΔE Greyscale 3.46 | 0.57-98 Ø5.3
100% sRGB (Argyll 1.6.3 3D)
75% AdobeRGB 1998 (Argyll 1.6.3 3D)
83.9% AdobeRGB 1998 (Argyll 2.2.0 3D)
99.8% sRGB (Argyll 2.2.0 3D)
90.2% Display P3 (Argyll 2.2.0 3D)
Gamma: 2.13
| MSI GE72VR-6RF16H21 N173HHE-G32 (CMN1747), 1920x1080 | Asus GL702VM-GC102D LG Philips LP173WF4-SPF3, 1920x1080 | MSI GS73VR 6RF 1920x1080 | Medion Erazer X7849 MD 60292 LP173WF4-SPD1, 1920x1080 | HP Omen 17-w110ng LG Philips LGD046E, 1920x1080 | Acer Predator 17 G9-793-77LG AU Optronics B173ZAN01.0 (AUO109B), 3840x2160 | Aorus X7 v6 B173QTN01.0 (AUO1096), 2560x1440 | |
|---|---|---|---|---|---|---|---|
| Display | -24% | 0% | -23% | 5% | -25% | ||
| Display P3 Coverage | 90.2 | 65.1 -28% | 90 0% | 66.6 -26% | 86.9 -4% | 60.9 -32% | |
| sRGB Coverage | 99.8 | 83.5 -16% | 99.9 0% | 84.1 -16% | 100 0% | 84.2 -16% | |
| AdobeRGB 1998 Coverage | 83.9 | 61.1 -27% | 83.6 0% | 61.5 -27% | 99.4 18% | 61.2 -27% | |
| Response Times | -112% | -10% | -96% | -116% | -116% | -18% | |
| Response Time Grey 50% / Grey 80% * | 28 ? | 38 ? -36% | 28 ? -0% | 29 ? -4% | 37 ? -32% | 37 ? -32% | 31 ? -11% |
| Response Time Black / White * | 8 ? | 23 ? -188% | 9.6 ? -20% | 23 ? -188% | 24 ? -200% | 24 ? -200% | 10 ? -25% |
| PWM Frequency | |||||||
| Screen | -42% | 8% | -24% | -7% | 6% | -44% | |
| Brightness middle | 270 | 326 21% | 337.2 25% | 390 44% | 362 34% | 336 24% | 343 27% |
| Brightness | 254 | 312 23% | 315 24% | 355 40% | 342 35% | 320 26% | 312 23% |
| Brightness Distribution | 86 | 91 6% | 86 0% | 79 -8% | 87 1% | 88 2% | 80 -7% |
| Black Level * | 0.26 | 0.5 -92% | 0.308 -18% | 0.39 -50% | 0.31 -19% | 0.25 4% | 0.5 -92% |
| Contrast | 1038 | 652 -37% | 1095 5% | 1000 -4% | 1168 13% | 1344 29% | 686 -34% |
| Colorchecker dE 2000 * | 3.33 | 6.3 -89% | 2.96 11% | 5.9 -77% | 4.5 -35% | 3.61 -8% | 7.33 -120% |
| Colorchecker dE 2000 max. * | 6.07 | 11.69 -93% | 5.45 10% | 9.89 -63% | 9.31 -53% | 6.02 1% | 10.79 -78% |
| Greyscale dE 2000 * | 3.46 | 7.37 -113% | 2.57 26% | 6.17 -78% | 3.48 -1% | 4.78 -38% | 7.6 -120% |
| Gamma | 2.13 103% | 2.37 93% | 2.25 98% | 2.24 98% | 2.23 99% | 2.32 95% | 2.19 100% |
| CCT | 7419 88% | 7116 91% | 7114 91% | 6955 93% | 6144 106% | 6185 105% | 9024 72% |
| Color Space (Percent of AdobeRGB 1998) | 75 | 55 -27% | 74.3 -1% | 55 -27% | 55 -27% | 88 17% | 55 -27% |
| Color Space (Percent of sRGB) | 100 | 83 -17% | 100 0% | 84 -16% | 84 -16% | 100 0% | 84 -16% |
| Media totale (Programma / Settaggio) | -59% /
-48% | -1% /
4% | -60% /
-36% | -49% /
-25% | -35% /
-11% | -29% /
-37% |
* ... Meglio usare valori piccoli
Tempi di risposta del Display
| ↔ Tempi di risposta dal Nero al Bianco | ||
|---|---|---|
| 8 ms ... aumenta ↗ e diminuisce ↘ combinato | ↗ 5 ms Incremento | 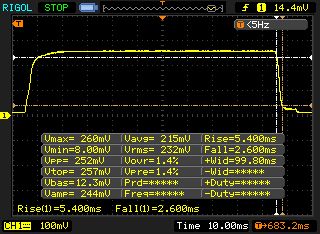 |
| ↘ 3 ms Calo | ||
| Lo schermo mostra veloci tempi di risposta durante i nostri tests e dovrebbe esere adatto al gaming In confronto, tutti i dispositivi di test variano da 0.1 (minimo) a 240 (massimo) ms. » 17 % di tutti i dispositivi è migliore. Questo significa che i tempi di risposta rilevati sono migliori rispettto alla media di tutti i dispositivi testati (21.5 ms). | ||
| ↔ Tempo di risposta dal 50% Grigio all'80% Grigio | ||
| 28 ms ... aumenta ↗ e diminuisce ↘ combinato | ↗ 12 ms Incremento | 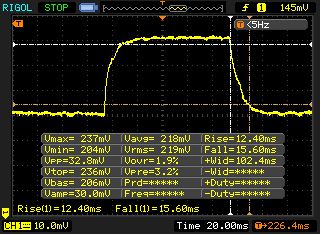 |
| ↘ 16 ms Calo | ||
| Lo schermo mostra tempi di risposta relativamente lenti nei nostri tests e potrebbe essere troppo lento per i gamers. In confronto, tutti i dispositivi di test variano da 0.2 (minimo) a 636 (massimo) ms. » 32 % di tutti i dispositivi è migliore. Questo significa che i tempi di risposta rilevati sono migliori rispettto alla media di tutti i dispositivi testati (33.7 ms). | ||
Sfarfallio dello schermo / PWM (Pulse-Width Modulation)
| flickering dello schermo / PWM non rilevato |  | ||
In confronto: 53 % di tutti i dispositivi testati non utilizza PWM per ridurre la luminosita' del display. Se è rilevato PWM, una media di 17900 (minimo: 5 - massimo: 3846000) Hz è stata rilevata. | |||


| Cinebench R11.5 | |
| CPU Single 64Bit | |
| Aorus X7 v6 | |
| HP Omen 17-w110ng | |
| MSI GE72VR-6RF16H21 | |
| MSI GS73VR 6RF | |
| Asus GL702VM-GC102D | |
| CPU Multi 64Bit | |
| Aorus X7 v6 | |
| HP Omen 17-w110ng | |
| Asus GL702VM-GC102D | |
| MSI GS73VR 6RF | |
| MSI GE72VR-6RF16H21 | |
| Cinebench R10 | |
| Rendering Single CPUs 64Bit | |
| HP Omen 17-w110ng | |
| MSI GE72VR-6RF16H21 | |
| Rendering Multiple CPUs 64Bit | |
| HP Omen 17-w110ng | |
| MSI GE72VR-6RF16H21 | |
| JetStream 1.1 - Total Score | |
| HP Omen 17-w110ng | |
| Medion Erazer X7849 MD 60292 | |
| Asus GL702VM-GC102D | |
| MSI GS73VR 6RF | |
| MSI GE72VR-6RF16H21 | |
| Octane V2 - Total Score | |
| Medion Erazer X7849 MD 60292 | |
| HP Omen 17-w110ng | |
| Asus GL702VM-GC102D | |
| MSI GS73VR 6RF | |
| MSI GE72VR-6RF16H21 | |
| Mozilla Kraken 1.1 - Total | |
| MSI GE72VR-6RF16H21 | |
| Asus GL702VM-GC102D | |
| HP Omen 17-w110ng | |
| Medion Erazer X7849 MD 60292 | |
* ... Meglio usare valori piccoli
| PCMark 7 - Score | |
| Aorus X7 v6 | |
| MSI GE72VR-6RF16H21 | |
| HP Omen 17-w110ng | |
| Asus GL702VM-GC102D | |
| PCMark 8 | |
| Home Score Accelerated v2 | |
| HP Omen 17-w110ng | |
| Asus GL702VM-GC102D | |
| Medion Erazer X7849 MD 60292 | |
| Medion Erazer X7849 MD 60292 | |
| Acer Predator 17 G9-793-77LG | |
| MSI GS73VR 6RF | |
| MSI GE72VR-6RF16H21 | |
| Creative Score Accelerated v2 | |
| HP Omen 17-w110ng | |
| Asus GL702VM-GC102D | |
| MSI GS73VR 6RF | |
| MSI GE72VR-6RF16H21 | |
| Acer Predator 17 G9-793-77LG | |
| Work Score Accelerated v2 | |
| HP Omen 17-w110ng | |
| Medion Erazer X7849 MD 60292 | |
| MSI GE72VR-6RF16H21 | |
| Asus GL702VM-GC102D | |
| MSI GS73VR 6RF | |
| Storage Score v2 | |
| HP Omen 17-w110ng | |
| Medion Erazer X7849 MD 60292 | |
| MSI GE72VR-6RF16H21 | |
| MSI GS73VR 6RF | |
| PCMark Vantage Result | 20205 punti | |
| PCMark 7 Score | 5809 punti | |
| PCMark 8 Home Score Accelerated v2 | 3985 punti | |
| PCMark 8 Creative Score Accelerated v2 | 4933 punti | |
| PCMark 8 Work Score Accelerated v2 | 4831 punti | |
Aiuto | ||
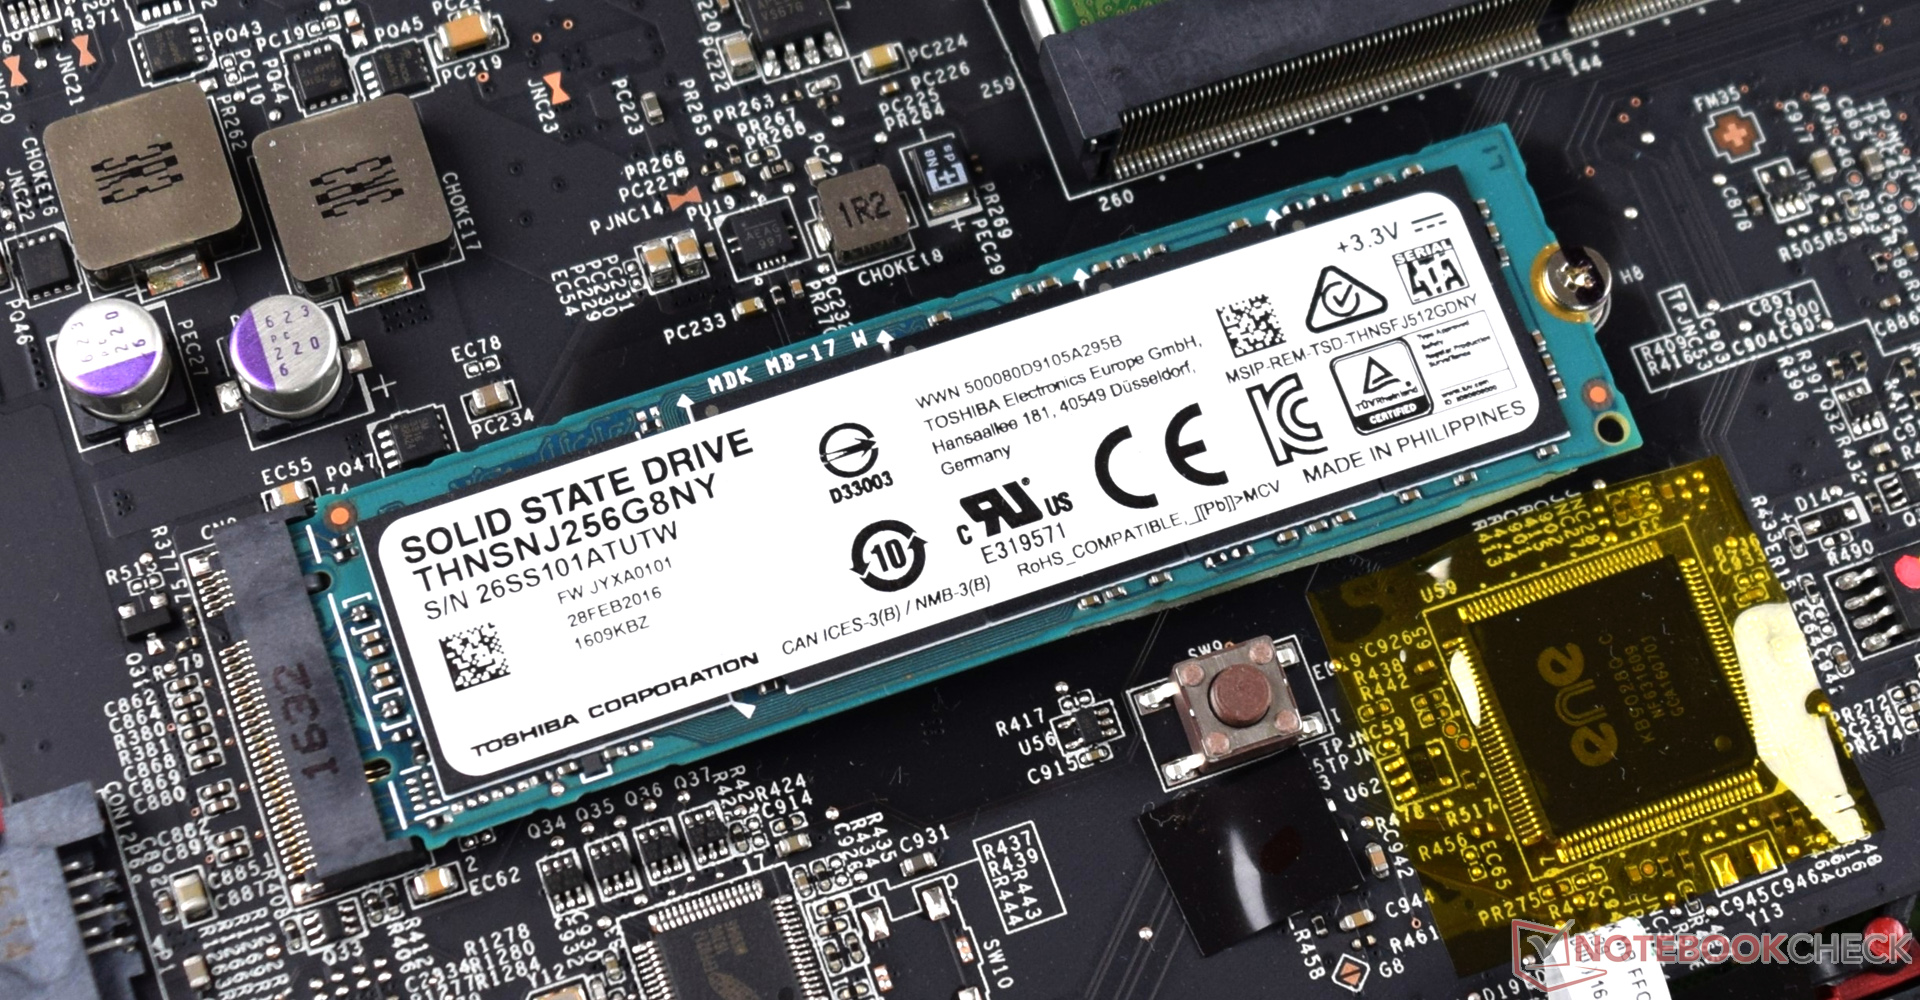
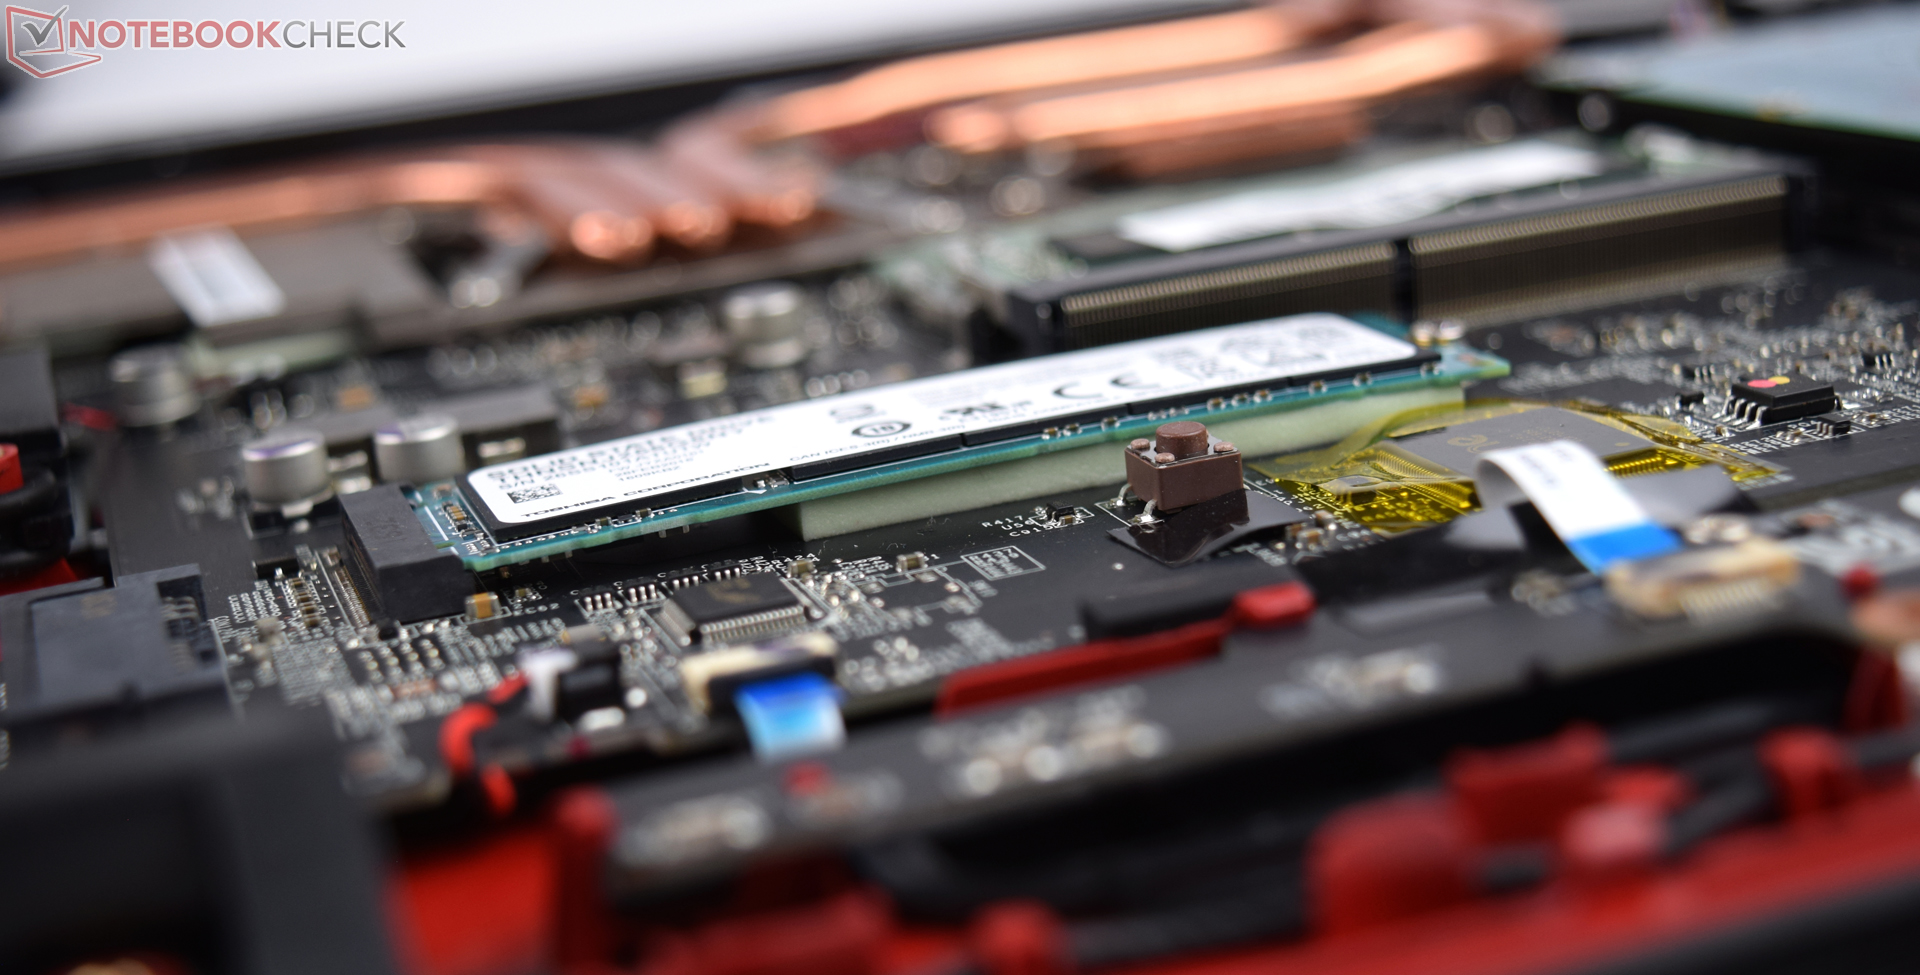
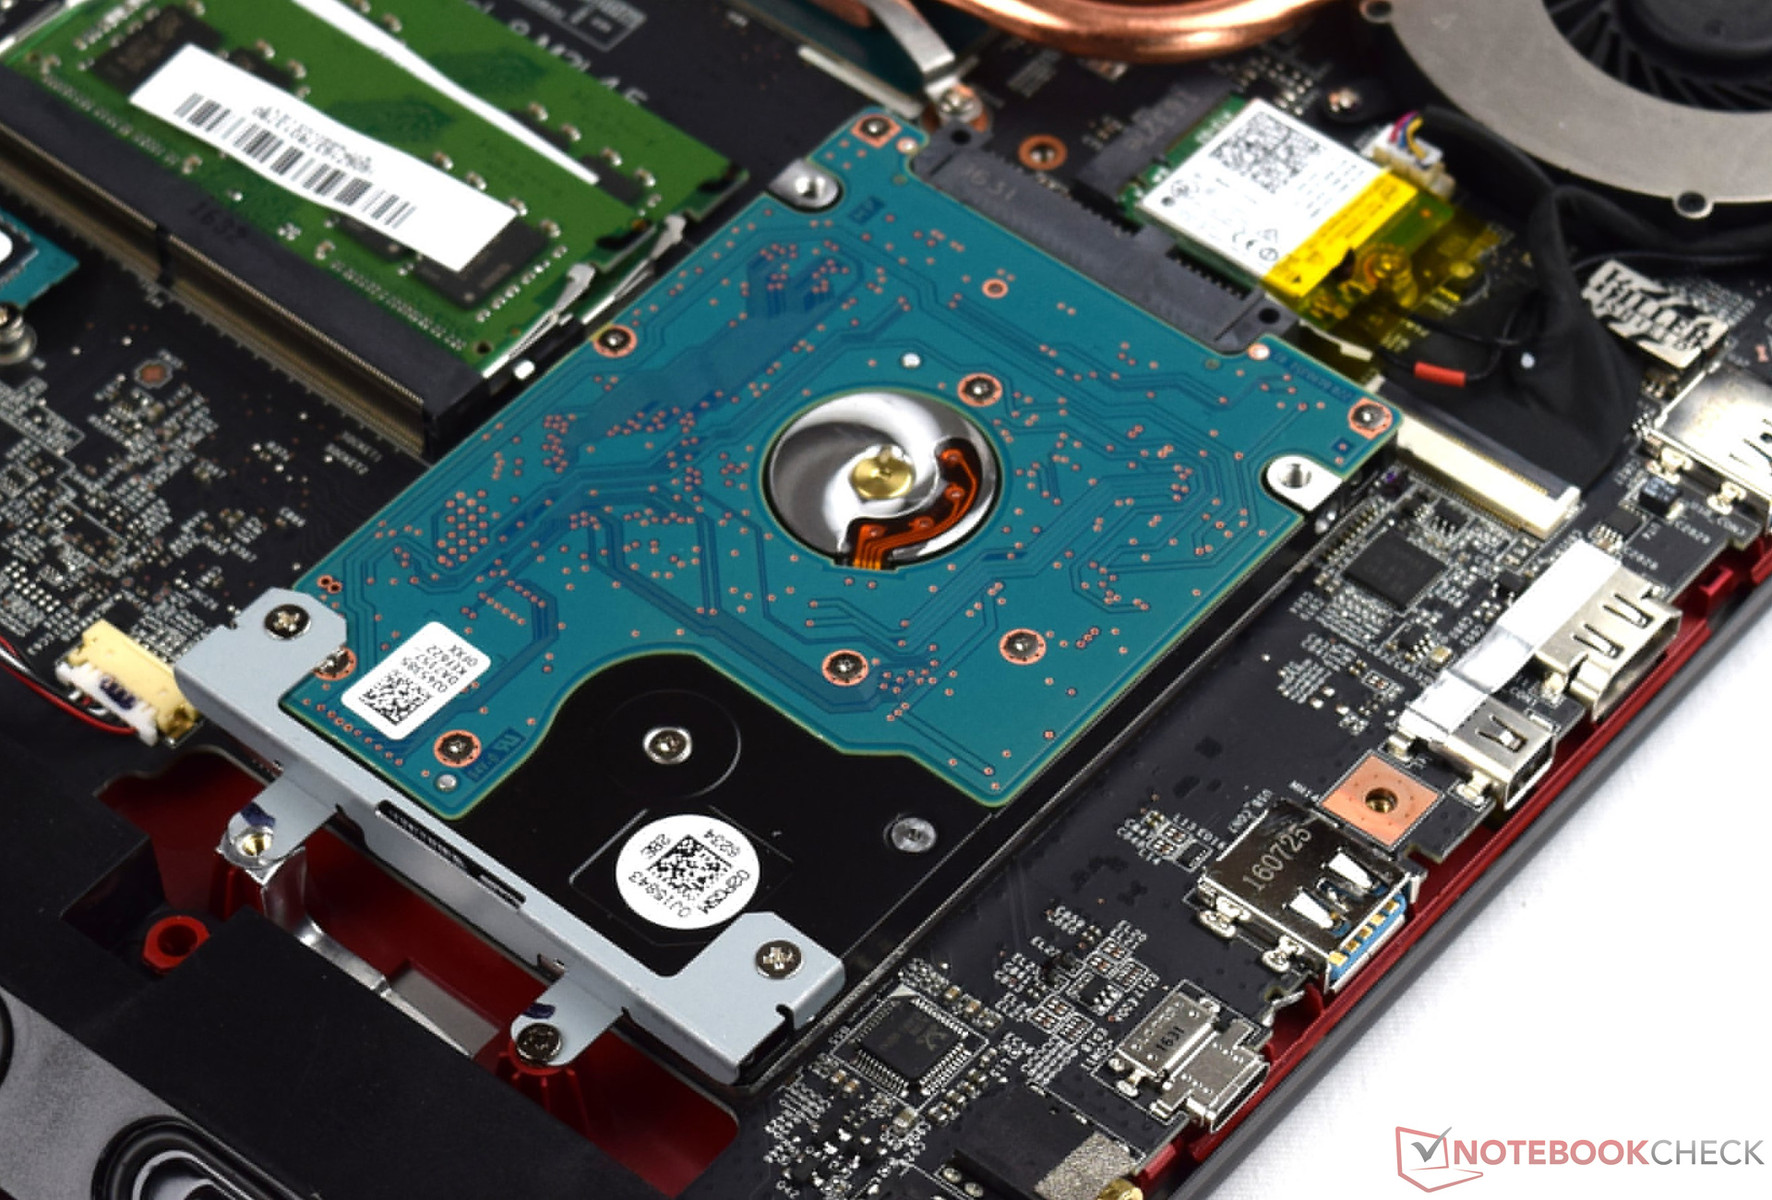

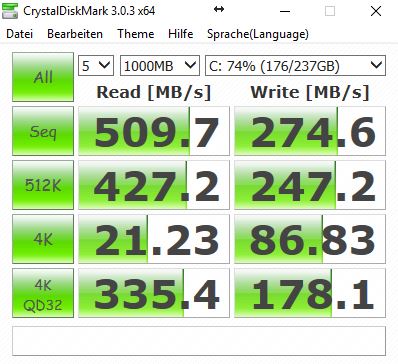
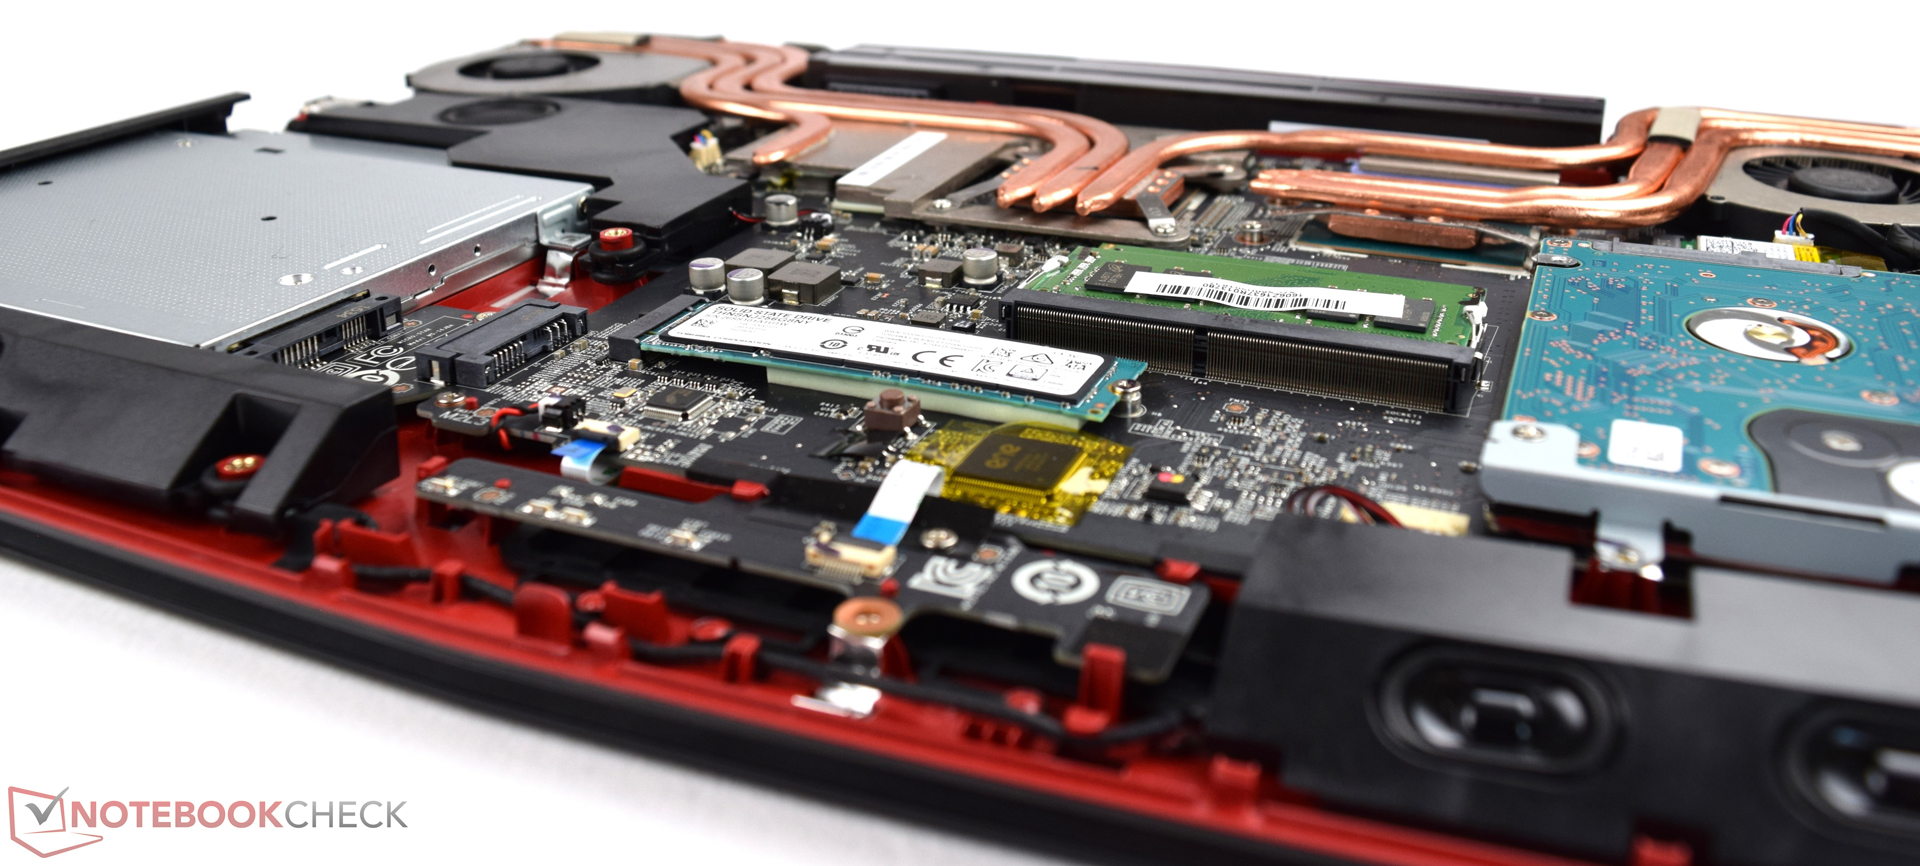
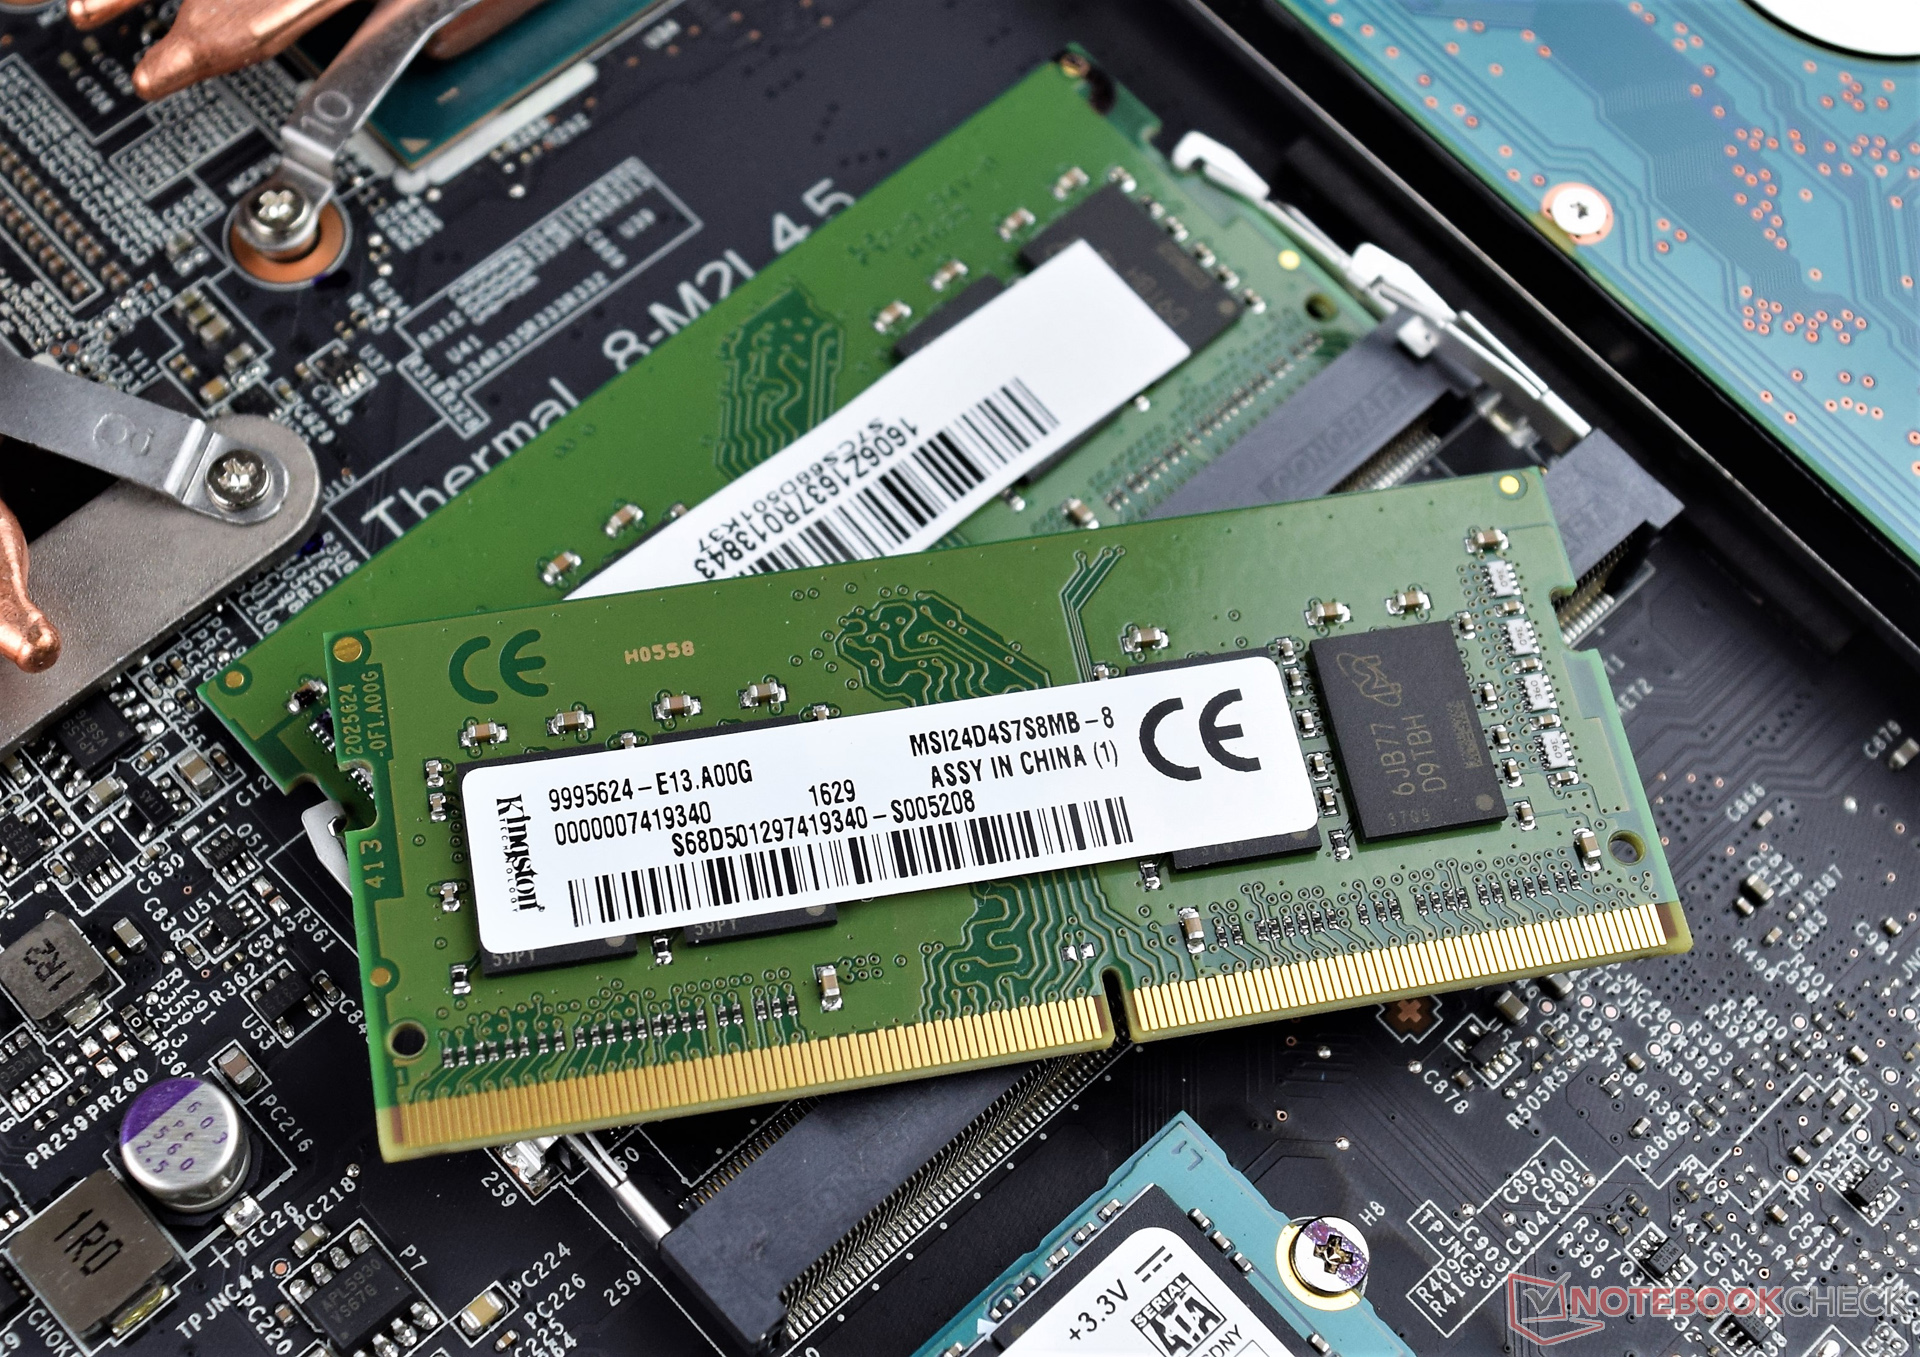
| MSI GE72VR-6RF16H21 Toshiba HG6 THNSNJ256G8NY | Asus GL702VM-GC102D HGST Travelstar 7K1000 HTS721010A9E630 | MSI GS73VR 6RF SanDisk SD8SN8U1T001122 | Medion Erazer X7849 MD 60292 Samsung SSD PM871 MZNLN512HCJH | HP Omen 17-w110ng Samsung PM951 NVMe MZVLV256 | Aorus X7 v6 Toshiba NVMe THNSN5512GPU7 | |
|---|---|---|---|---|---|---|
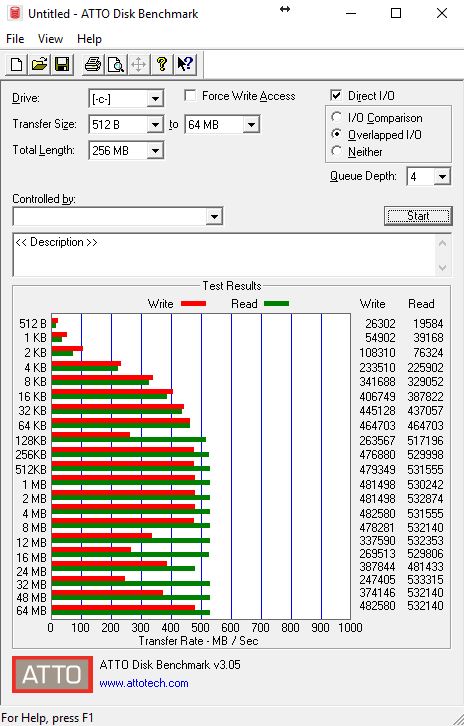
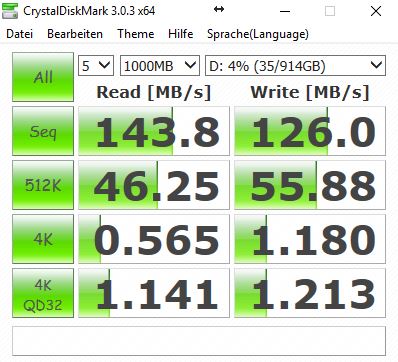
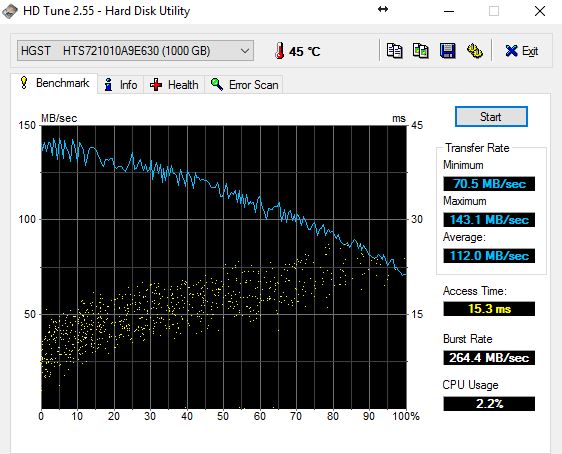
| CrystalDiskMark 3.0 | -86% | -18% | 35% | 65% | 197% | |
| Read Seq | 510 | 134.6 -74% | 334.3 -34% | 513 1% | 1156 127% | 1499 194% |
| Write Seq | 274.6 | 130.6 -52% | 319 16% | 483.7 76% | 294.9 7% | 1411 414% |
| Read 512 | 427.2 | 44.85 -90% | 242.3 -43% | 452.4 6% | 616 44% | 966 126% |
| Write 512 | 247.2 | 63.3 -74% | 254.4 3% | 404.2 64% | 294.7 19% | 1103 346% |
| Read 4k | 21.23 | 0.602 -97% | 20.3 -4% | 37.48 77% | 42.7 101% | 44.33 109% |
| Write 4k | 86.8 | 1.146 -99% | 42.51 -51% | 91.4 5% | 153.3 77% | 155.5 79% |
| Read 4k QD32 | 335.4 | 1.106 -100% | 251.6 -25% | 364.4 9% | 600 79% | 696 108% |
| Write 4k QD32 | 178.1 | 1.186 -99% | 167.1 -6% | 250.9 41% | 295.3 66% | 531 198% |


| 3DMark 11 - 1280x720 Performance GPU | |
| Aorus X7 v6 | |
| Acer Predator 17 G9-793-77LG | |
| Medion Erazer X7849 MD 60292 | |
| HP Omen 17-w110ng | |
| MSI GE72VR-6RF16H21 | |
| MSI GS73VR 6RF | |
| Asus GL702VM-GC102D | |
| 3DMark - 1920x1080 Fire Strike Graphics | |
| Aorus X7 v6 | |
| Medion Erazer X7849 MD 60292 | |
| HP Omen 17-w110ng | |
| Acer Predator 17 G9-793-77LG | |
| MSI GE72VR-6RF16H21 | |
| MSI GS73VR 6RF | |
| Asus GL702VM-GC102D | |
| 3DMark 03 Standard | 87152 punti | |
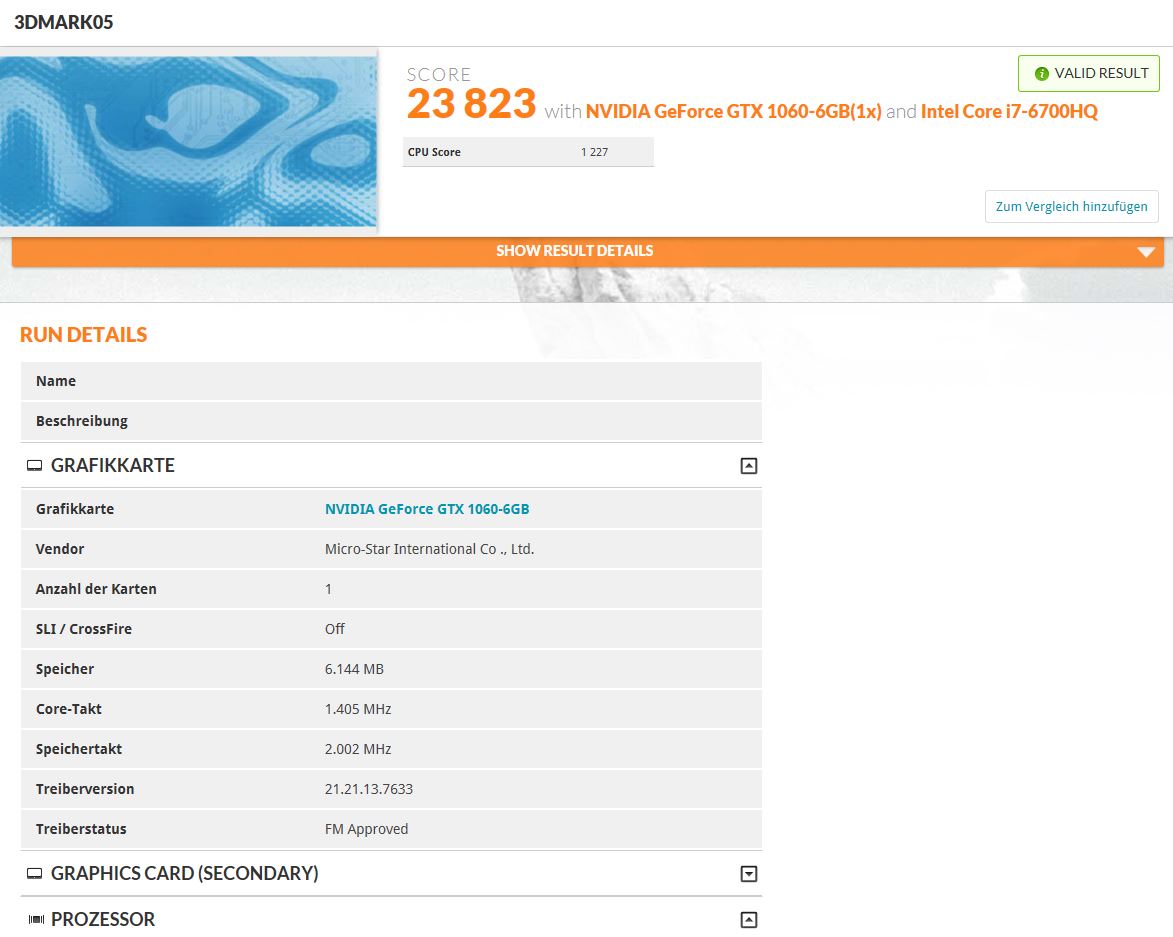
| 3DMark 05 Standard | 23823 punti | |
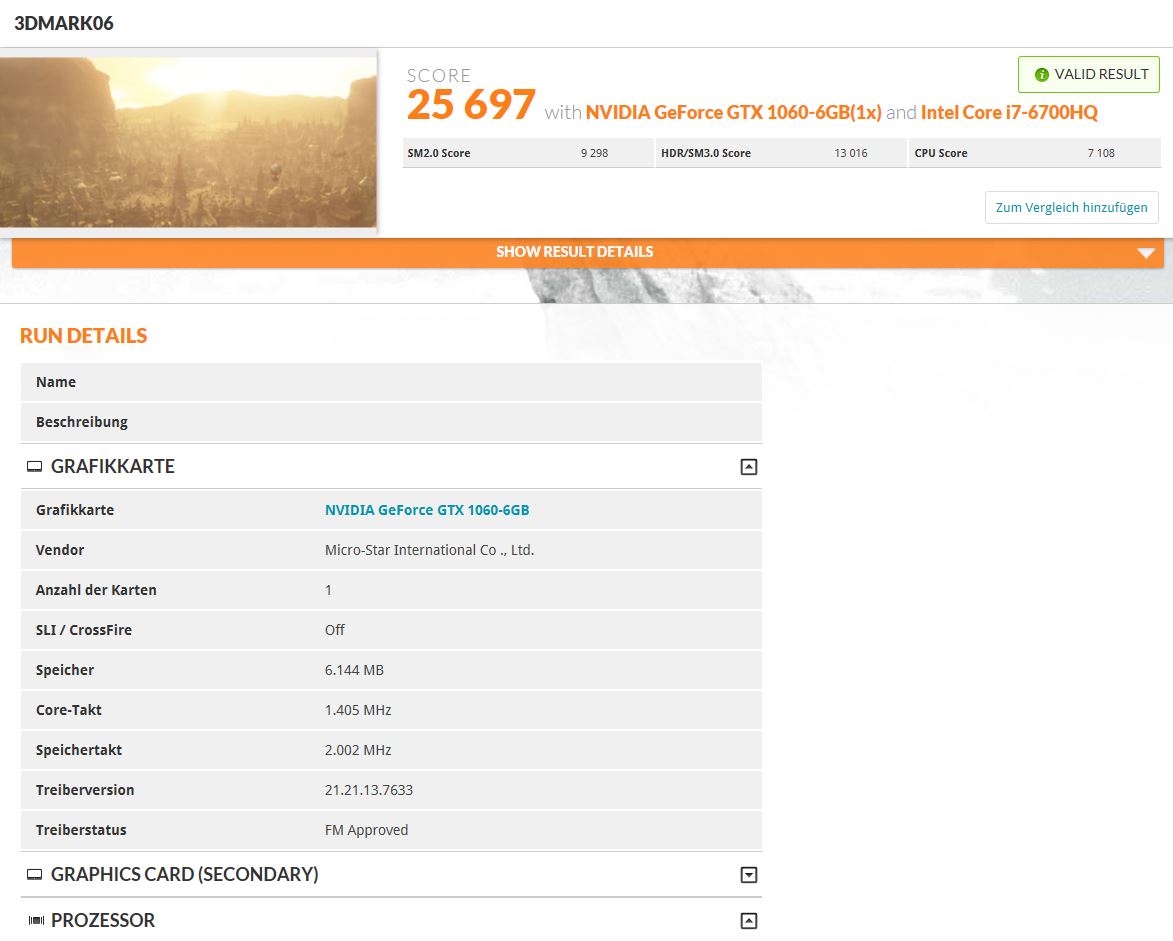
| 3DMark 06 Standard Score | 25697 punti | |
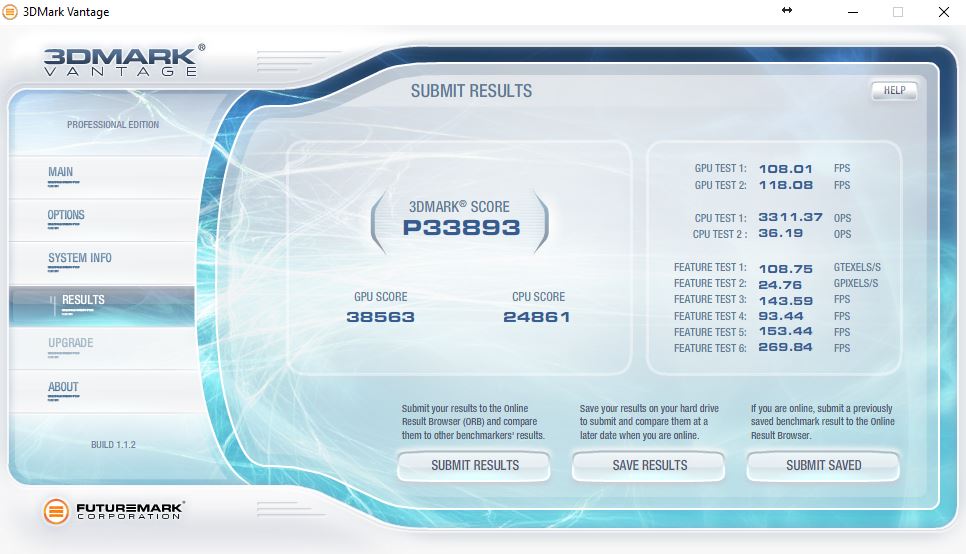
| 3DMark Vantage P Result | 33893 punti | |
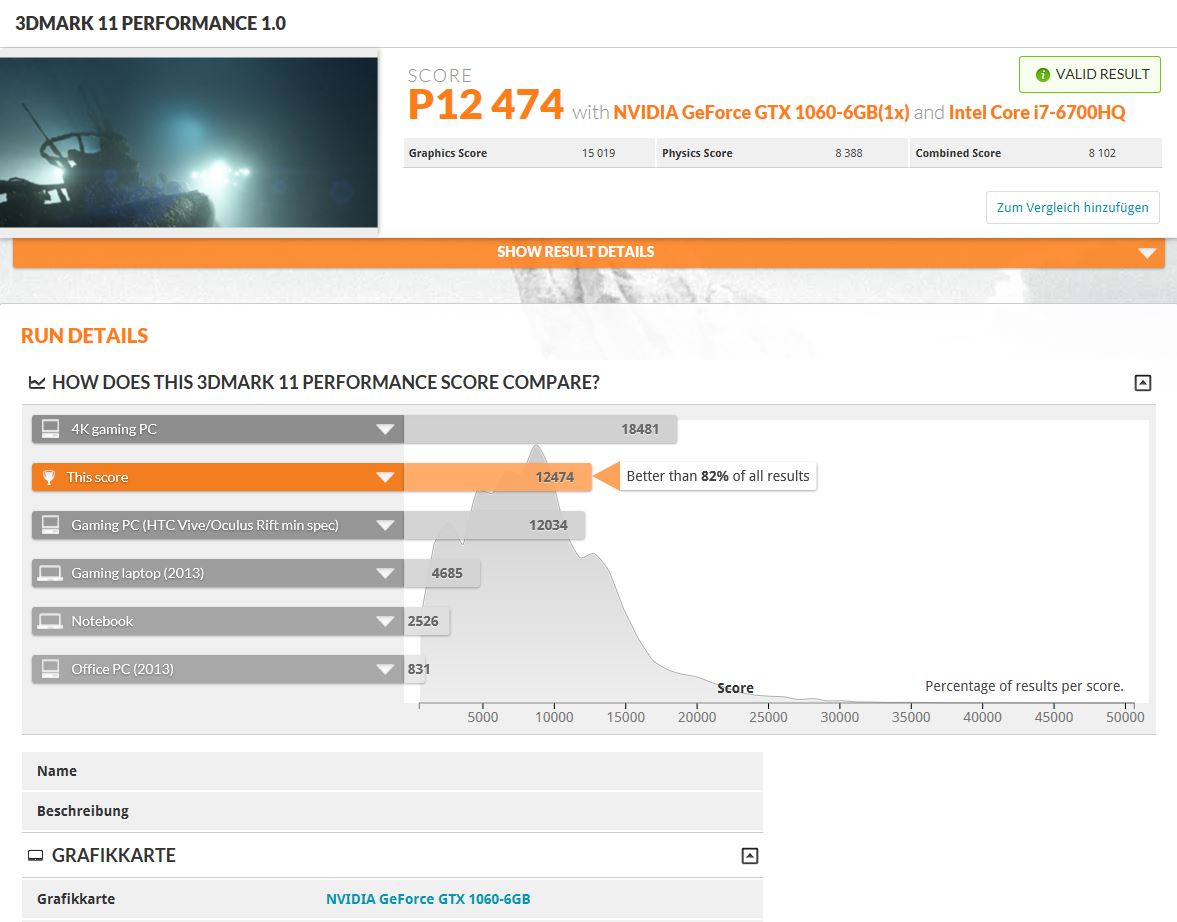
| 3DMark 11 Performance | 12474 punti | |
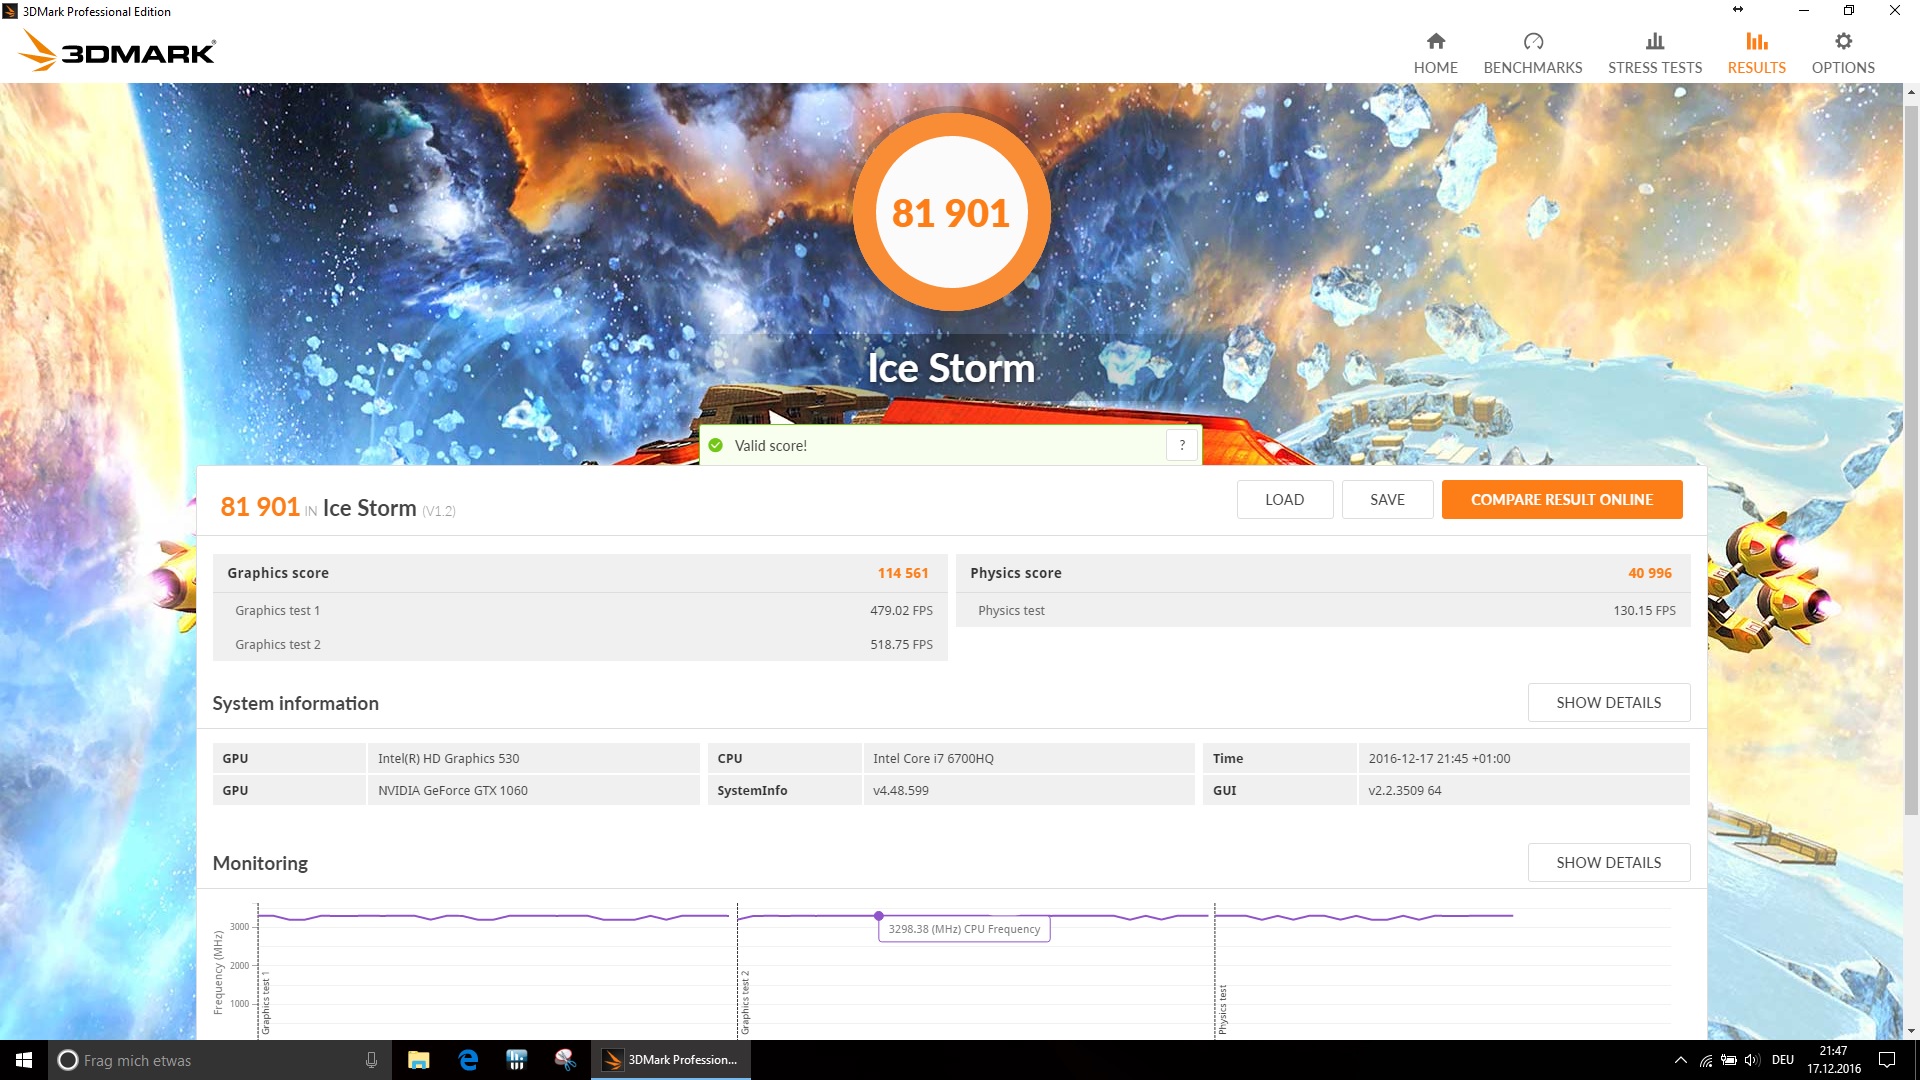
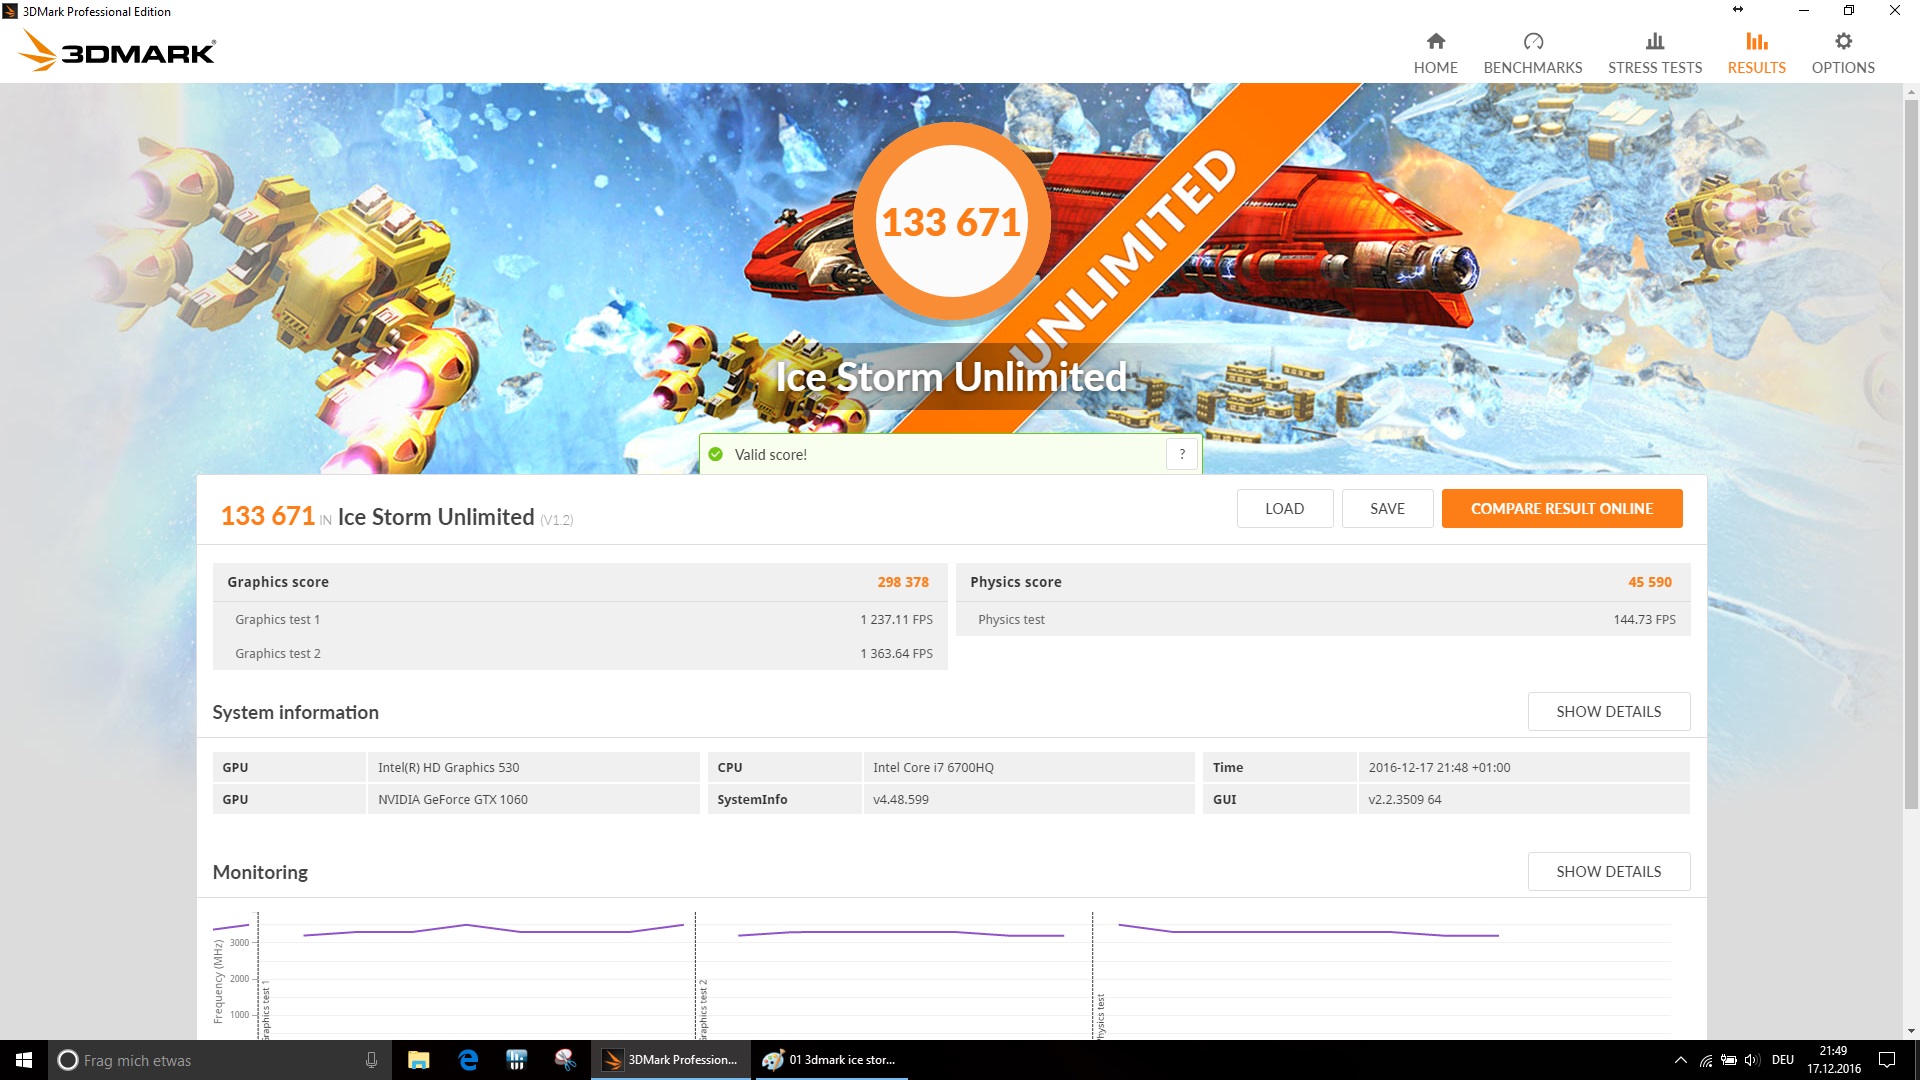
| 3DMark Ice Storm Standard Score | 81901 punti | |
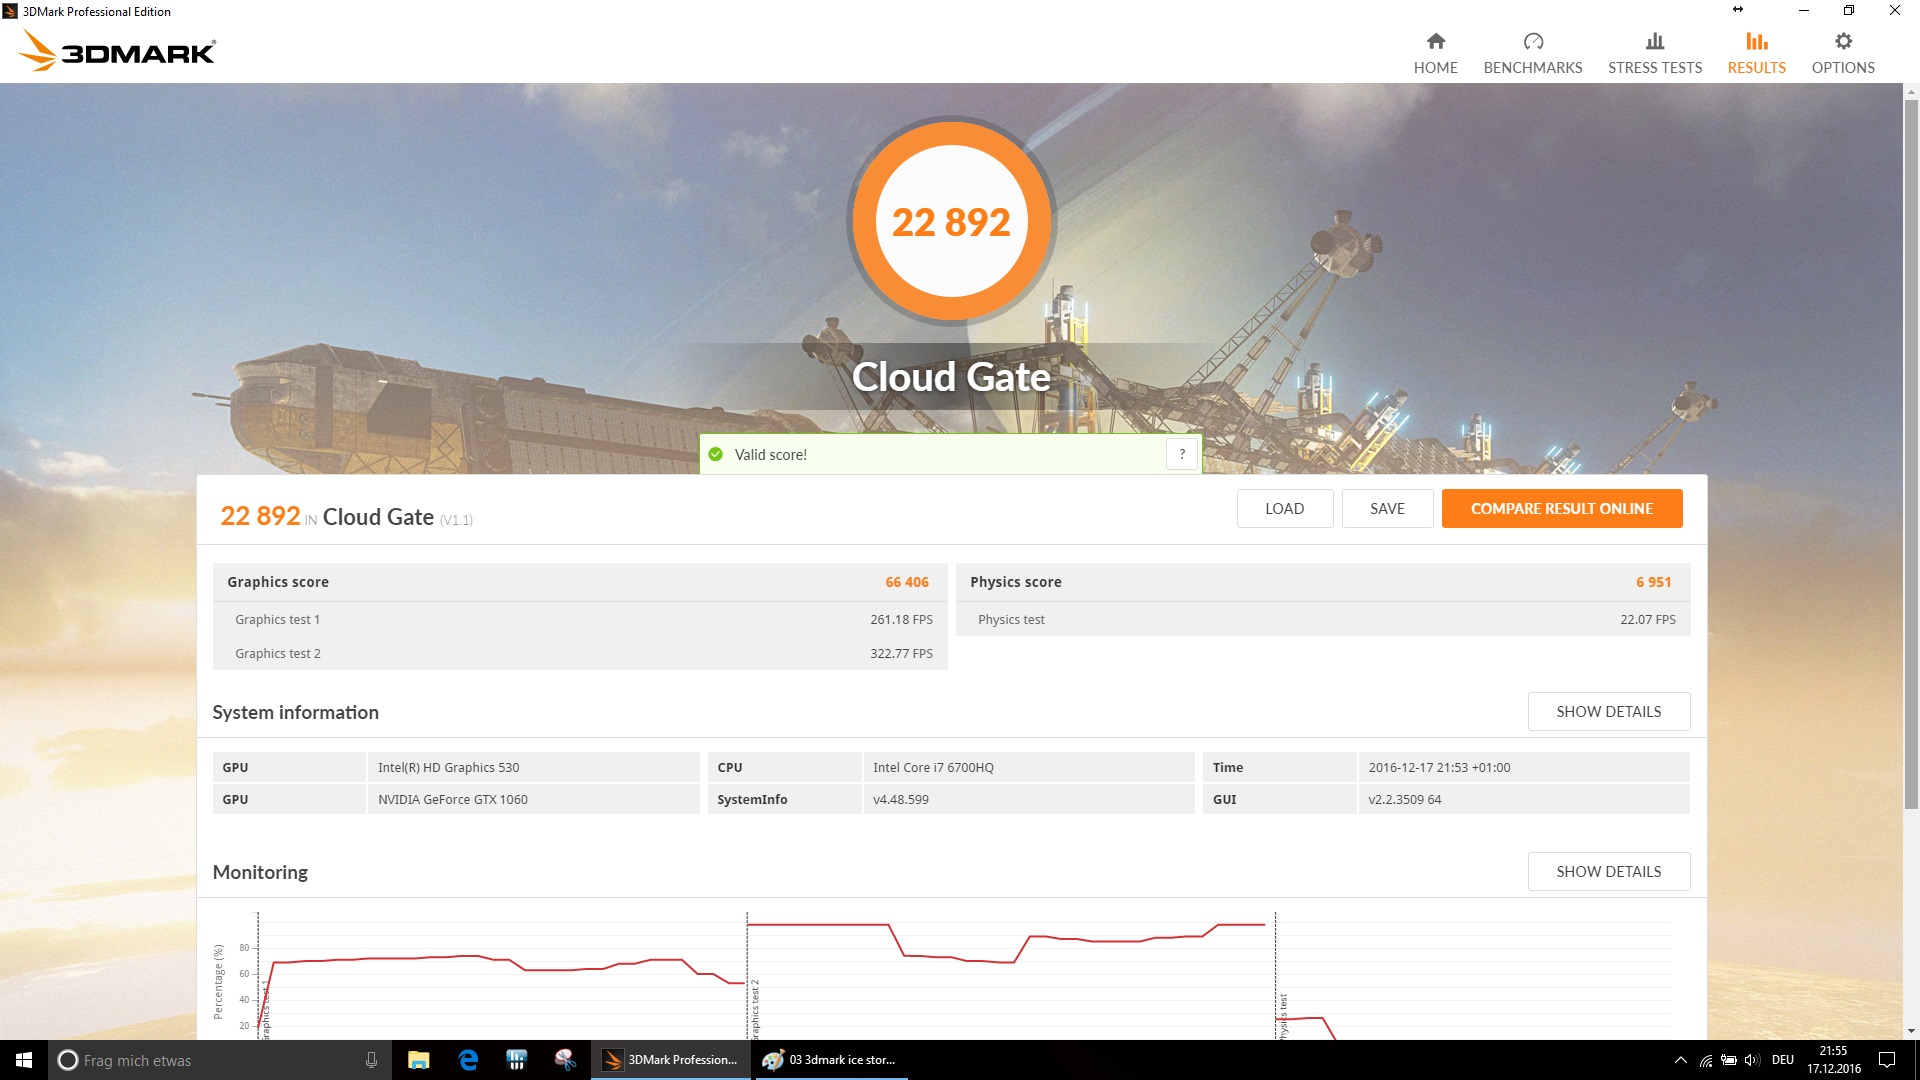
| 3DMark Cloud Gate Standard Score | 22892 punti | |
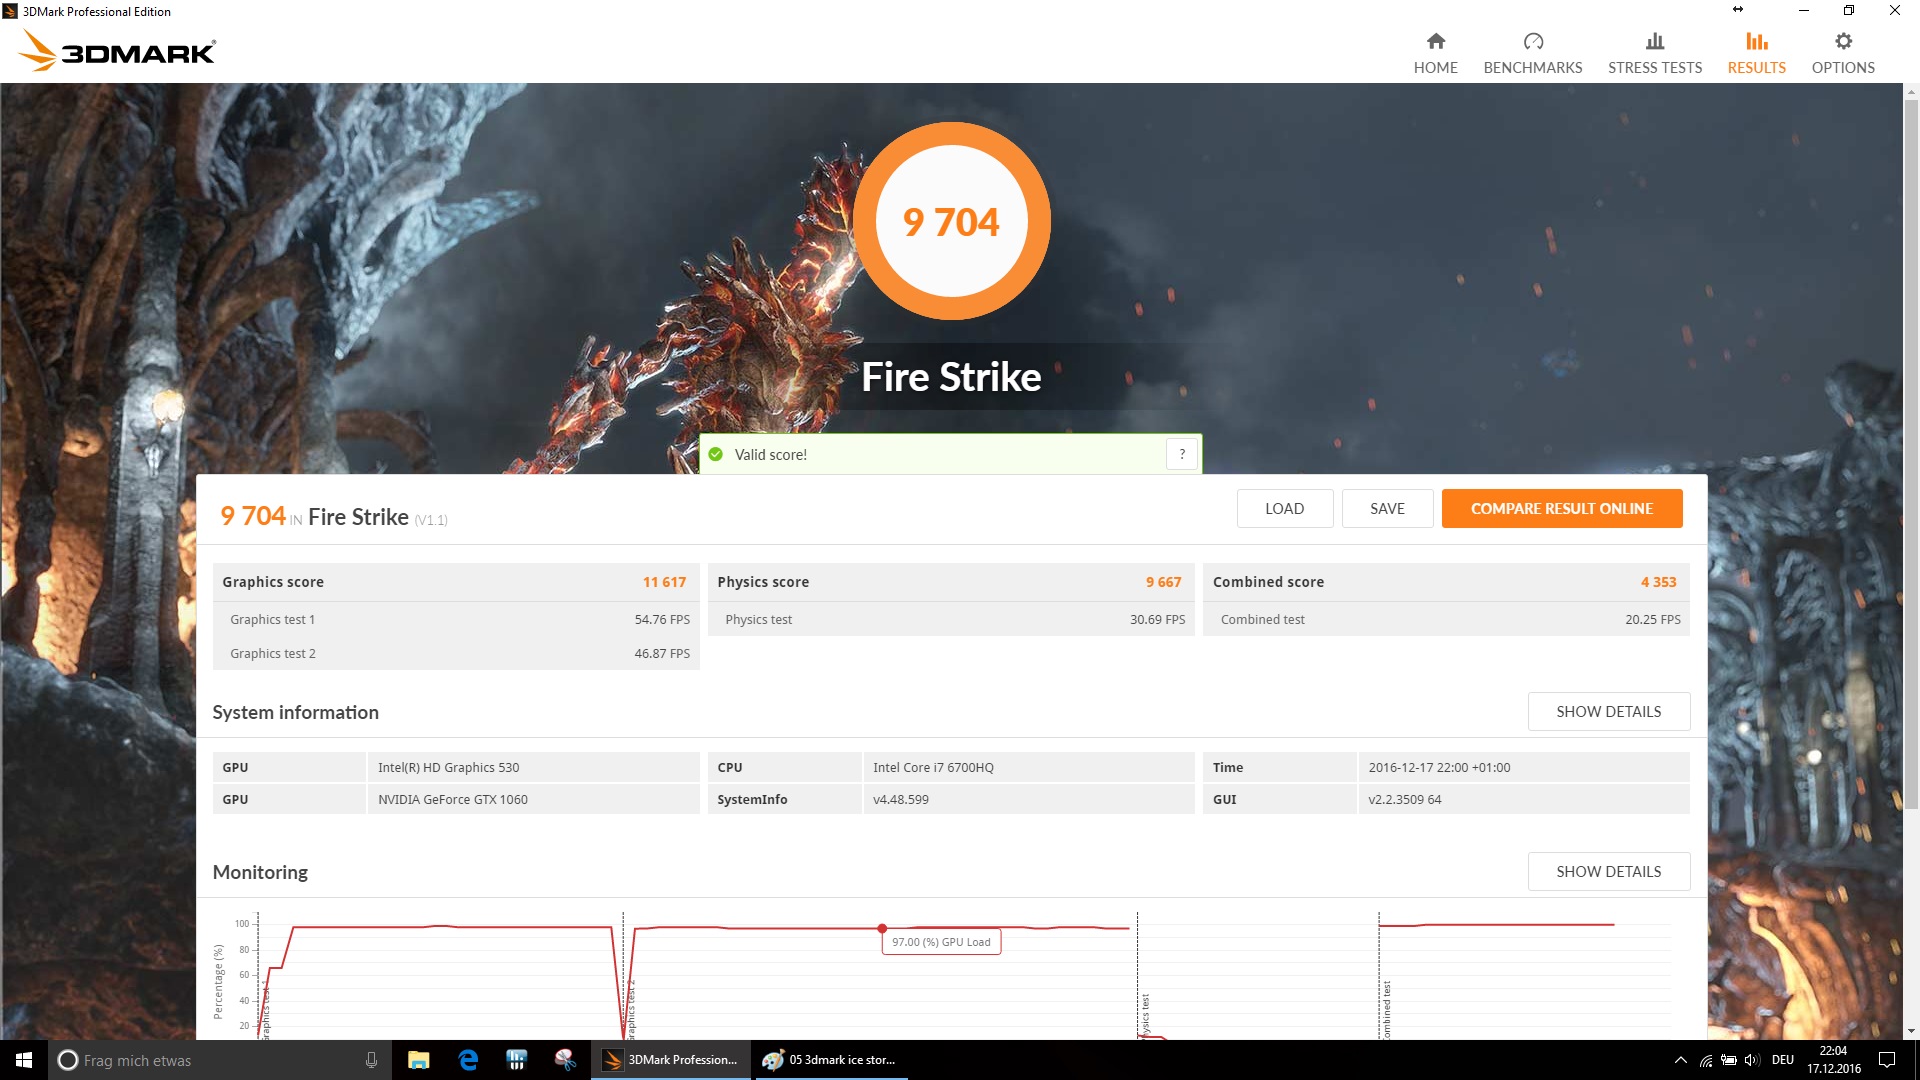
| 3DMark Fire Strike Score | 9704 punti | |
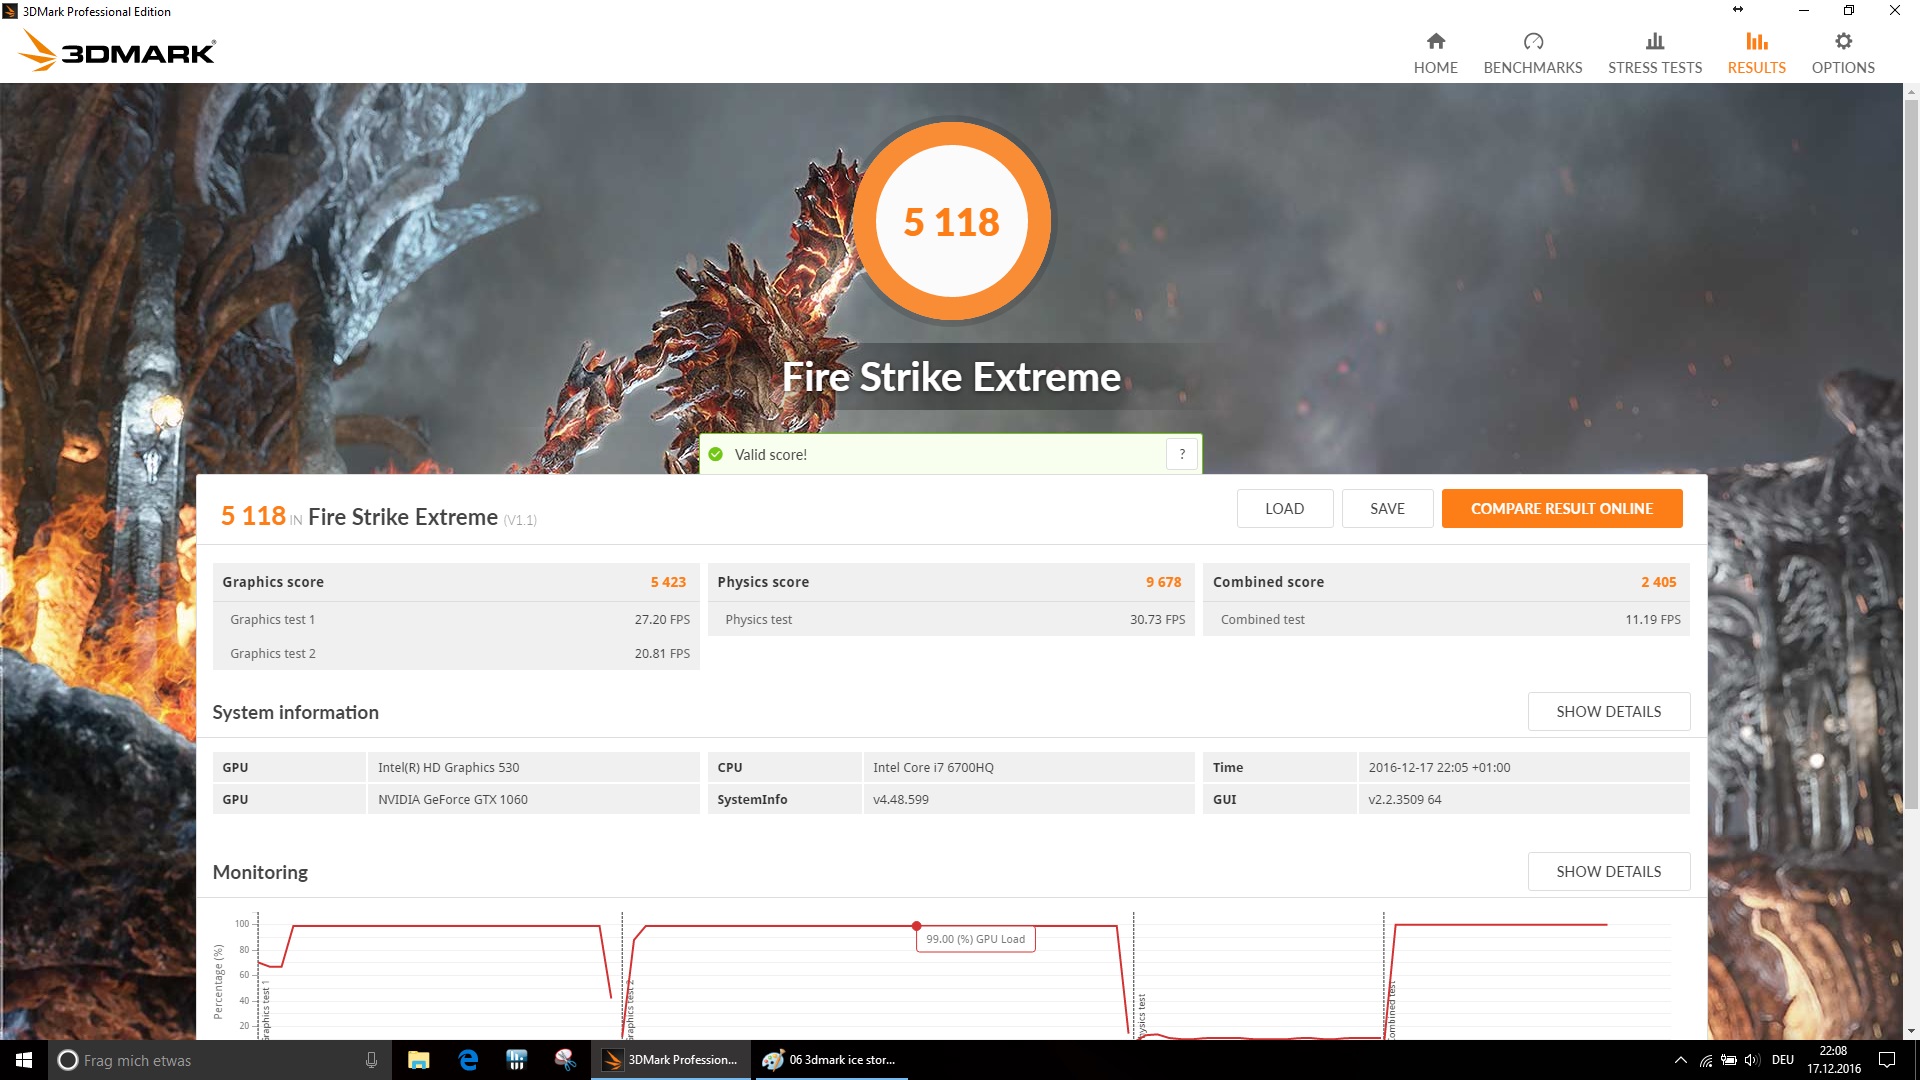
| 3DMark Fire Strike Extreme Score | 5118 punti | |
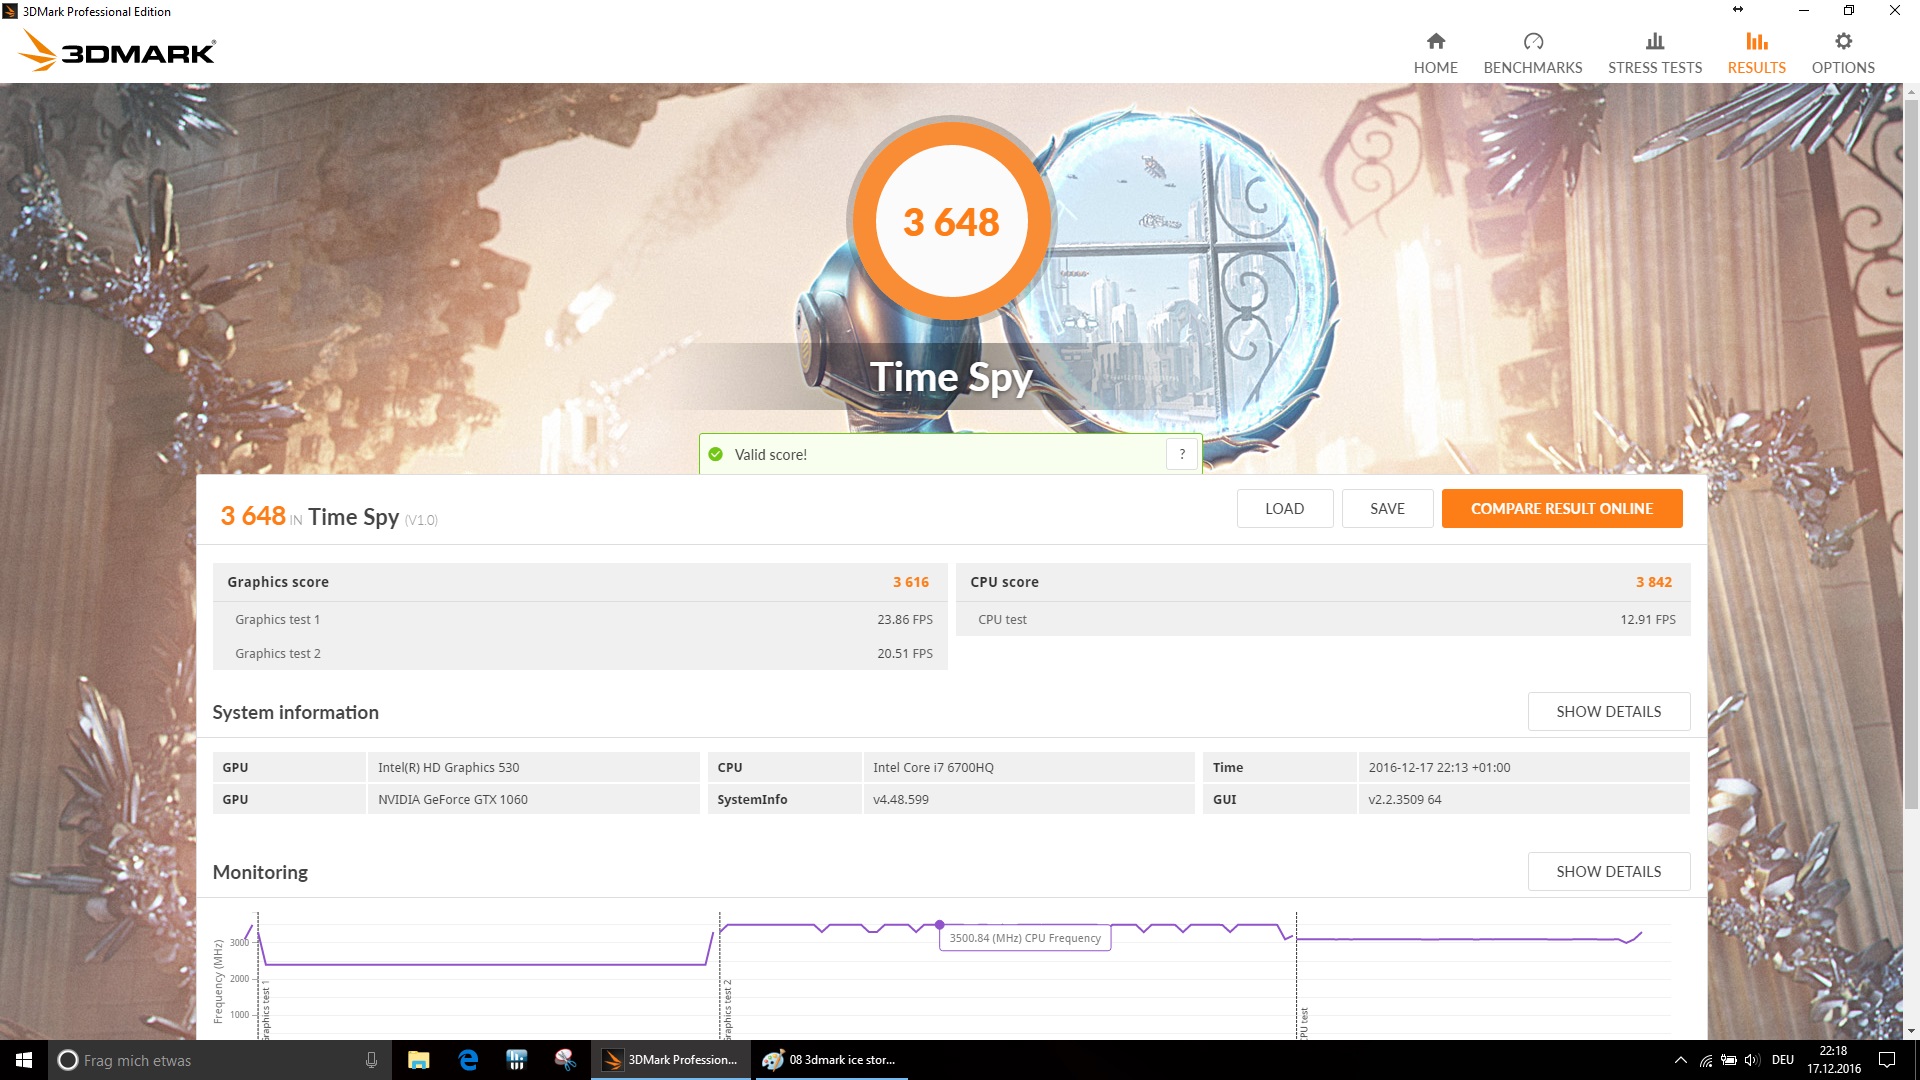
| 3DMark Time Spy Score | 3648 punti | |
Aiuto | ||
| Rise of the Tomb Raider | |
| 1920x1080 High Preset AA:FX AF:4x | |
| Aorus X7 v6 | |
| Acer Predator 17 G9-793-77LG | |
| HP Omen 17-w110ng | |
| Medion Erazer X7849 MD 60292 | |
| MSI GS73VR 6RF | |
| MSI GE72VR-6RF16H21 | |
| 1920x1080 Very High Preset AA:FX AF:16x | |
| Aorus X7 v6 | |
| HP Omen 17-w110ng | |
| Acer Predator 17 G9-793-77LG | |
| Medion Erazer X7849 MD 60292 | |
| MSI GS73VR 6RF | |
| MSI GE72VR-6RF16H21 | |
| Deus Ex Mankind Divided | |
| 1920x1080 High Preset AF:4x | |
| Aorus X7 v6 | |
| Medion Erazer X7849 MD 60292 | |
| MSI GE72VR-6RF16H21 | |
| Asus GL702VM-GC102D | |
| 1920x1080 Ultra Preset AA:2xMS AF:8x | |
| Aorus X7 v6 | |
| Medion Erazer X7849 MD 60292 | |
| MSI GE72VR-6RF16H21 | |
| Asus GL702VM-GC102D | |
| BioShock Infinite | |
| 1366x768 High Preset | |
| Asus GL702VM-GC102D | |
| HP Omen 17-w110ng | |
| MSI GE72VR-6RF16H21 | |
| MSI GS73VR 6RF | |
| 1920x1080 Ultra Preset, DX11 (DDOF) | |
| HP Omen 17-w110ng | |
| MSI GS73VR 6RF | |
| Asus GL702VM-GC102D | |
| MSI GE72VR-6RF16H21 | |
| The Witcher 3 | |
| 1920x1080 High Graphics & Postprocessing (Nvidia HairWorks Off) | |
| Acer Predator 17 G9-793-77LG | |
| HP Omen 17-w110ng | |
| MSI GE72VR-6RF16H21 | |
| 1920x1080 Ultra Graphics & Postprocessing (HBAO+) | |
| Acer Predator 17 G9-793-77LG | |
| HP Omen 17-w110ng | |
| MSI GE72VR-6RF16H21 | |
| basso | medio | alto | ultra | 4K | |
| BioShock Infinite (2013) | 181.3 | 175.9 | 159.5 | 98 | |
| The Witcher 3 (2015) | 177 | 135.9 | 66.2 | 37.2 | 24.7 |
| Rise of the Tomb Raider (2016) | 180 | 132.4 | 71.3 | 58.8 | 23.7 |
| Deus Ex Mankind Divided (2016) | 113.9 | 100.3 | 57.1 | 30.1 |
Rumorosità
| Idle |
| 34 / 35 / 36 dB(A) |
| DVD |
| 41 / dB(A) |
| Sotto carico |
| 40 / 51 dB(A) |
 | ||
30 dB silenzioso 40 dB(A) udibile 50 dB(A) rumoroso |
||
min: | ||
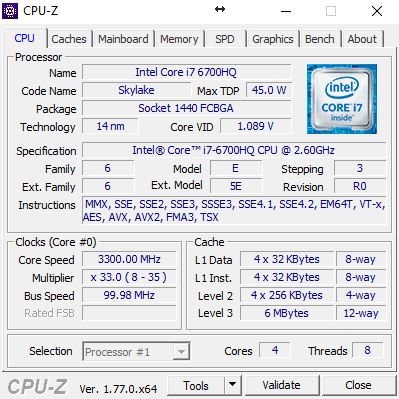
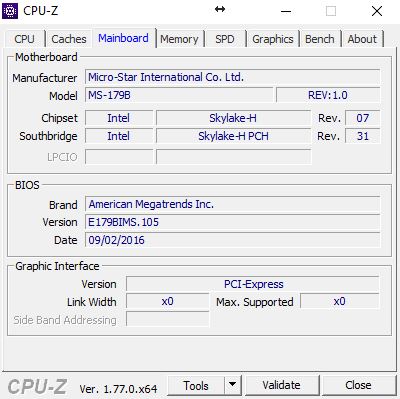
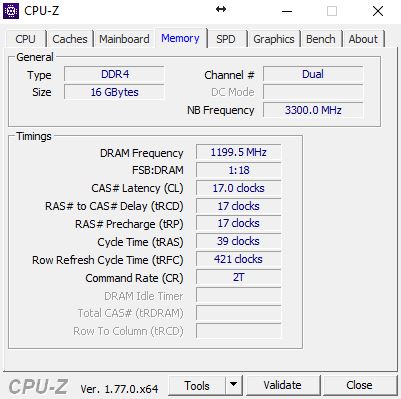
| MSI GE72VR-6RF16H21 6700HQ, GeForce GTX 1060 Mobile | Asus GL702VM-GC102D 6700HQ, GeForce GTX 1060 Mobile | MSI GS73VR 6RF 6700HQ, GeForce GTX 1060 Mobile | Medion Erazer X7849 MD 60292 6820HK, GeForce GTX 1070 Mobile | HP Omen 17-w110ng 6700HQ, GeForce GTX 1070 Mobile | Acer Predator 17 G9-793-77LG 6700HQ, GeForce GTX 1070 Mobile | Aorus X7 v6 6820HK, GeForce GTX 1070 Mobile | |
|---|---|---|---|---|---|---|---|
| Noise | 7% | 2% | 0% | -1% | -2% | -3% | |
| off /ambiente * | 31 | 30.5 2% | 28.4 8% | 31.2 -1% | 30 3% | 31 -0% | 30 3% |
| Idle Minimum * | 34 | 31.4 8% | 31.9 6% | 31.2 8% | 33 3% | 33 3% | 33 3% |
| Idle Average * | 35 | 31.4 10% | 32 9% | 32.6 7% | 34 3% | 34 3% | 35 -0% |
| Idle Maximum * | 36 | 31.5 12% | 34 6% | 34.75 3% | 35 3% | 40 -11% | 40 -11% |
| Load Average * | 40 | 40.9 -2% | 47 -18% | 47.8 -20% | 45 -13% | 44 -10% | 43 -8% |
| Load Maximum * | 51 | 46.2 9% | 49.4 3% | 49.7 3% | 52 -2% | 50 2% | 54 -6% |
* ... Meglio usare valori piccoli
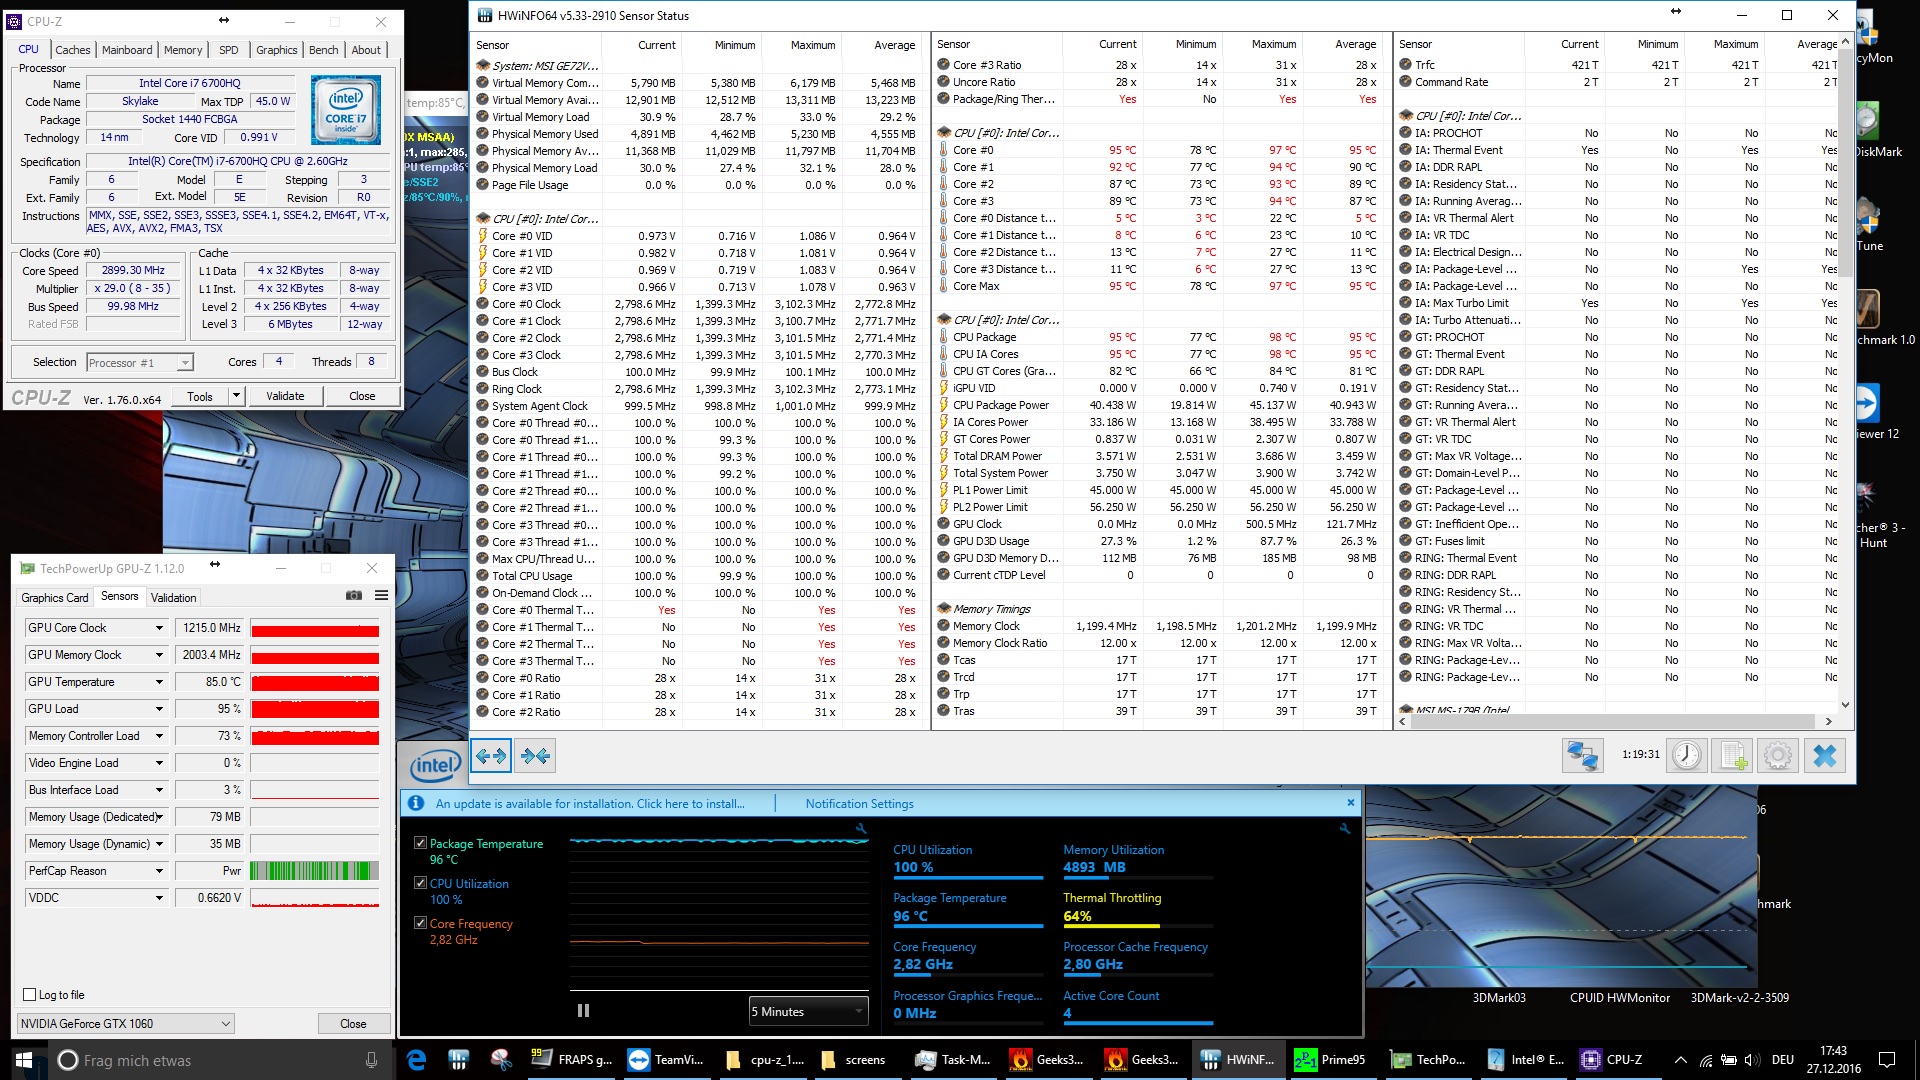
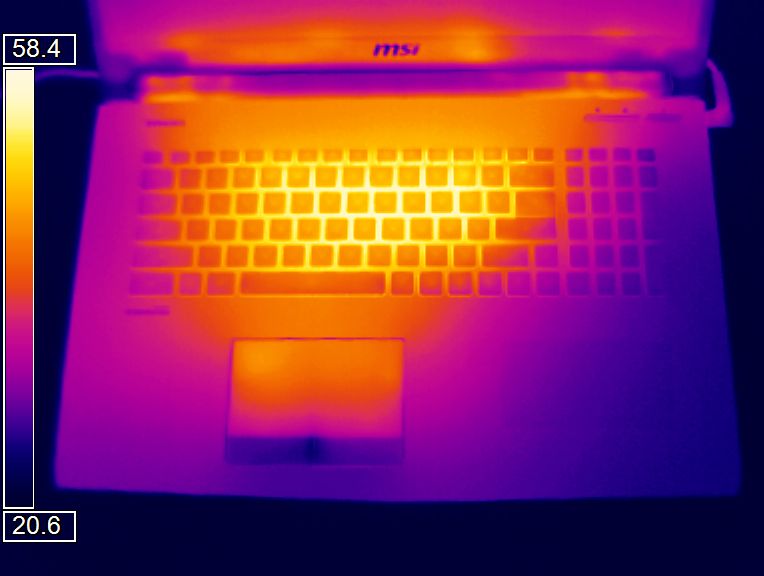
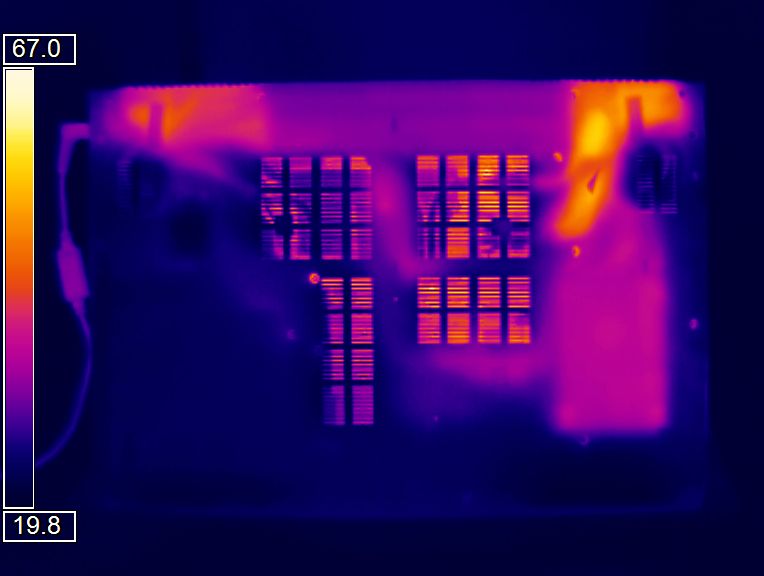
(-) La temperatura massima sul lato superiore è di 48.8 °C / 120 F, rispetto alla media di 40.4 °C / 105 F, che varia da 21.2 a 68.8 °C per questa classe Gaming.
(-) Il lato inferiore si riscalda fino ad un massimo di 48.2 °C / 119 F, rispetto alla media di 43.2 °C / 110 F
(+) In idle, la temperatura media del lato superiore è di 24.5 °C / 76 F, rispetto alla media deld ispositivo di 33.8 °C / 93 F.
(-) I poggiapolsi e il touchpad possono diventare molto caldi al tatto con un massimo di 41.6 °C / 106.9 F.
(-) La temperatura media della zona del palmo della mano di dispositivi simili e'stata di 28.9 °C / 84 F (-12.7 °C / -22.9 F).
| MSI GE72VR-6RF16H21 6700HQ, GeForce GTX 1060 Mobile | Asus GL702VM-GC102D 6700HQ, GeForce GTX 1060 Mobile | MSI GS73VR 6RF 6700HQ, GeForce GTX 1060 Mobile | Medion Erazer X7849 MD 60292 6820HK, GeForce GTX 1070 Mobile | HP Omen 17-w110ng 6700HQ, GeForce GTX 1070 Mobile | Acer Predator 17 G9-793-77LG 6700HQ, GeForce GTX 1070 Mobile | Aorus X7 v6 6820HK, GeForce GTX 1070 Mobile | |
|---|---|---|---|---|---|---|---|
| Heat | -5% | -4% | -2% | 1% | 4% | 0% | |
| Maximum Upper Side * | 48.8 | 53.1 -9% | 50.8 -4% | 53.3 -9% | 45 8% | 42.6 13% | 47.5 3% |
| Maximum Bottom * | 48.2 | 44.9 7% | 60 -24% | 50 -4% | 54.3 -13% | 44.9 7% | 54.5 -13% |
| Idle Upper Side * | 30.1 | 32.9 -9% | 27.4 9% | 30.3 -1% | 29.6 2% | 33.1 -10% | 28.6 5% |
| Idle Bottom * | 30.4 | 33.4 -10% | 28.8 5% | 28 8% | 28.6 6% | 28.9 5% | 28.8 5% |
* ... Meglio usare valori piccoli
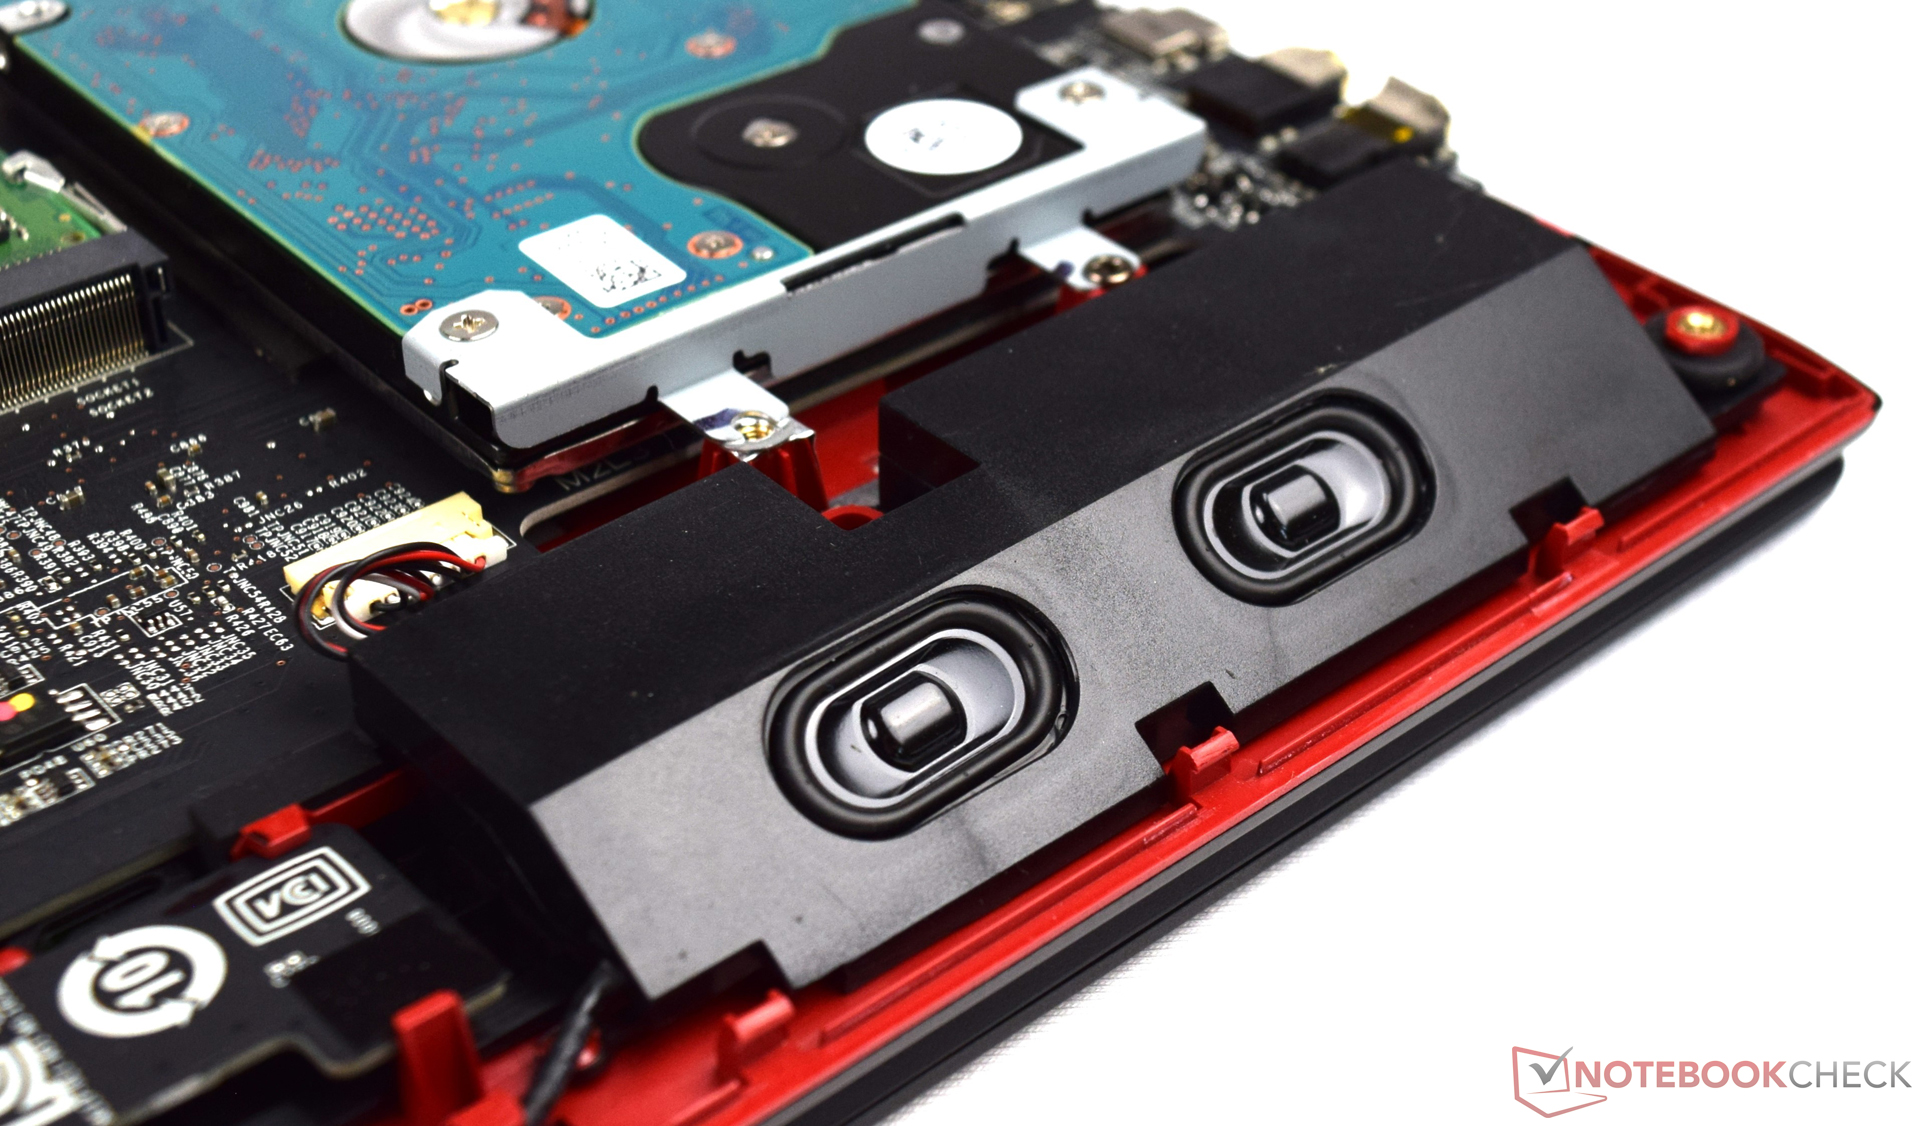
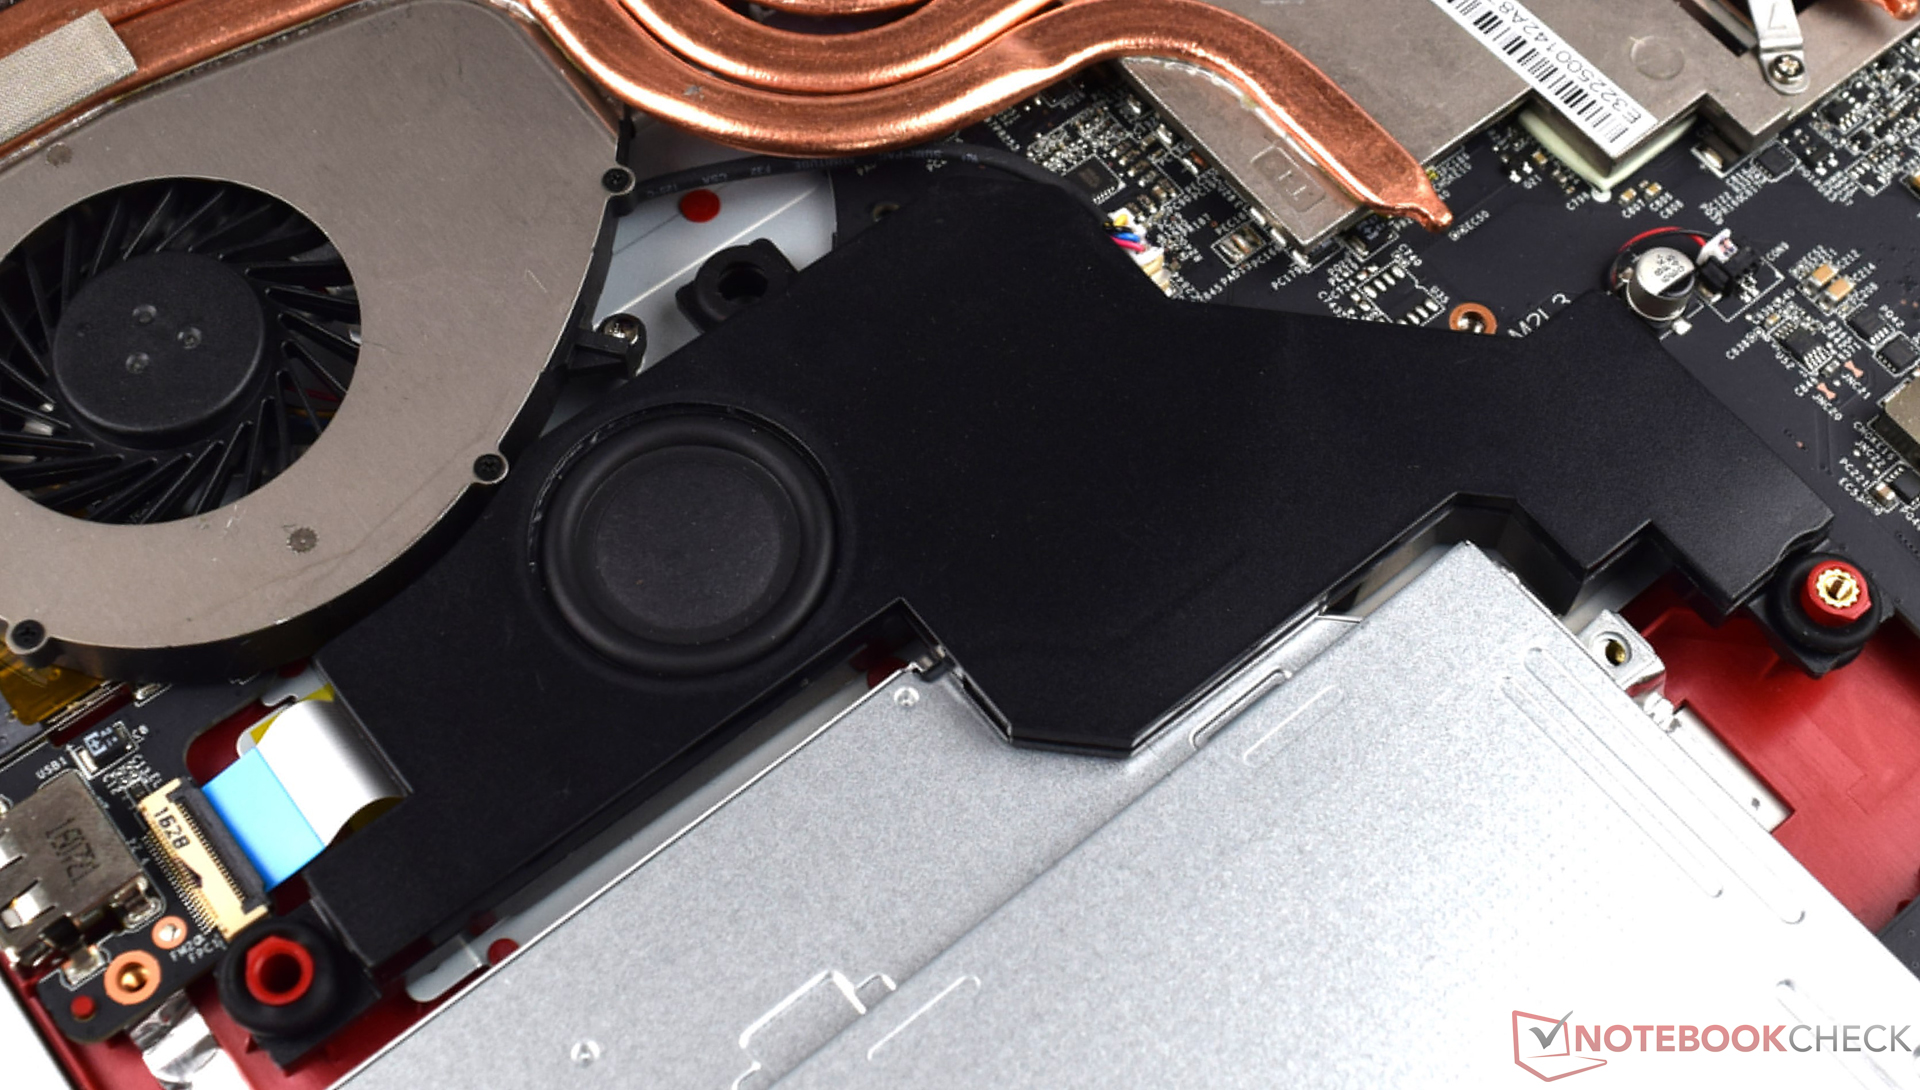
MSI GE72VR-6RF16H21 analisi audio
(+) | gli altoparlanti sono relativamente potenti (92 dB)
Bassi 100 - 315 Hz
(±) | bassi ridotti - in media 14.4% inferiori alla media
(±) | la linearità dei bassi è media (9.3% delta rispetto alla precedente frequenza)
Medi 400 - 2000 Hz
(+) | medi bilanciati - solo only 2.6% rispetto alla media
(+) | medi lineari (3.3% delta rispetto alla precedente frequenza)
Alti 2 - 16 kHz
(+) | Alti bilanciati - appena 3.1% dalla media
(+) | alti lineari (6.5% delta rispetto alla precedente frequenza)
Nel complesso 100 - 16.000 Hz
(+) | suono nel complesso lineare (12.2% differenza dalla media)
Rispetto alla stessa classe
» 11% di tutti i dispositivi testati in questa classe è stato migliore, 4% simile, 85% peggiore
» Il migliore ha avuto un delta di 6%, medio di 18%, peggiore di 132%
Rispetto a tutti i dispositivi testati
» 7% di tutti i dispositivi testati in questa classe è stato migliore, 2% similare, 91% peggiore
» Il migliore ha avuto un delta di 4%, medio di 25%, peggiore di 134%
HP Omen 17-w110ng analisi audio
(+) | gli altoparlanti sono relativamente potenti (85 dB)
Bassi 100 - 315 Hz
(-) | quasi nessun basso - in media 22.3% inferiori alla media
(±) | la linearità dei bassi è media (13.2% delta rispetto alla precedente frequenza)
Medi 400 - 2000 Hz
(+) | medi bilanciati - solo only 2.7% rispetto alla media
(+) | medi lineari (4.9% delta rispetto alla precedente frequenza)
Alti 2 - 16 kHz
(±) | alti elevati - circa 5.9% superiori alla media
(+) | alti lineari (5.3% delta rispetto alla precedente frequenza)
Nel complesso 100 - 16.000 Hz
(±) | la linearità complessiva del suono è media (18.5% di differenza rispetto alla media
Rispetto alla stessa classe
» 57% di tutti i dispositivi testati in questa classe è stato migliore, 9% simile, 35% peggiore
» Il migliore ha avuto un delta di 6%, medio di 18%, peggiore di 132%
Rispetto a tutti i dispositivi testati
» 36% di tutti i dispositivi testati in questa classe è stato migliore, 8% similare, 56% peggiore
» Il migliore ha avuto un delta di 4%, medio di 25%, peggiore di 134%
| Off / Standby | |
| Idle | |
| Sotto carico |
|
Leggenda:
min: Attualmente utilizziamo il Metrahit Energy, un multimetro digitale professionale per la misurazione della qualità della potenza e dell'energia monofase, per le nostre misurazioni. | |
| MSI GE72VR-6RF16H21 6700HQ, GeForce GTX 1060 Mobile | Asus GL702VM-GC102D 6700HQ, GeForce GTX 1060 Mobile | MSI GS73VR 6RF 6700HQ, GeForce GTX 1060 Mobile | Medion Erazer X7849 MD 60292 6820HK, GeForce GTX 1070 Mobile | HP Omen 17-w110ng 6700HQ, GeForce GTX 1070 Mobile | Acer Predator 17 G9-793-77LG 6700HQ, GeForce GTX 1070 Mobile | Aorus X7 v6 6820HK, GeForce GTX 1070 Mobile | |
|---|---|---|---|---|---|---|---|
| Power Consumption | 0% | -40% | -10% | -22% | -60% | -62% | |
| Idle Minimum * | 13 | 15.6 -20% | 22.6 -74% | 14 -8% | 19 -46% | 25 -92% | 29 -123% |
| Idle Average * | 20 | 20.2 -1% | 32.7 -64% | 20 -0% | 25 -25% | 35 -75% | 31 -55% |
| Idle Maximum * | 26 | 21.4 18% | 32.8 -26% | 23.8 8% | 31 -19% | 46 -77% | 38 -46% |
| Load Average * | 83 | 90 -8% | 114.7 -38% | 103 -24% | 90 -8% | 103 -24% | 111 -34% |
| Load Maximum * | 169 | 147 13% | 167.9 1% | 212 -25% | 193 -14% | 223 -32% | 253 -50% |
* ... Meglio usare valori piccoli
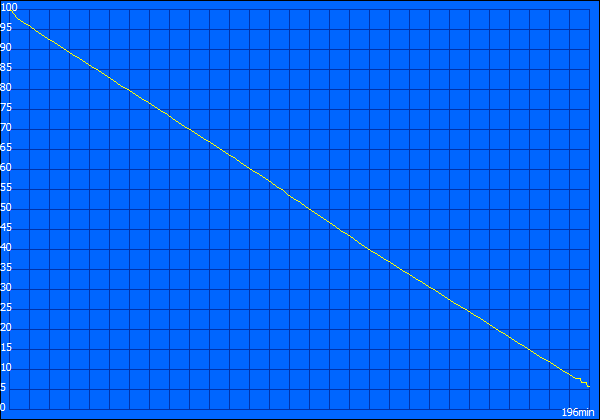

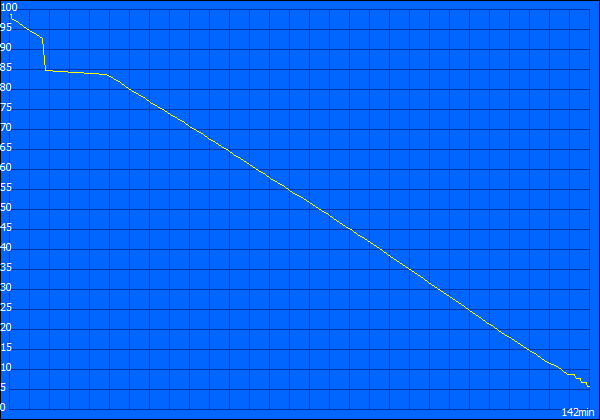
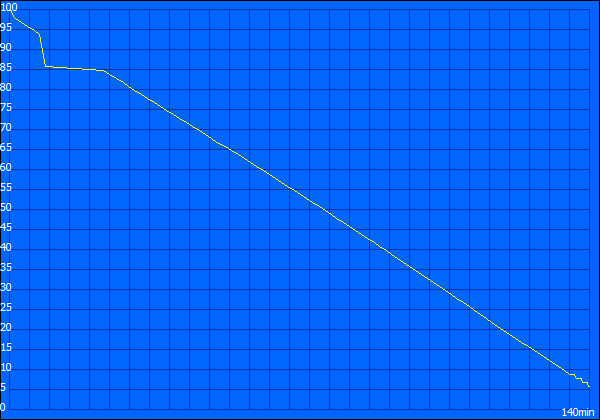
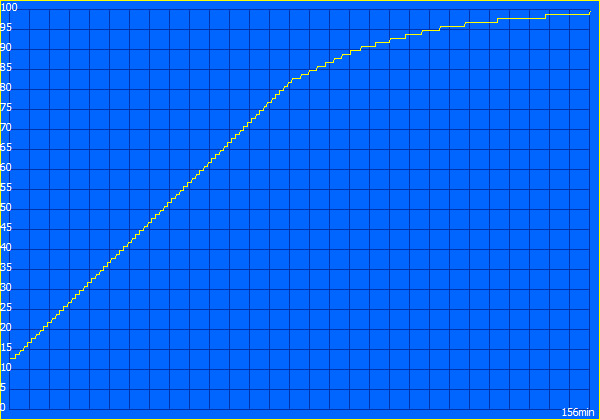
| MSI GE72VR-6RF16H21 51 Wh | Asus GL702VM-GC102D 76 Wh | MSI GS73VR 6RF 65 Wh | Medion Erazer X7849 MD 60292 60 Wh | HP Omen 17-w110ng 95 Wh | Acer Predator 17 G9-793-77LG 88 Wh | Aorus X7 v6 94 Wh | |
|---|---|---|---|---|---|---|---|
| Autonomia della batteria | 90% | 65% | -3% | 112% | 69% | 28% | |
| Reader / Idle | 196 | 353 80% | 353 80% | 163 -17% | 432 120% | 278 42% | |
| H.264 | 140 | 262 87% | 233 66% | ||||
| WiFi v1.3 | 142 | 250 76% | 213 50% | 91 -36% | 247 74% | 200 41% | 182 28% |
| Load | 40 | 87 118% | 66 65% | 57 43% | 115 188% | 89 123% |
Pro
Contro

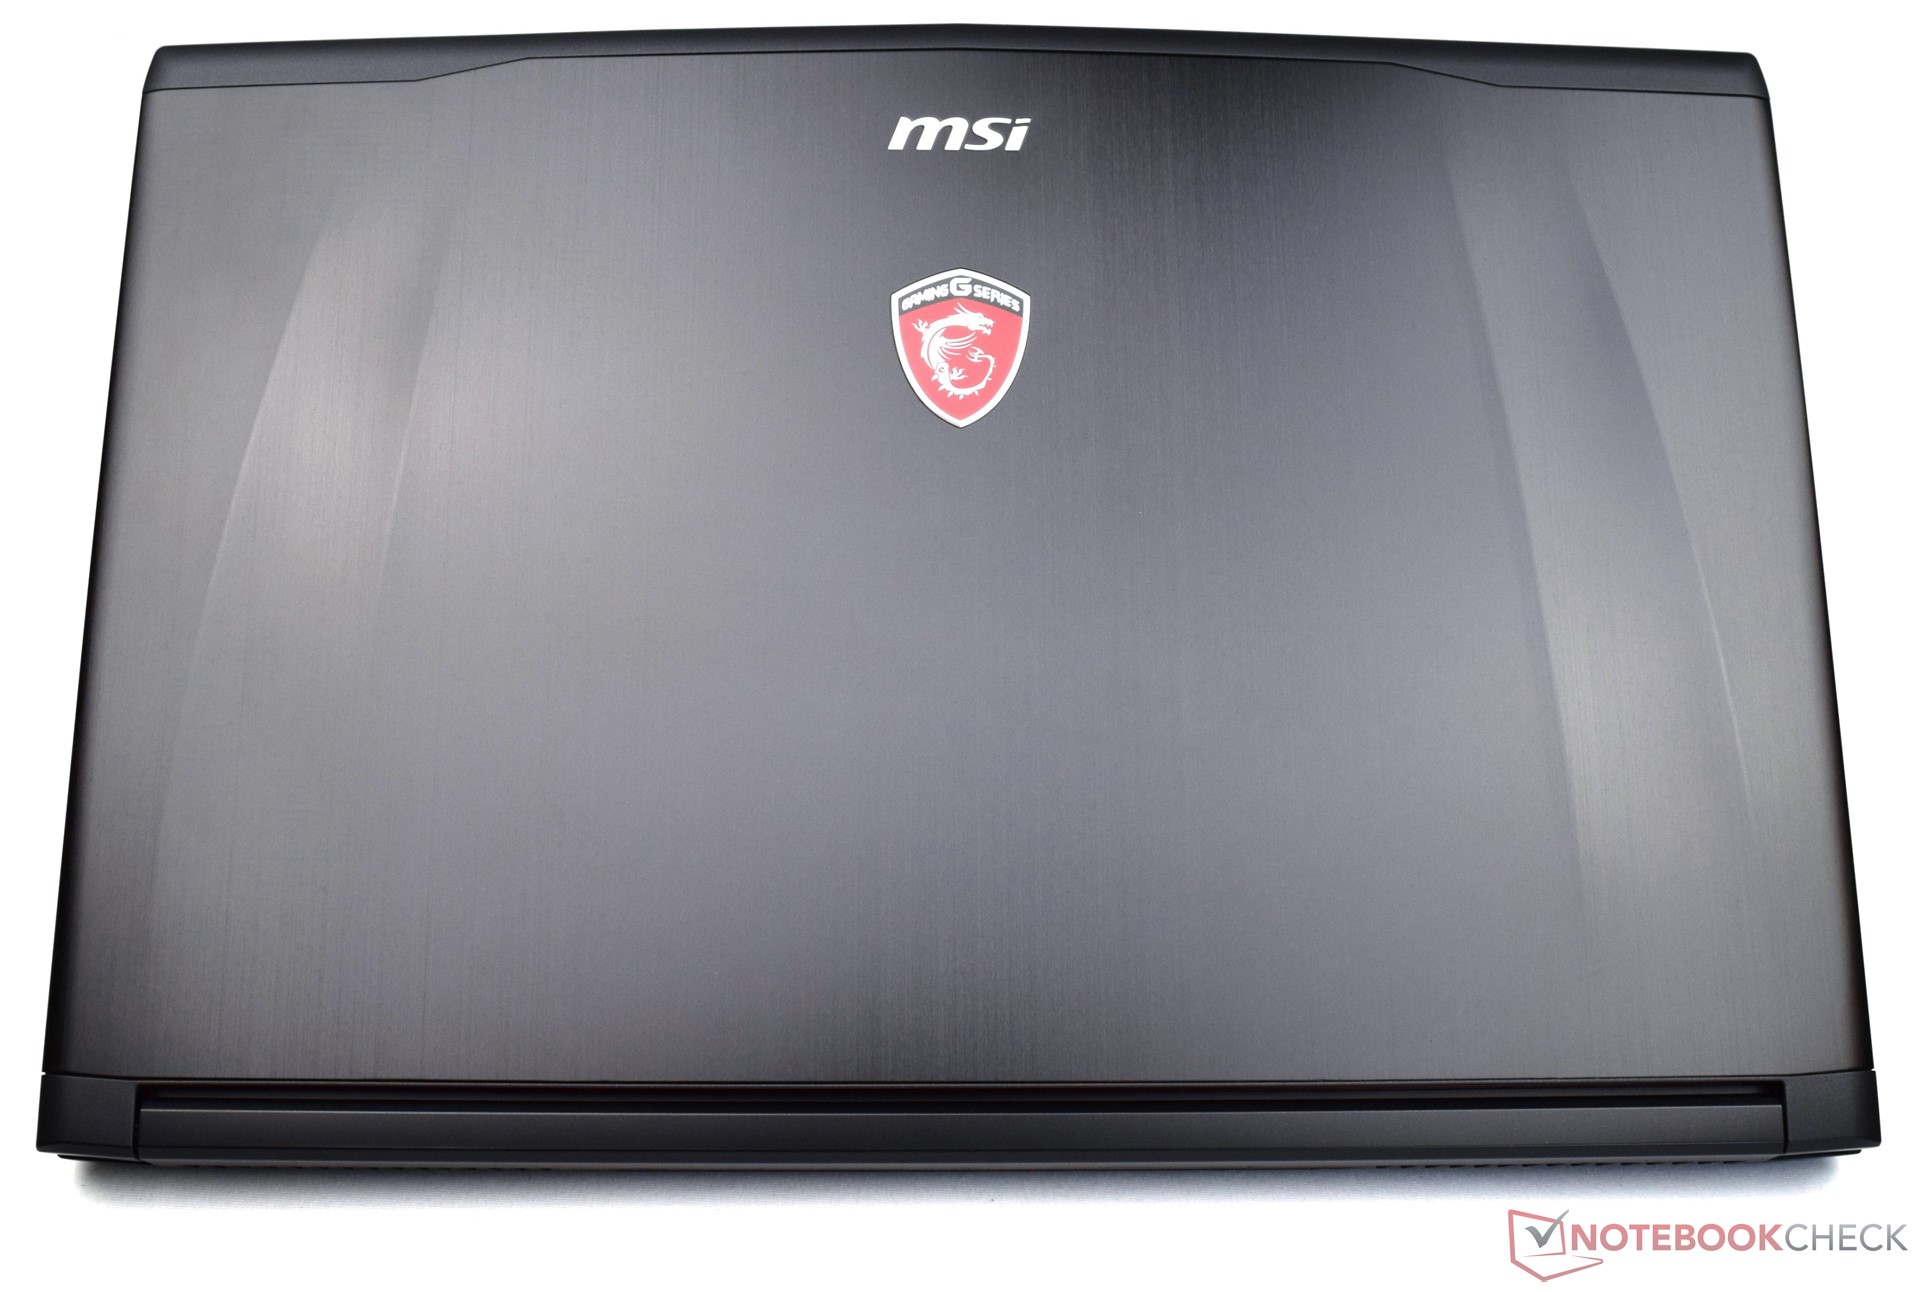
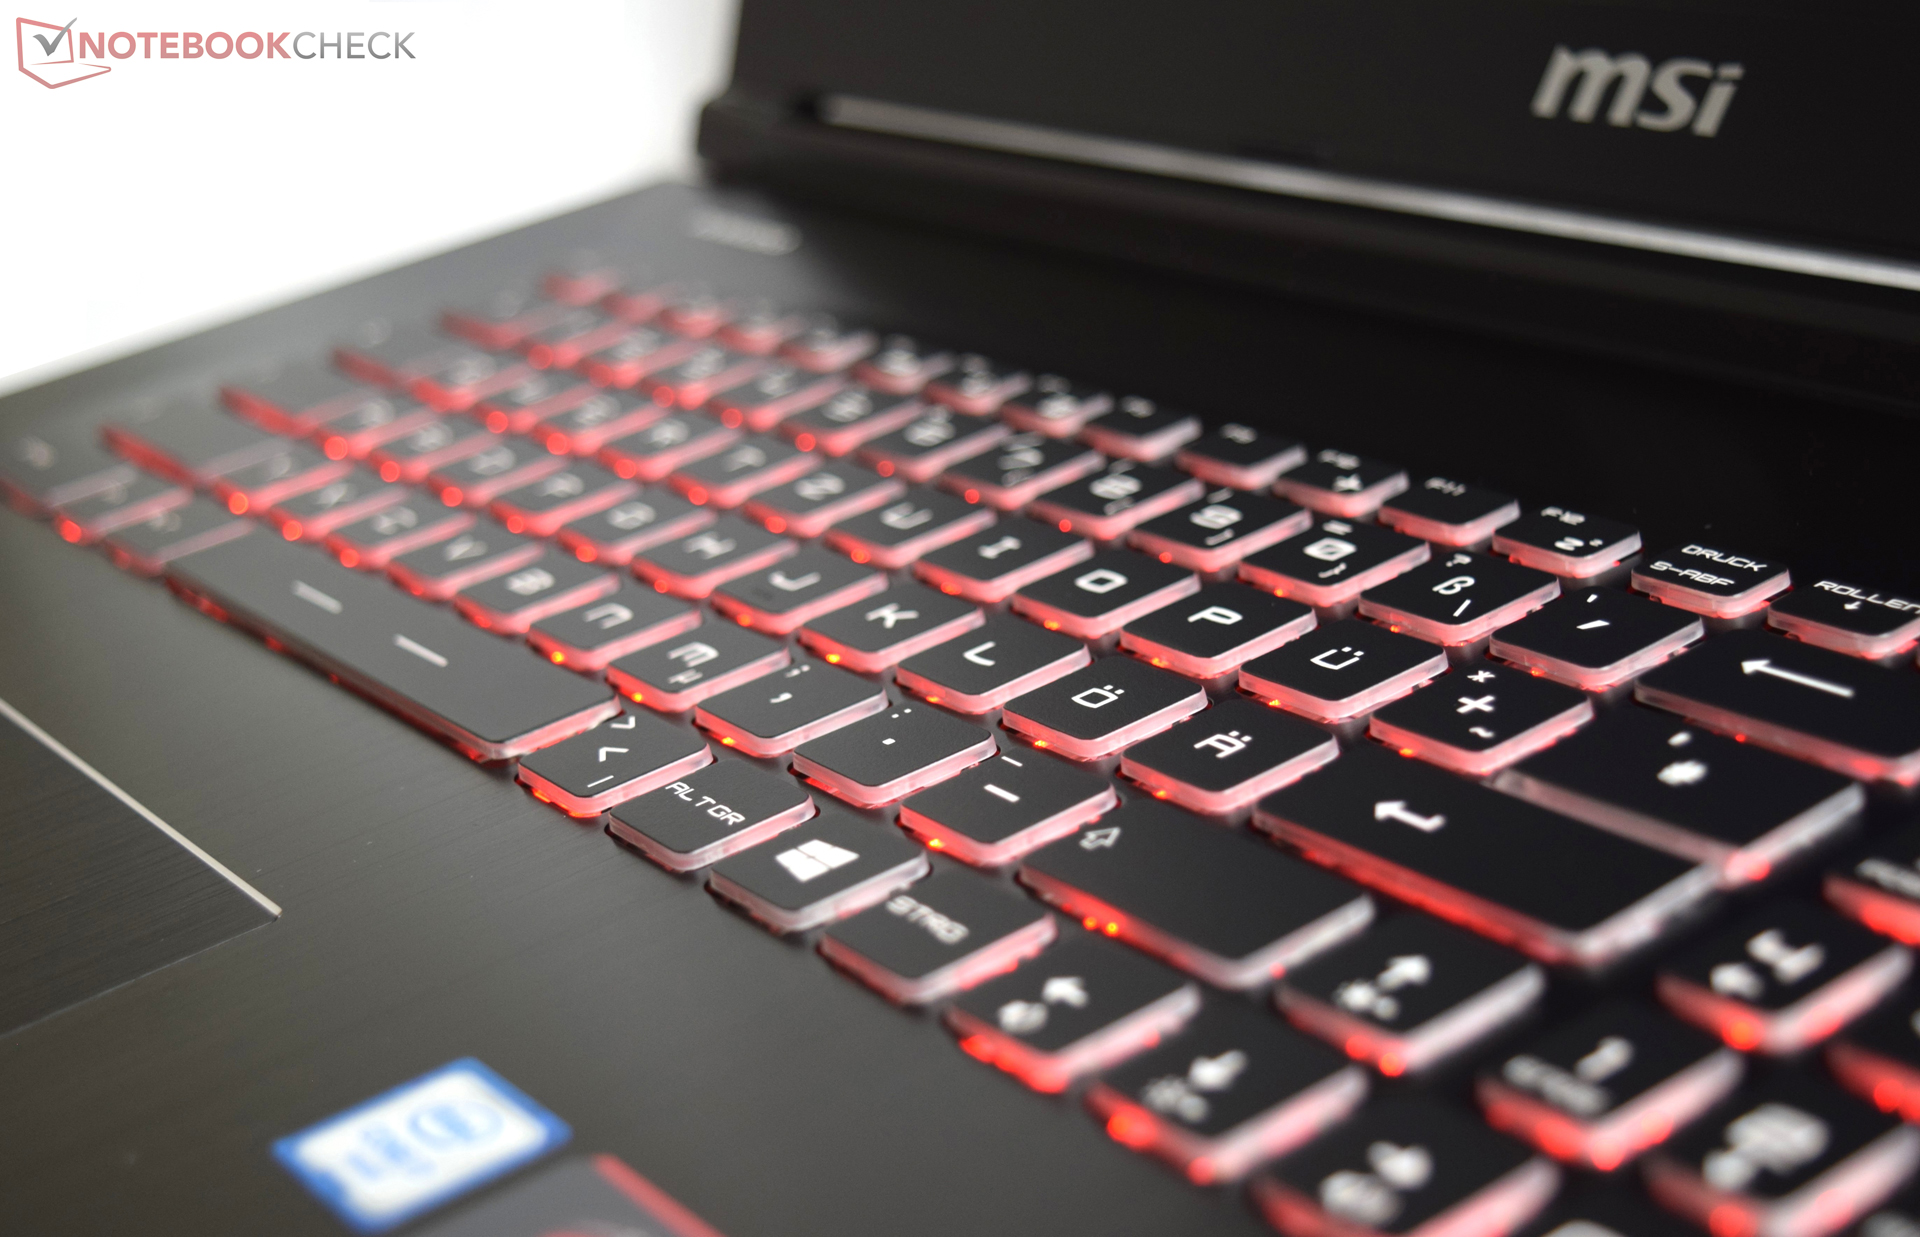
MSI offre molti ottimi dispositivi high-end. Tuttavia, non tutti sono disposti a spendere 2.000 Euro per un portatile. Con il GE72VR, il produttore punta alla fascia medio alta e richiede 1.750 Euro per la configurazione che abbiamo testato. Tuttavia, il nostro modello non è il top in termini di prezzo prestazioni, in quanto l'HP Omen (Pascal) ha una GPU molto più veloce GeForce GTX 1070 ed è nella stessa fascia di prezzo del GE72VR. Questo portatile da 17" si fa notare per il design sottile ed elegante e la buona qualità di costruzione. Non dovete dimenticare il display da 120-Hz, in quanto è una feature unica e si comporta molto bene nonostante la tecnologia TN. Orpelli come illuminazione della tastiera e Dragon Center MSI sono ben accetti.
Coloro che vogliono comprare il GE72VR avranno un solido portatile gaming con prestazioni sufficienti per i giochi attuali. I dettagi e le interessanti features completano il pacchetto. IN aggiunta, troverete un attraente display 120 Hz.
A parte le impressioni positive, ci sono anche alcune pecche. Ad esempio, la superficie leggermente piccola del touchpad rende difficili i controlli multi-touch (es. zoom). In aggiunta, dobbiamo criticare l'autonomia limitata. Potrebbe essere che il produttore farà una considerazione sulla capacità della batteria in futuro, rendendo il portatile più versatile.
Nota: si tratta di una recensione breve, con alcune sezioni non tradotte, per la versione integrale in inglese guardate qui.
MSI GE72VR-6RF16H21
-
12/29/2016 v6(old)
Sebastian Bade