 Deutsch
 English
 Español
 Français
 Italiano
 Nederlands
 Polski
 Português
 Русский
 Türkçe
 Svenska
 Chinese
 Magyar
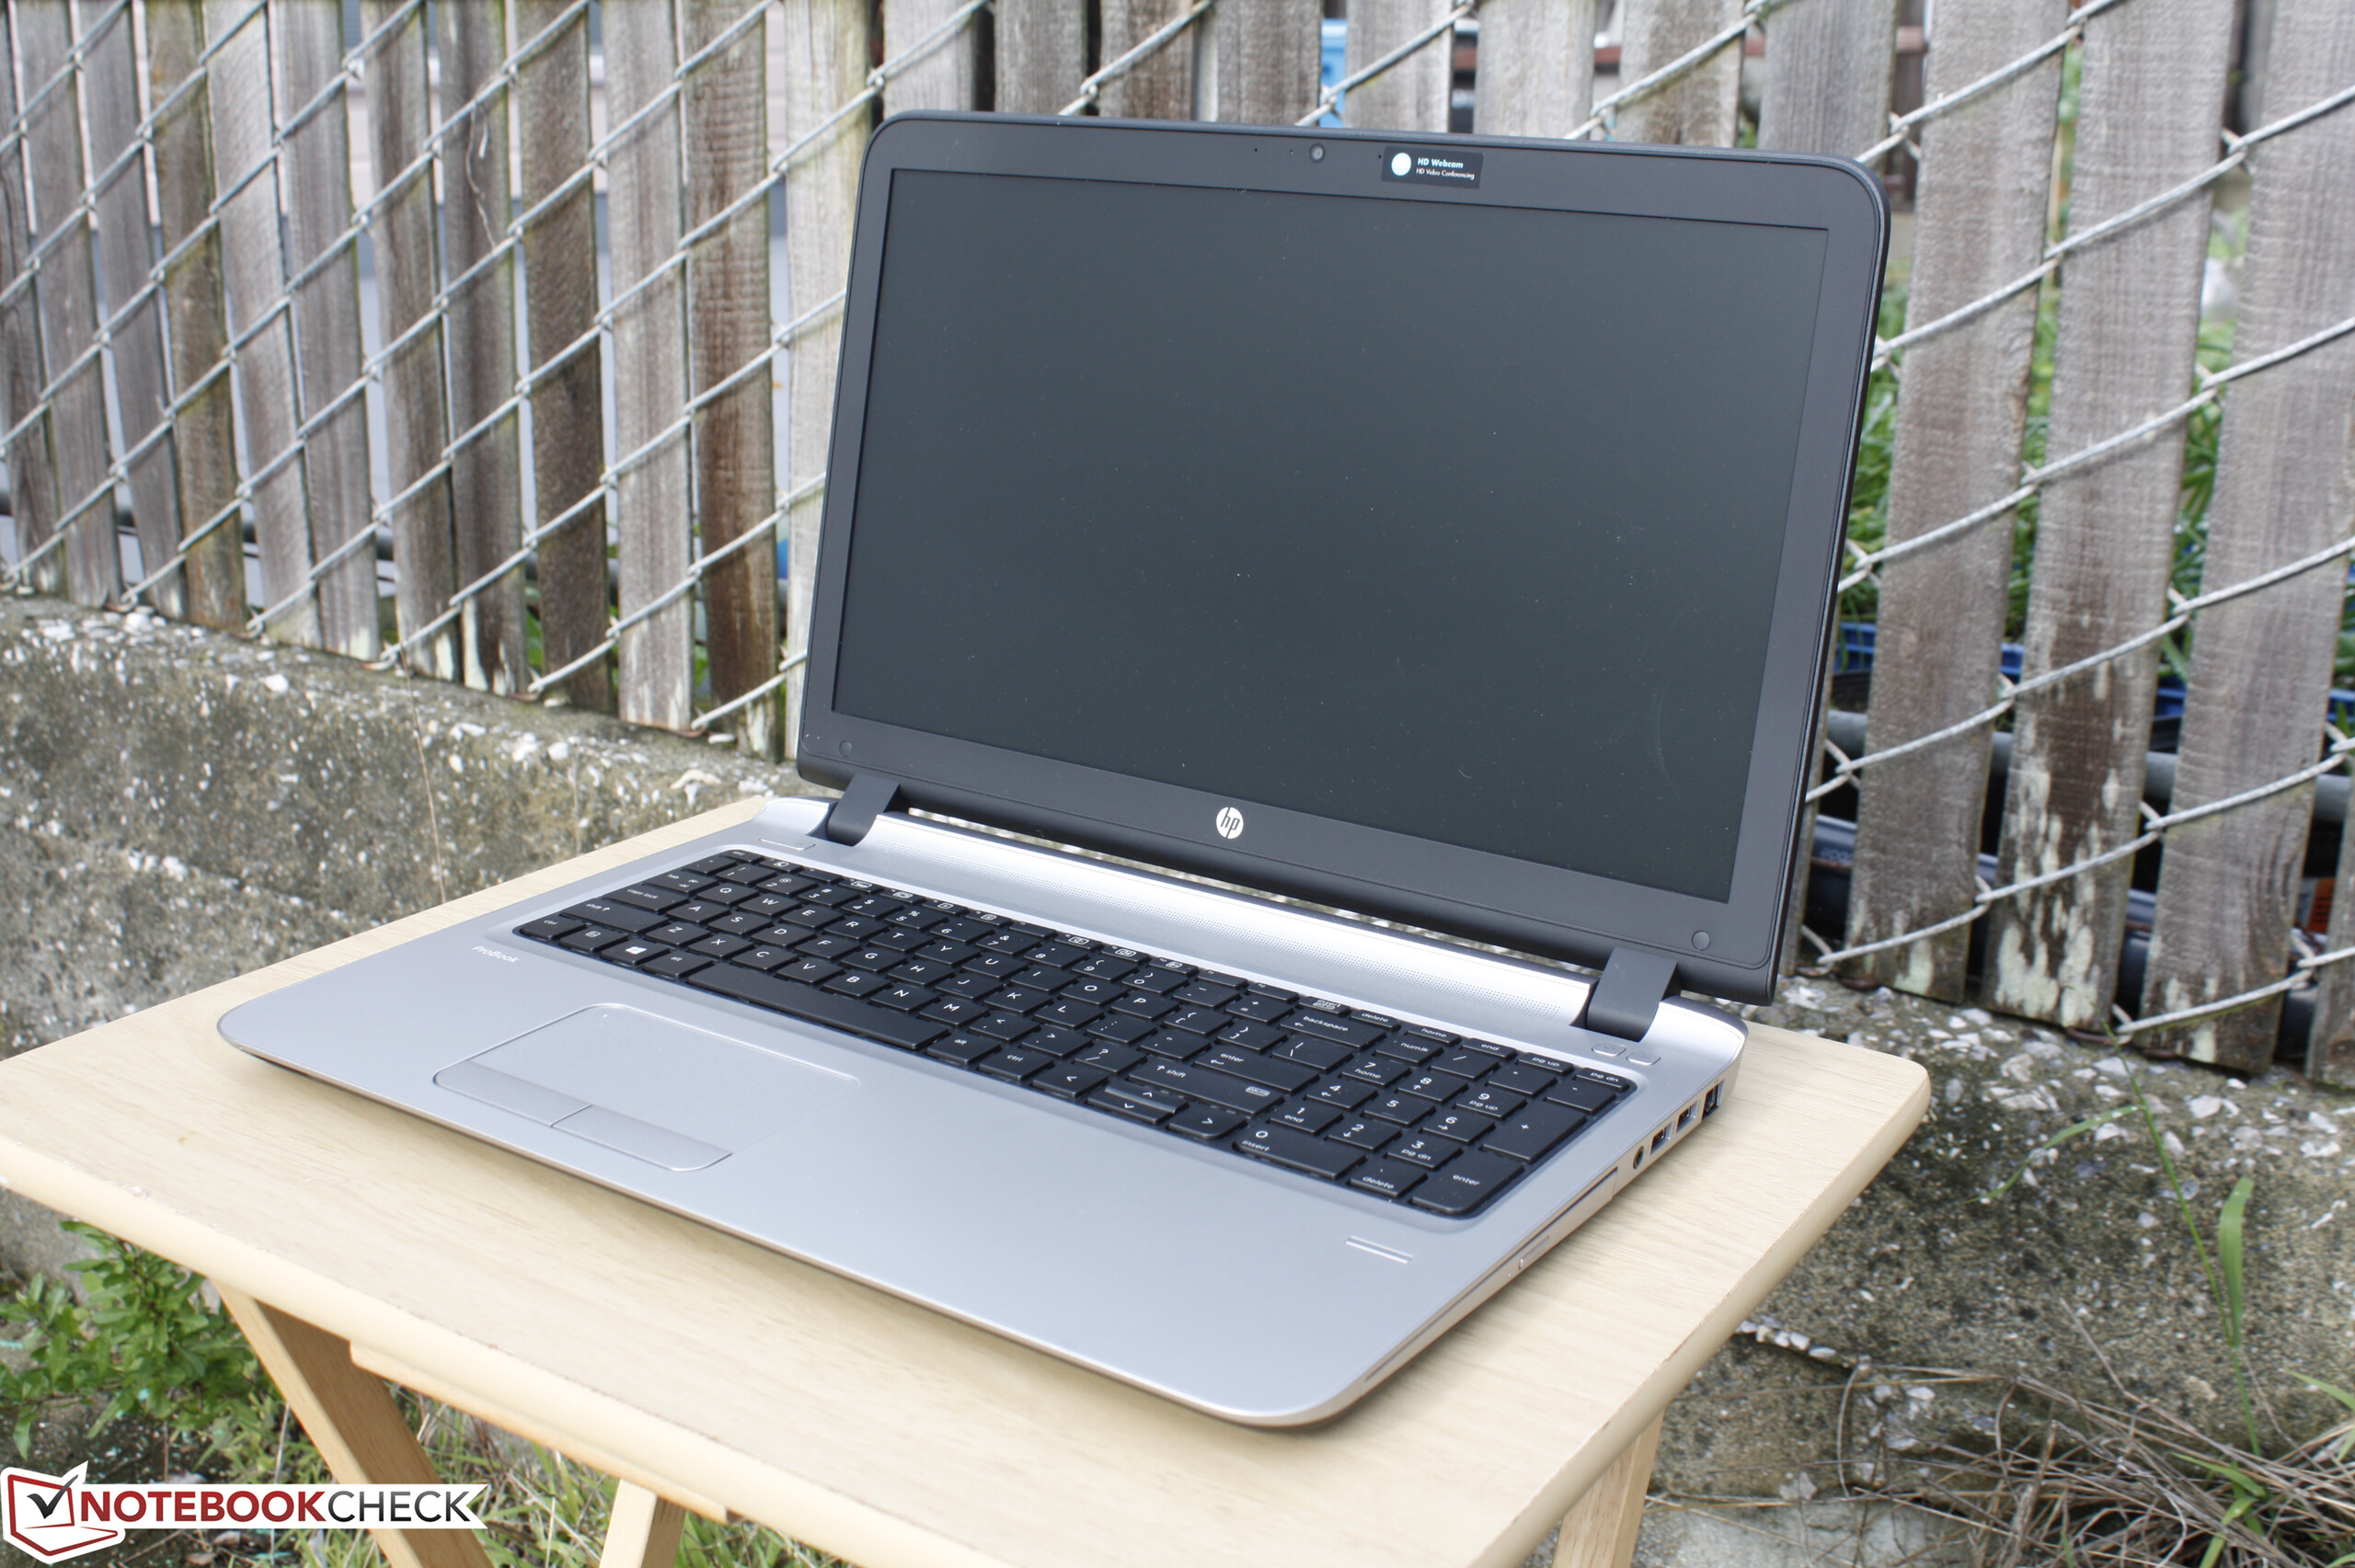
Recensione breve del Portatile HP ProBook 455 G3 T1B79UT

| SD Card Reader | |
| average JPG Copy Test (av. of 3 runs) | |
| MSI GT73VR 6RF | |
| Dell XPS 13 9360 FHD i5 | |
| HP ProBook 455 T1B79UT | |
| maximum AS SSD Seq Read Test (1GB) | |
| Dell XPS 13 9360 FHD i5 | |
| MSI GT73VR 6RF | |
| HP ProBook 455 T1B79UT | |
| Networking | |
| iperf3 receive AX12 | |
| Dell XPS 13 9360 FHD i5 | |
| HP Pavilion x360 15t X3W72AV | |
| HP ProBook 455 T1B79UT | |
| iperf3 transmit AX12 | |
| Dell XPS 13 9360 FHD i5 | |
| HP Pavilion x360 15t X3W72AV | |
| HP ProBook 455 T1B79UT | |
| |||||||||||||||||||||||||
Distribuzione della luminosità: 72 %
Al centro con la batteria: 245.3 cd/m²
Contrasto: 598:1 (Nero: 0.41 cd/m²)
ΔE Color 9.4 | 0.5-29.43 Ø5
ΔE Greyscale 11.1 | 0.57-98 Ø5.3
66.1% sRGB (Argyll 1.6.3 3D)
42.3% AdobeRGB 1998 (Argyll 1.6.3 3D)
45.98% AdobeRGB 1998 (Argyll 2.2.0 3D)
66.4% sRGB (Argyll 2.2.0 3D)
44.46% Display P3 (Argyll 2.2.0 3D)
Gamma: 2.27
| HP ProBook 455 T1B79UT TN, 15.60, 1366x768 | HP 15z-ba000 BOE06A4, TN, 15.60, 1366x768 | Dell Latitude 15-3570 LG Philips LGD04AF / 156WHU, TN LED, 15.60, 1366x768 | Lenovo ThinkPad E560 20EV000MGE Lenovo N156B6-L07, TN LED, 15.60, 1366x768 | Asus F555UB-XO043T AU Optronics B156XTN04.6, TN LED, 15.60, 1366x768 | |
|---|---|---|---|---|---|
| Display | -13% | -9% | -15% | -14% | |
| Display P3 Coverage | 44.46 | 38.58 -13% | 40.61 -9% | 37.63 -15% | 38.22 -14% |
| sRGB Coverage | 66.4 | 57.7 -13% | 61.1 -8% | 56.7 -15% | 57.5 -13% |
| AdobeRGB 1998 Coverage | 45.98 | 39.86 -13% | 41.96 -9% | 38.88 -15% | 39.49 -14% |
| Response Times | 67% | -1% | 7% | -22% | |
| Response Time Grey 50% / Grey 80% * | 45.2 ? | 41.2 ? 9% | 37 ? 18% | 50 ? -11% | 46 ? -2% |
| Response Time Black / White * | 30.8 ? | 33.6 ? -9% | 37 ? -20% | 23 ? 25% | 27 ? 12% |
| PWM Frequency | 198.4 ? | 595 ? 200% | 50 ? -75% | ||
| Screen | 4% | -17% | -10% | 5% | |
| Brightness middle | 245.3 | 244.5 0% | 202 -18% | 241 -2% | 214 -13% |
| Brightness | 231 | 232 0% | 211 -9% | 226 -2% | 205 -11% |
| Brightness Distribution | 72 | 80 11% | 88 22% | 89 24% | 82 14% |
| Black Level * | 0.41 | 0.385 6% | 0.62 -51% | 0.48 -17% | 0.46 -12% |
| Contrast | 598 | 635 6% | 326 -45% | 502 -16% | 465 -22% |
| Colorchecker dE 2000 * | 9.4 | 8.62 8% | 12.35 -31% | 12.43 -32% | 6.52 31% |
| Colorchecker dE 2000 max. * | 20 | 17.38 13% | 19.9 -0% | 21.03 -5% | 9.1 54% |
| Greyscale dE 2000 * | 11.1 | 9.8 12% | 13.46 -21% | 13.24 -19% | 7.05 36% |
| Gamma | 2.27 97% | 2.09 105% | 2.44 90% | 2.61 84% | 2.41 91% |
| CCT | 12802 51% | 11391 57% | 15217 43% | 15733 41% | 8623 75% |
| Color Space (Percent of AdobeRGB 1998) | 42.3 | 39.86 -6% | 39 -8% | 36 -15% | 36.6 -13% |
| Color Space (Percent of sRGB) | 66.1 | 57.71 -13% | 61 -8% | 57 -14% | 57.8 -13% |
| Media totale (Programma / Settaggio) | 19% /
12% | -9% /
-13% | -6% /
-9% | -10% /
-3% |
* ... Meglio usare valori piccoli
Tempi di risposta del Display
| ↔ Tempi di risposta dal Nero al Bianco | ||
|---|---|---|
| 30.8 ms ... aumenta ↗ e diminuisce ↘ combinato | ↗ 11.2 ms Incremento | 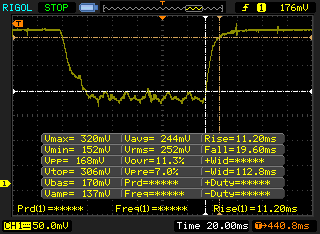 |
| ↘ 19.6 ms Calo | ||
| Lo schermo mostra tempi di risposta lenti nei nostri tests e sarà insoddisfacente per i gamers. In confronto, tutti i dispositivi di test variano da 0.1 (minimo) a 240 (massimo) ms. » 81 % di tutti i dispositivi è migliore. Questo significa che i tempi di risposta rilevati sono peggiori rispetto alla media di tutti i dispositivi testati (21.5 ms). | ||
| ↔ Tempo di risposta dal 50% Grigio all'80% Grigio | ||
| 45.2 ms ... aumenta ↗ e diminuisce ↘ combinato | ↗ 23.2 ms Incremento | 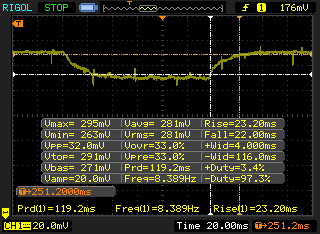 |
| ↘ 22 ms Calo | ||
| Lo schermo mostra tempi di risposta lenti nei nostri tests e sarà insoddisfacente per i gamers. In confronto, tutti i dispositivi di test variano da 0.2 (minimo) a 636 (massimo) ms. » 74 % di tutti i dispositivi è migliore. Questo significa che i tempi di risposta rilevati sono peggiori rispetto alla media di tutti i dispositivi testati (33.7 ms). | ||
Sfarfallio dello schermo / PWM (Pulse-Width Modulation)
| flickering dello schermo / PWM rilevato | 198.4 Hz | ≤ 99 % settaggio luminosita' | 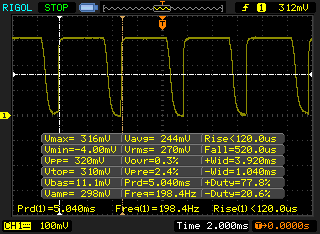 |
Il display sfarfalla a 198.4 Hz (Probabilmente a causa dell'uso di PWM) Flickering rilevato ad una luminosita' di 99 % o inferiore. Non dovrebbe verificarsi flickering o PWM sopra questo valore di luminosita'. La frequenza di 198.4 Hz è relativamente bassa, quindi gli utenti sensibili potrebbero notare il flickering ed accusare stanchezza agli occhi a questo livello di luminosità e a livelli inferiori. In confronto: 53 % di tutti i dispositivi testati non utilizza PWM per ridurre la luminosita' del display. Se è rilevato PWM, una media di 17924 (minimo: 5 - massimo: 3846000) Hz è stata rilevata. | |||
| wPrime 2.10 - 1024m | |
| HP 250 G5 Y1V08UT | |
| Lenovo IdeaPad Z40-59422614 | |
| HP ProBook 455 T1B79UT | |
| Super Pi Mod 1.5 XS 32M - 32M | |
| HP 250 G5 Y1V08UT | |
| HP ProBook 455 T1B79UT | |
| Lenovo IdeaPad Z40-59422614 | |
| Dell XPS 13 9360 FHD i5 | |
* ... Meglio usare valori piccoli
| PCMark 8 Home Score Accelerated v2 | 2577 punti | |
| PCMark 8 Creative Score Accelerated v2 | 3086 punti | |
| PCMark 8 Work Score Accelerated v2 | 3511 punti | |
Aiuto | ||
| HP ProBook 455 T1B79UT Toshiba MQ01ACF050 | HP 15z-ba000 Adata IM2S3138E-128GM-B | Dell Latitude 15-3570 Samsung CM871 MZNLF128HCHP | Lenovo ThinkPad E560 20EV000MGE Western Digital WD Black Mobile 500GB (WD5000LPLX) | Lenovo Yoga 510-15IKB 80VC000XGE Samsung MZYTY256HDHP | |
|---|---|---|---|---|---|
| CrystalDiskMark 3.0 | 4322% | 1964% | -7% | 8581% | |
| Read Seq | 124.3 | 397.9 220% | 453.2 265% | 120.4 -3% | 529 326% |
| Write Seq | 121.8 | 171.4 41% | 137.7 13% | 123.1 1% | 508 317% |
| Read 512 | 43.07 | 367.5 753% | 308.5 616% | 34.31 -20% | 409.8 851% |
| Write 512 | 62 | 172.3 178% | 134.1 116% | 66.8 8% | 316.5 410% |
| Read 4k | 0.53 | 26.11 4826% | 19.06 3496% | 0.373 -30% | 36.01 6694% |
| Write 4k | 1.304 | 52.3 3911% | 21.31 1534% | 1.29 -1% | 106.7 8083% |
| Read 4k QD32 | 1.174 | 164.3 13895% | 93.5 7864% | 0.976 -17% | 384.8 32677% |
| Write 4k QD32 | 1.224 | 132.8 10750% | 23.3 1804% | 1.285 5% | 237.3 19287% |

| 3DMark | |
| 1280x720 Cloud Gate Standard Graphics | |
| Dell XPS 13 9360 FHD i5 | |
| Acer TravelMate P249-M-5452 | |
| Lenovo IdeaPad Z40-59422614 | |
| HP 250 G4 T6P08ES | |
| HP ProBook 455 T1B79UT | |
| HP 250 G5 Y1V08UT | |
| 1920x1080 Fire Strike Graphics | |
| HP 250 G4 T6P08ES | |
| Dell XPS 13 9360 FHD i5 | |
| Lenovo IdeaPad Z40-59422614 | |
| HP ProBook 455 T1B79UT | |
| Acer TravelMate P249-M-5452 | |
| 1920x1080 Ice Storm Extreme Graphics | |
| Dell XPS 13 9360 FHD i5 | |
| Acer TravelMate P249-M-5452 | |
| HP ProBook 455 T1B79UT | |
| HP 250 G5 Y1V08UT | |
| 3DMark 11 Performance | 1457 punti | |
| 3DMark Ice Storm Standard Score | 36716 punti | |
| 3DMark Cloud Gate Standard Score | 3463 punti | |
| 3DMark Fire Strike Score | 736 punti | |
| 3DMark Fire Strike Extreme Score | 373 punti | |
Aiuto | ||
| basso | medio | alto | ultra | |
| BioShock Infinite (2013) | 40.9 | 24.4 | 19.2 | |
| Metro: Last Light (2013) | 15.4 | |||
| Rise of the Tomb Raider (2016) | 16.8 | |||
| Overwatch (2016) | 26.1 |
Rumorosità
| Idle |
| 32.4 / 32.4 / 32.5 dB(A) |
| Sotto carico |
| 35.5 / 36.6 dB(A) |
 | ||
30 dB silenzioso 40 dB(A) udibile 50 dB(A) rumoroso |
||
min: | ||
| HP ProBook 455 T1B79UT Radeon R6 (Carrizo), A10-8700P, Toshiba MQ01ACF050 | HP 15z-ba000 Radeon R4 (Beema), A6-7310, Adata IM2S3138E-128GM-B | Dell Latitude 15-3570 HD Graphics 520, 6200U, Samsung CM871 MZNLF128HCHP | Lenovo ThinkPad E560 20EV000MGE HD Graphics 520, 6100U, Western Digital WD Black Mobile 500GB (WD5000LPLX) | Lenovo Yoga 510-15IKB 80VC000XGE Radeon R7 M460, i5-7200U, Samsung MZYTY256HDHP | |
|---|---|---|---|---|---|
| Noise | -0% | 3% | -3% | 0% | |
| off /ambiente * | 28.8 | 28.6 1% | 31 -8% | 31.2 -8% | 30.15 -5% |
| Idle Minimum * | 32.4 | 31.6 2% | 31 4% | 32.3 -0% | 30.2 7% |
| Idle Average * | 32.4 | 31.6 2% | 31 4% | 32.3 -0% | 30.2 7% |
| Idle Maximum * | 32.5 | 31.6 3% | 31 5% | 32.5 -0% | 31 5% |
| Load Average * | 35.5 | 37.2 -5% | 34.2 4% | 36 -1% | 38 -7% |
| Load Maximum * | 36.6 | 38.2 -4% | 34.3 6% | 38.8 -6% | 38.6 -5% |
* ... Meglio usare valori piccoli
(±) La temperatura massima sul lato superiore è di 44 °C / 111 F, rispetto alla media di 34.2 °C / 94 F, che varia da 21.2 a 62.5 °C per questa classe Office.
(±) Il lato inferiore si riscalda fino ad un massimo di 42 °C / 108 F, rispetto alla media di 36.7 °C / 98 F
(+) In idle, la temperatura media del lato superiore è di 24.8 °C / 77 F, rispetto alla media deld ispositivo di 29.5 °C / 85 F.
(+) I poggiapolsi e il touchpad sono piu' freddi della temperatura della pelle con un massimo di 25.8 °C / 78.4 F e sono quindi freddi al tatto.
(±) La temperatura media della zona del palmo della mano di dispositivi simili e'stata di 27.7 °C / 81.9 F (+1.9 °C / 3.5 F).
HP ProBook 455 T1B79UT analisi audio
(±) | potenza degli altiparlanti media ma buona (77.6 dB)
Bassi 100 - 315 Hz
(-) | quasi nessun basso - in media 26.8% inferiori alla media
(±) | la linearità dei bassi è media (11.8% delta rispetto alla precedente frequenza)
Medi 400 - 2000 Hz
(+) | medi bilanciati - solo only 3.6% rispetto alla media
(±) | linearità dei medi adeguata (9.7% delta rispetto alla precedente frequenza)
Alti 2 - 16 kHz
(+) | Alti bilanciati - appena 2.8% dalla media
(+) | alti lineari (6.2% delta rispetto alla precedente frequenza)
Nel complesso 100 - 16.000 Hz
(±) | la linearità complessiva del suono è media (28.1% di differenza rispetto alla media
Rispetto alla stessa classe
» 87% di tutti i dispositivi testati in questa classe è stato migliore, 3% simile, 10% peggiore
» Il migliore ha avuto un delta di 7%, medio di 22%, peggiore di 53%
Rispetto a tutti i dispositivi testati
» 82% di tutti i dispositivi testati in questa classe è stato migliore, 3% similare, 14% peggiore
» Il migliore ha avuto un delta di 4%, medio di 25%, peggiore di 134%
Apple MacBook 12 (Early 2016) 1.1 GHz analisi audio
(+) | gli altoparlanti sono relativamente potenti (83.6 dB)
Bassi 100 - 315 Hz
(±) | bassi ridotti - in media 11.3% inferiori alla media
(±) | la linearità dei bassi è media (14.2% delta rispetto alla precedente frequenza)
Medi 400 - 2000 Hz
(+) | medi bilanciati - solo only 2.4% rispetto alla media
(+) | medi lineari (5.5% delta rispetto alla precedente frequenza)
Alti 2 - 16 kHz
(+) | Alti bilanciati - appena 2% dalla media
(+) | alti lineari (4.5% delta rispetto alla precedente frequenza)
Nel complesso 100 - 16.000 Hz
(+) | suono nel complesso lineare (10.2% differenza dalla media)
Rispetto alla stessa classe
» 5% di tutti i dispositivi testati in questa classe è stato migliore, 2% simile, 93% peggiore
» Il migliore ha avuto un delta di 5%, medio di 19%, peggiore di 53%
Rispetto a tutti i dispositivi testati
» 3% di tutti i dispositivi testati in questa classe è stato migliore, 1% similare, 96% peggiore
» Il migliore ha avuto un delta di 4%, medio di 25%, peggiore di 134%
| Off / Standby | |
| Idle | |
| Sotto carico |
|
Leggenda:
min: Attualmente utilizziamo il Metrahit Energy, un multimetro digitale professionale per la misurazione della qualità della potenza e dell'energia monofase, per le nostre misurazioni. | |
| HP ProBook 455 T1B79UT A10-8700P, Radeon R6 (Carrizo), Toshiba MQ01ACF050, TN, 1366x768, 15.60 | HP 15z-ba000 A6-7310, Radeon R4 (Beema), Adata IM2S3138E-128GM-B, TN, 1366x768, 15.60 | Dell Latitude 15-3570 6200U, HD Graphics 520, Samsung CM871 MZNLF128HCHP, TN LED, 1366x768, 15.60 | Lenovo ThinkPad E560 20EV000MGE 6100U, HD Graphics 520, Western Digital WD Black Mobile 500GB (WD5000LPLX), TN LED, 1366x768, 15.60 | Lenovo Yoga 510-15IKB 80VC000XGE i5-7200U, Radeon R7 M460, Samsung MZYTY256HDHP, IPS, 1920x1080, 15.60 | |
|---|---|---|---|---|---|
| Power Consumption | 29% | 23% | 23% | 9% | |
| Idle Minimum * | 5.9 | 5.22 12% | 4.9 17% | 5.2 12% | 3.9 34% |
| Idle Average * | 8.2 | 5.67 31% | 7.2 12% | 7.25 12% | 7.8 5% |
| Idle Maximum * | 9.9 | 7.82 21% | 7.5 24% | 7.9 20% | 8.4 15% |
| Load Average * | 37.5 | 19.67 48% | 25.4 32% | 25.1 33% | 37 1% |
| Load Maximum * | 41 | 26.72 35% | 28 32% | 25.1 39% | 46 -12% |
* ... Meglio usare valori piccoli
| HP ProBook 455 T1B79UT A10-8700P, Radeon R6 (Carrizo), 44 Wh | HP 15z-ba000 A6-7310, Radeon R4 (Beema), 31 Wh | Dell Latitude 15-3570 6200U, HD Graphics 520, 65 Wh | Lenovo ThinkPad E560 20EV000MGE 6100U, HD Graphics 520, 48 Wh | Lenovo Yoga 510-15IKB 80VC000XGE i5-7200U, Radeon R7 M460, 35 Wh | |
|---|---|---|---|---|---|
| Autonomia della batteria | 23% | 116% | 111% | 33% | |
| Reader / Idle | 572 | 511 -11% | 1024 79% | 885 55% | |
| WiFi v1.3 | 240 | 247 3% | 542 126% | 566 136% | 320 33% |
| Load | 65 | 115 77% | 157 142% | 157 142% |
Pro
Contro
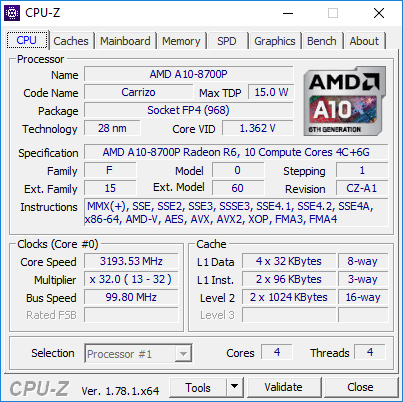
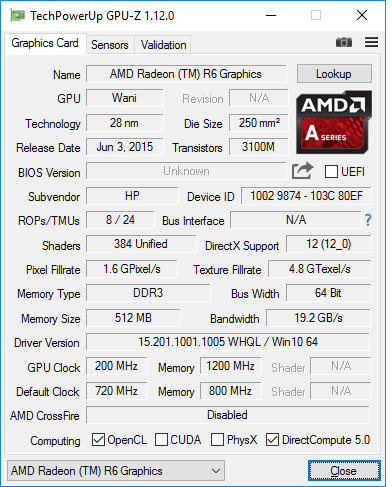
La piattaforma AMD Carrizo per portatili dovrebbe essere molto versatile con il suo thermal design power configurabile. Le sue performance tuttavia, sono nettamente inferiori rispetto alle tre vecchie generazioni di Core i5-4200U. La GPU Radeon R6 integrata ha lo stesso risultato rispetto alle comuni HD Graphics 520 o HD Graphics 5500 che si trovano sui vecchi hardware Intel.
La perdita di performance di AMD sarebbe stata accettabile se il ProBook 455 fosse stato significativamente più silenzioso visti i risultati, ma non è questo il caso. Le temperature di superficie non sono inferiori e l'autonomia è anche sotto i livelli attesi.
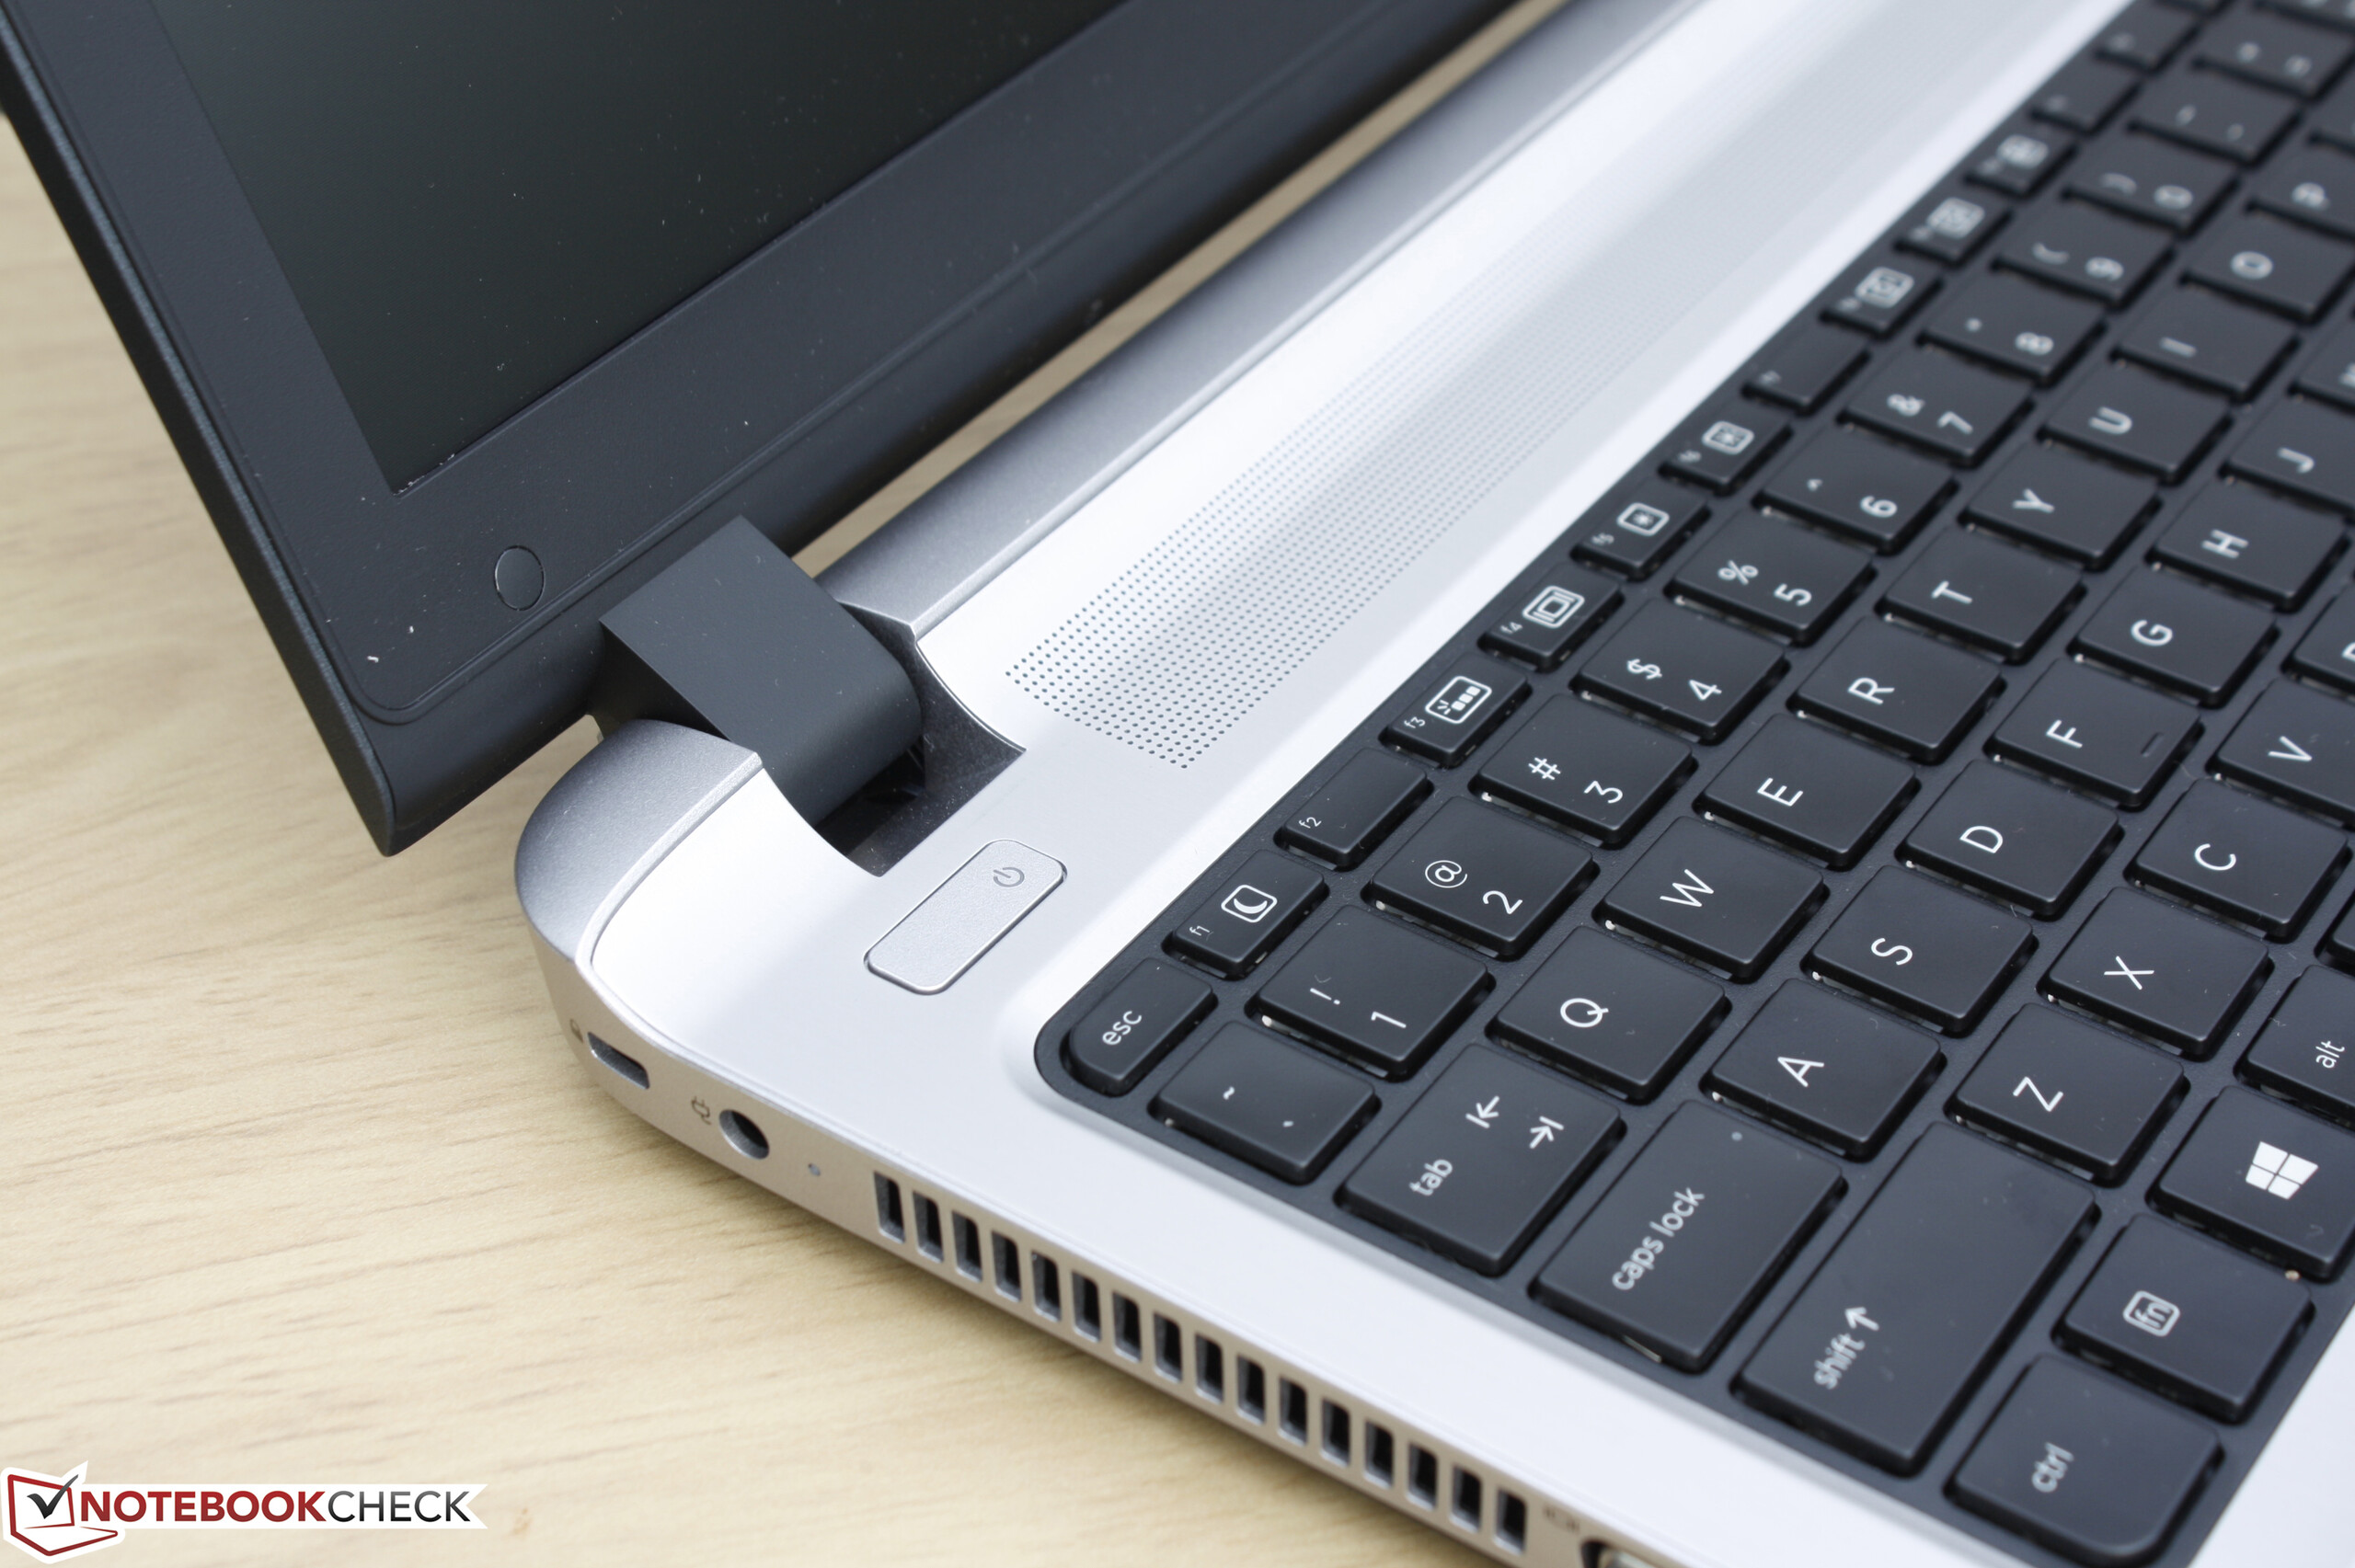
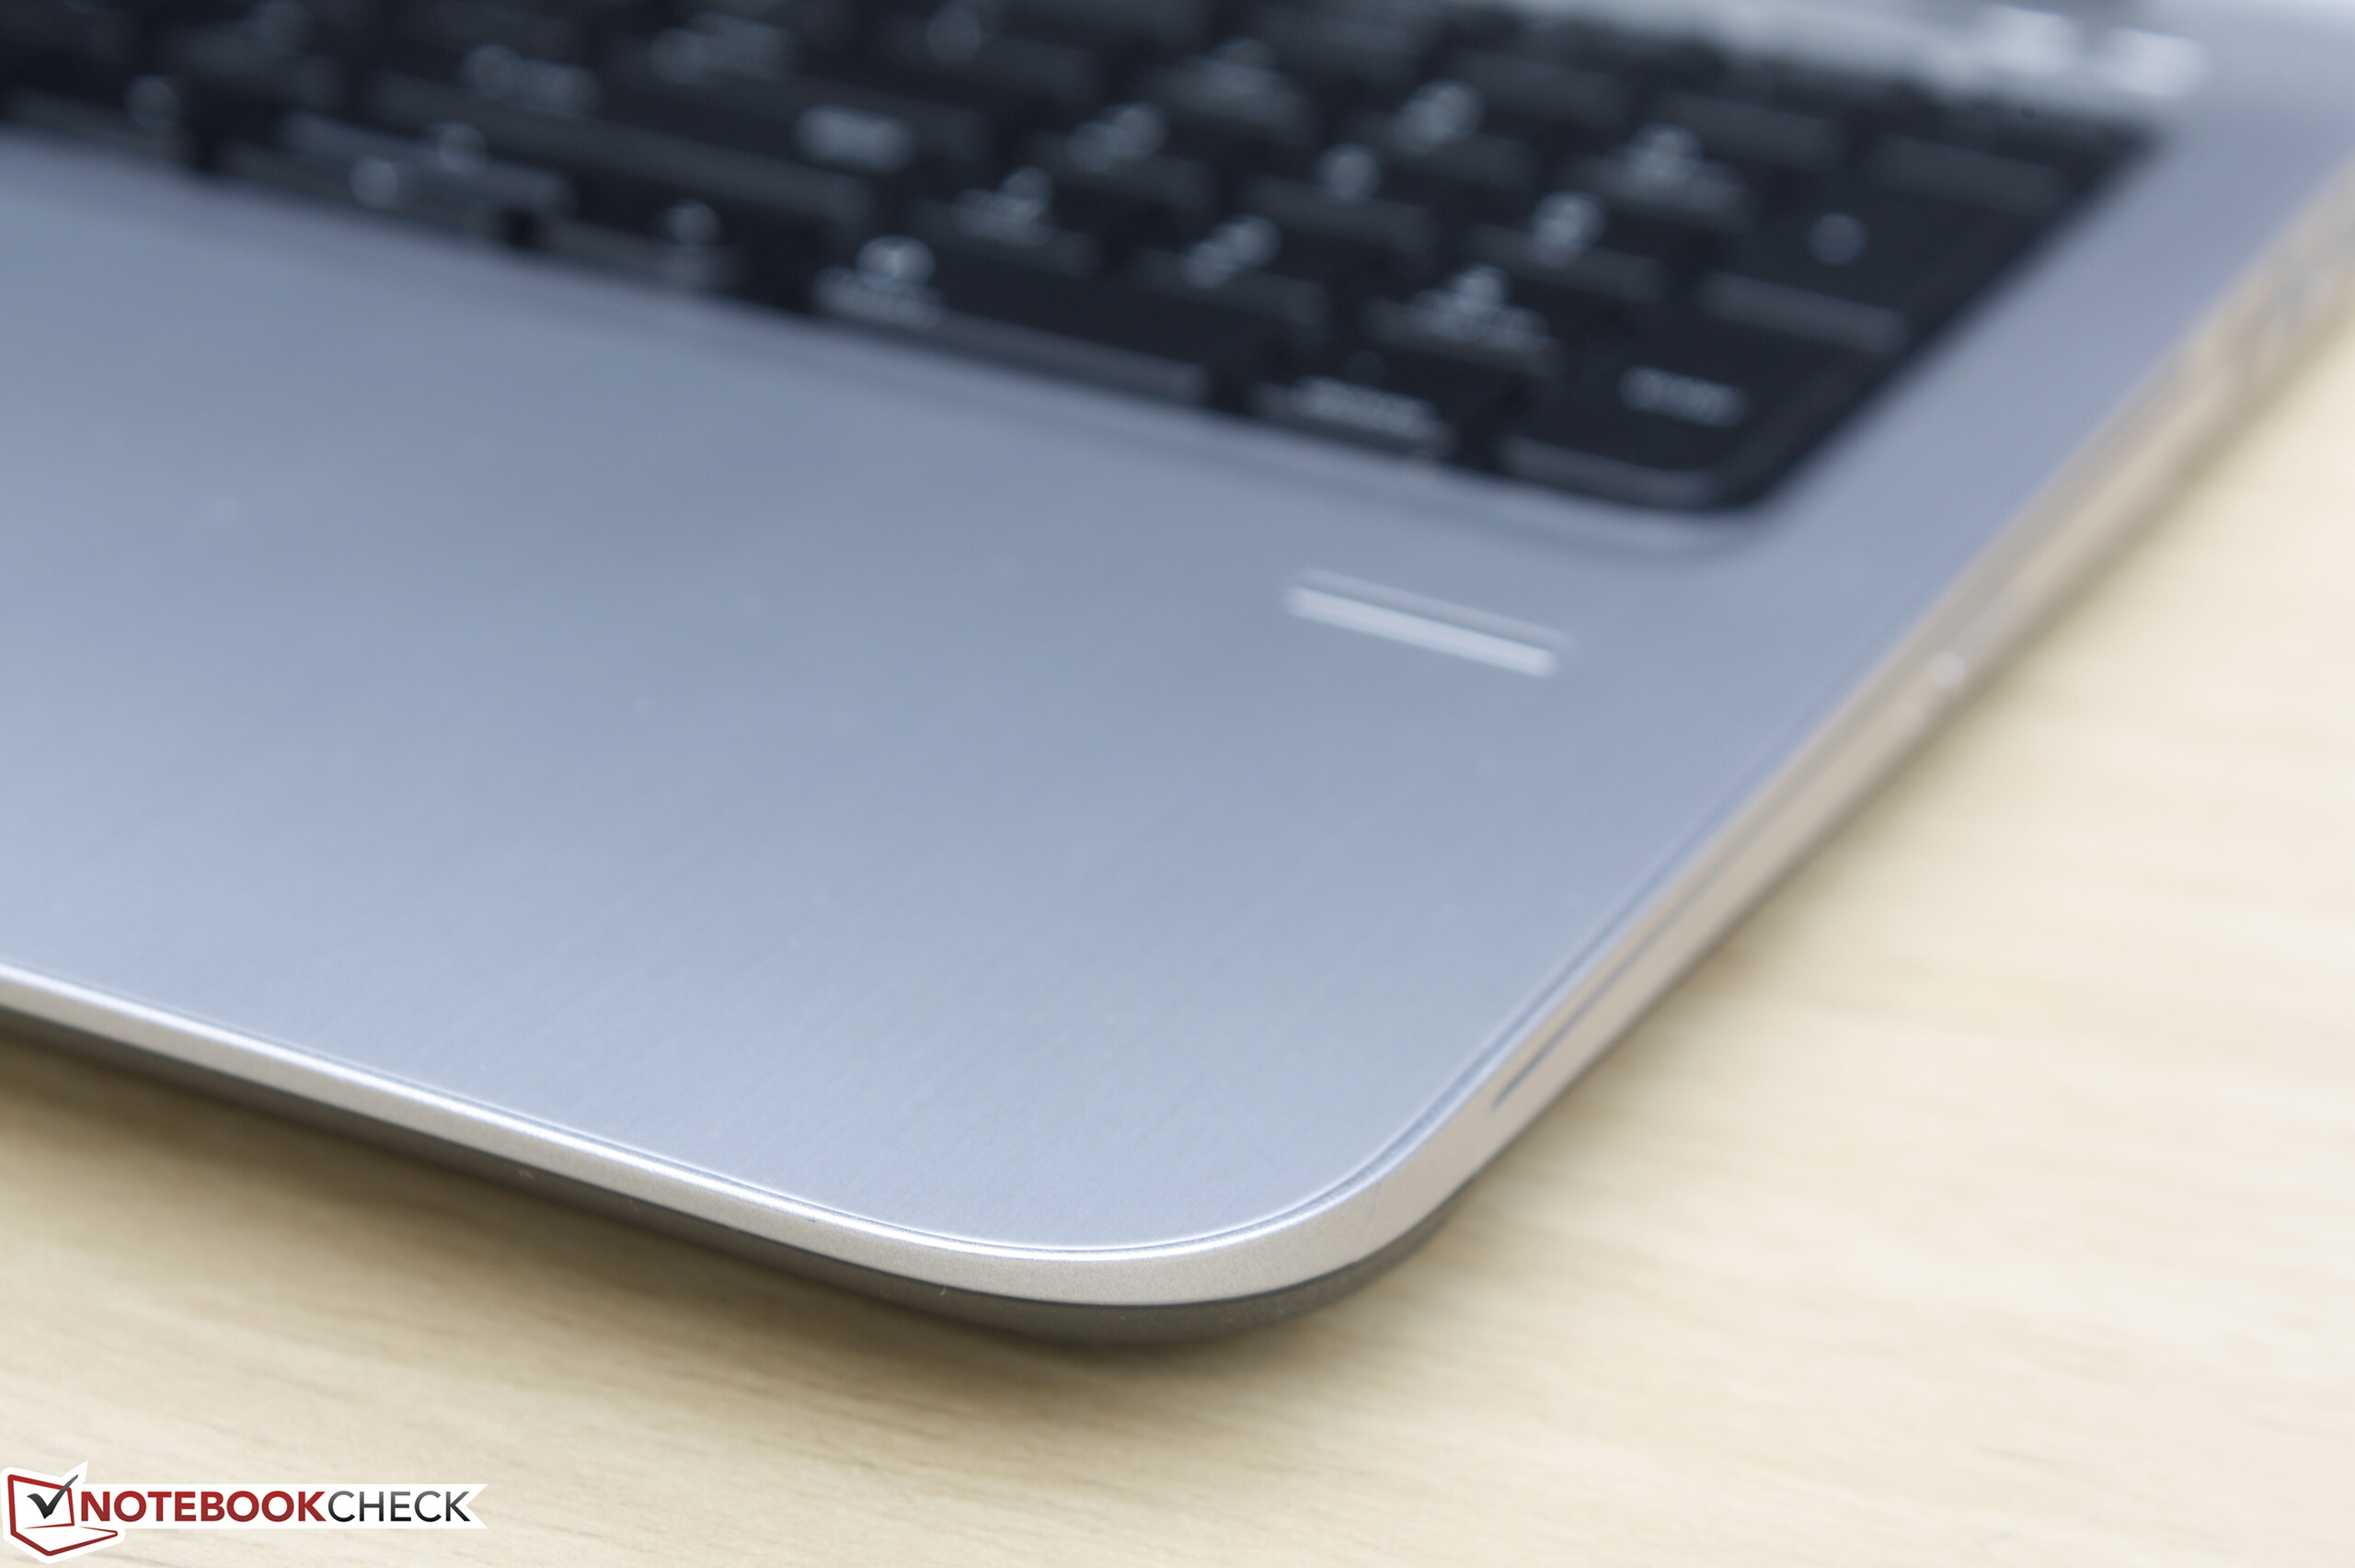
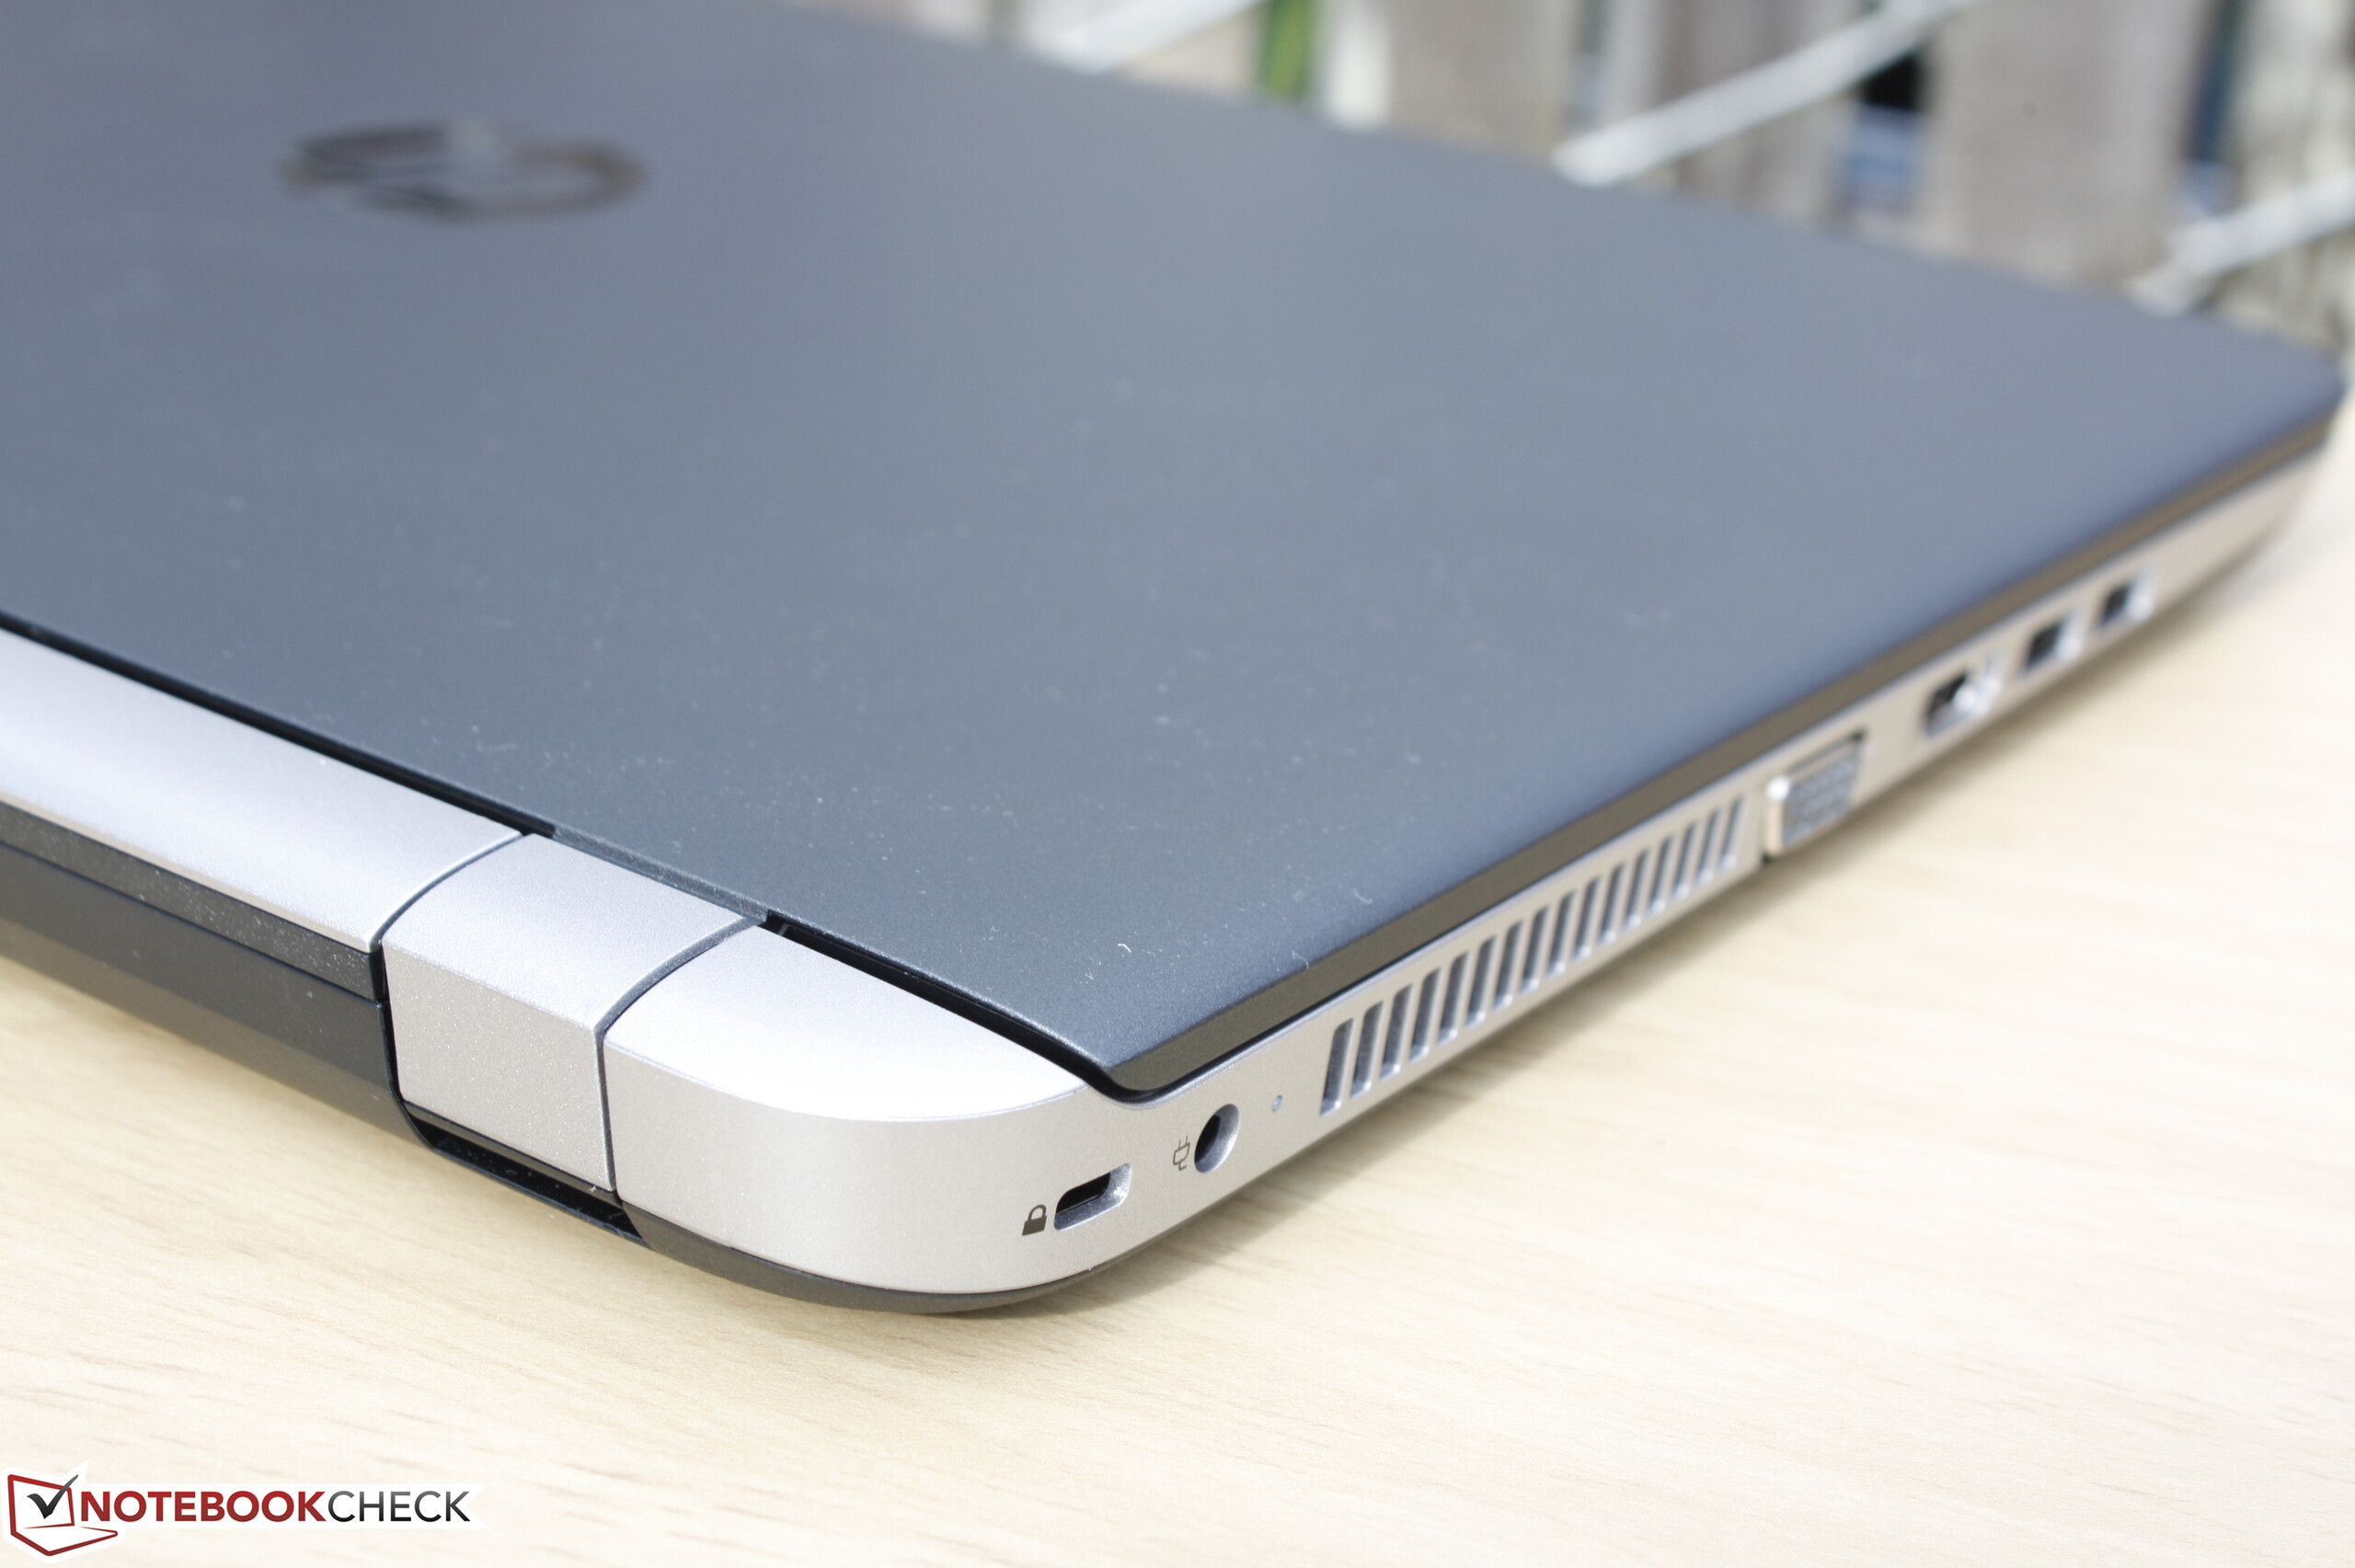
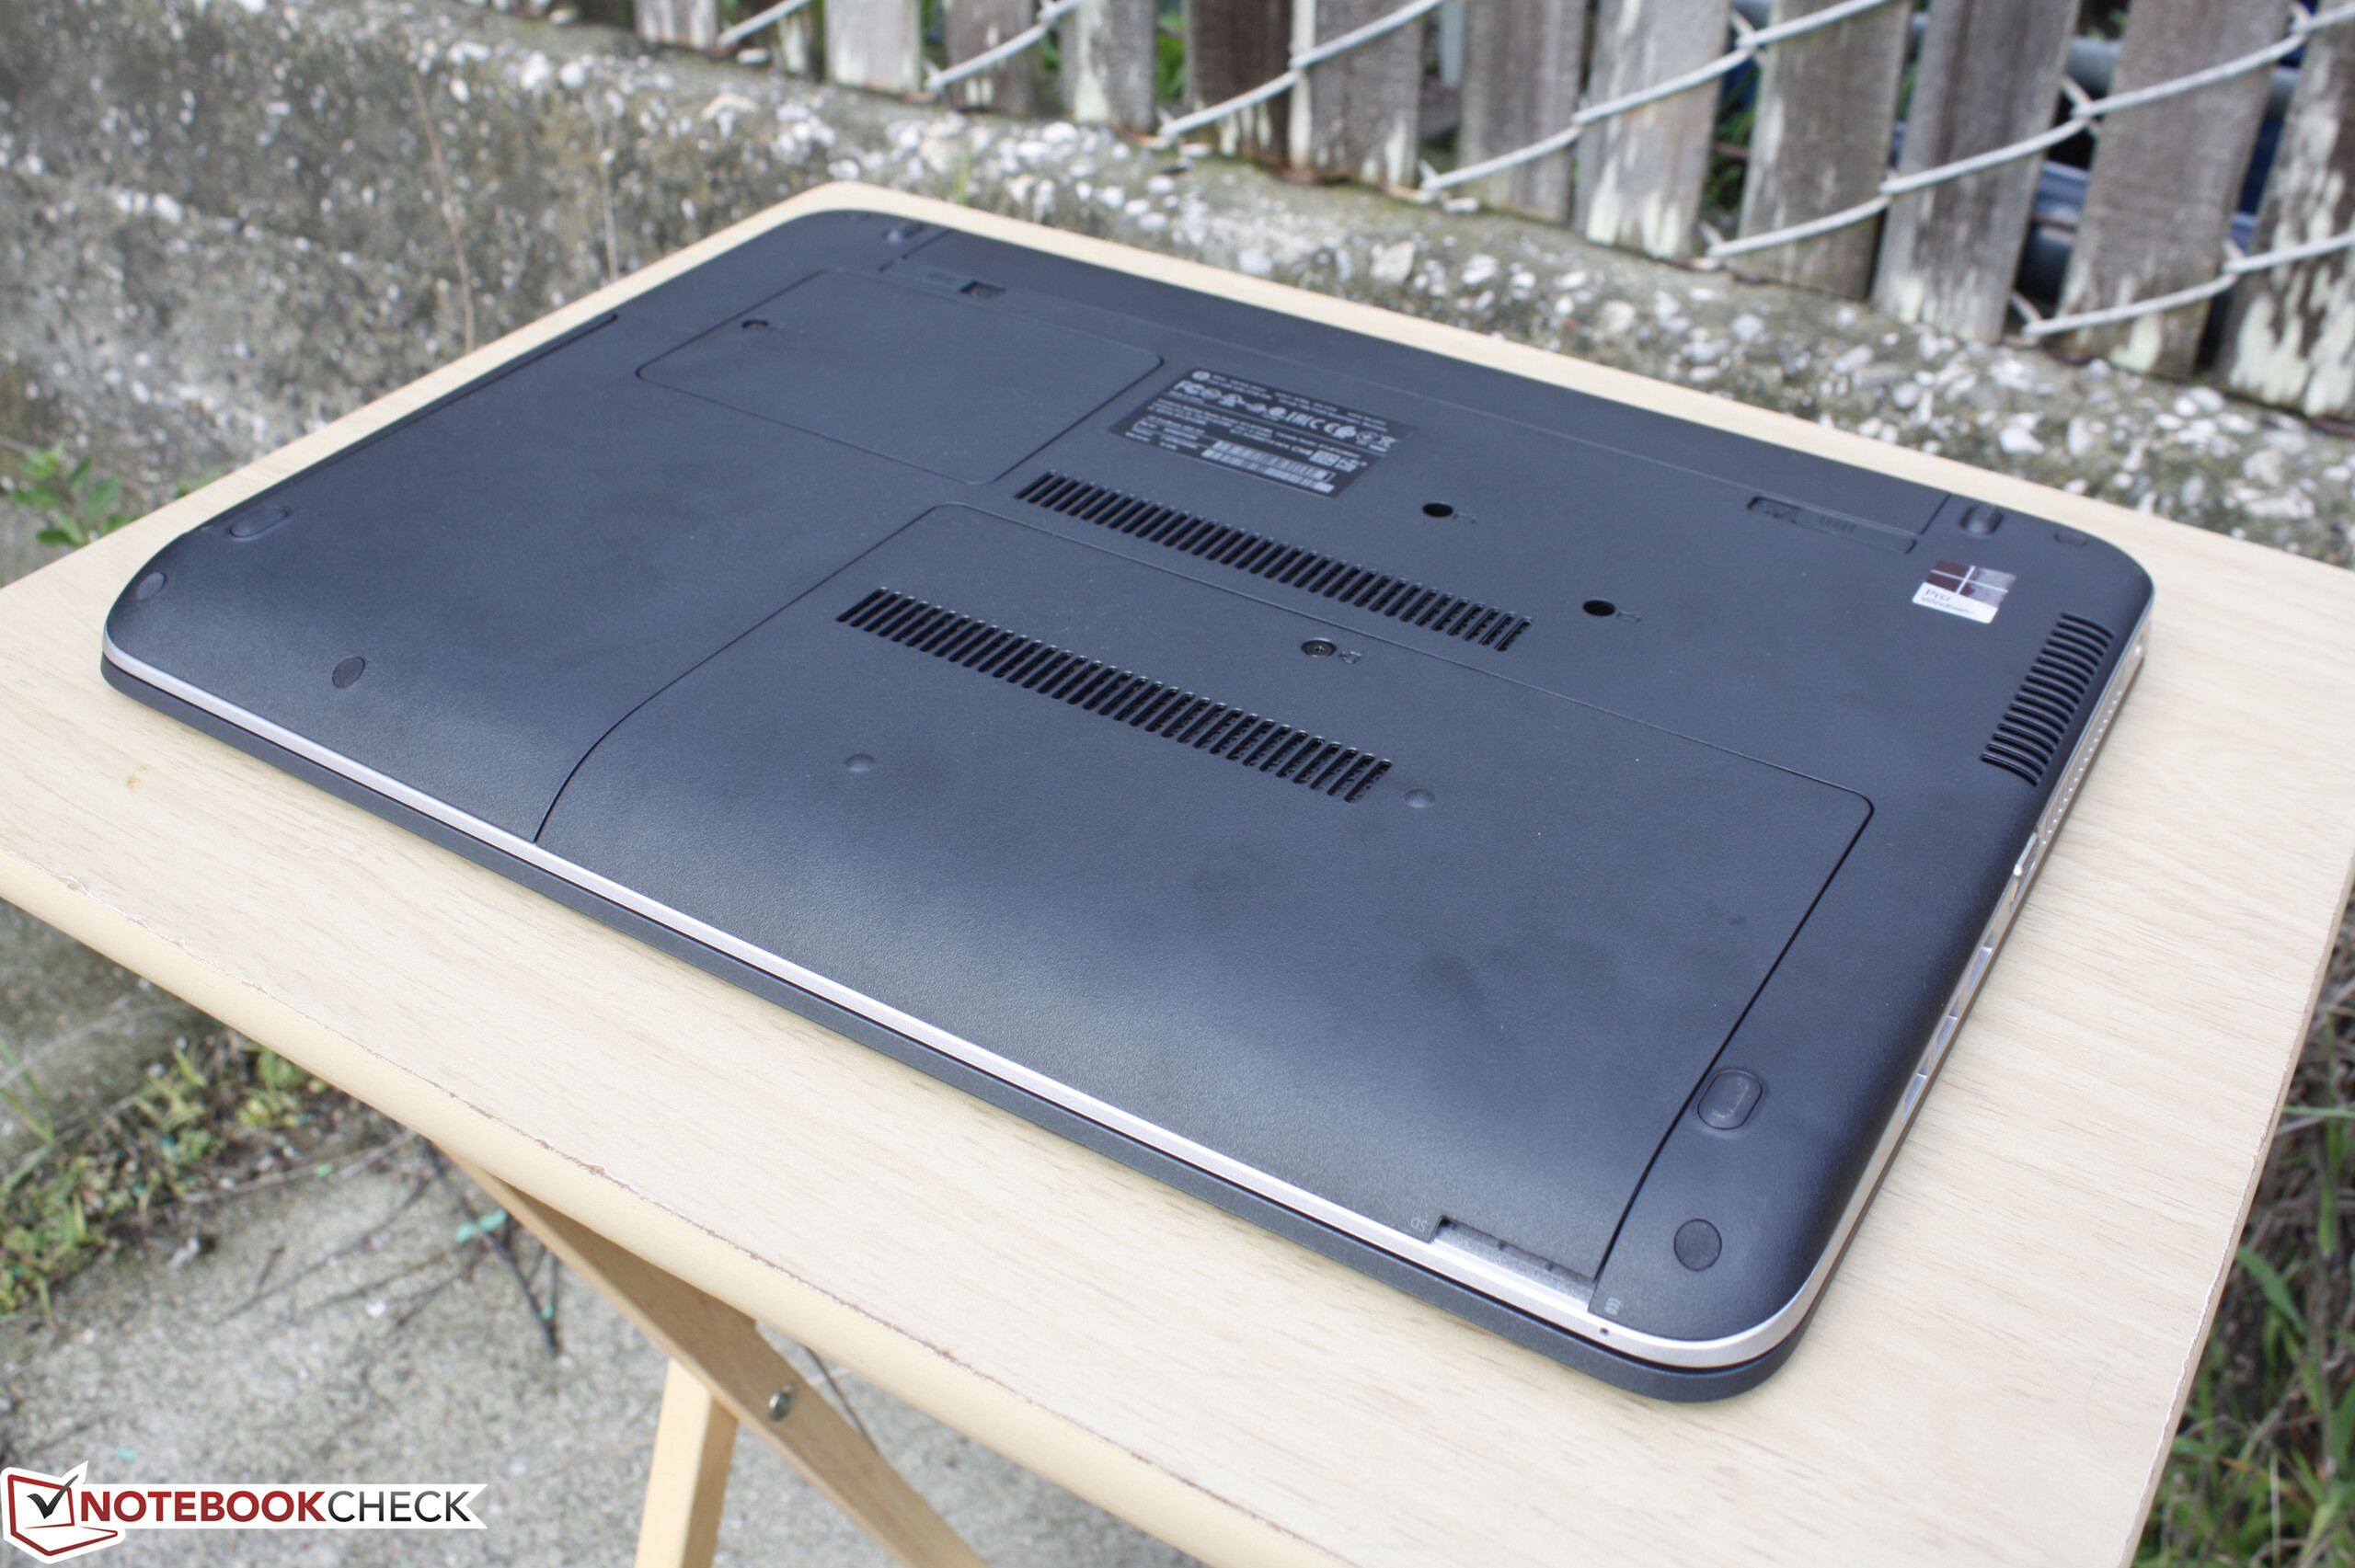
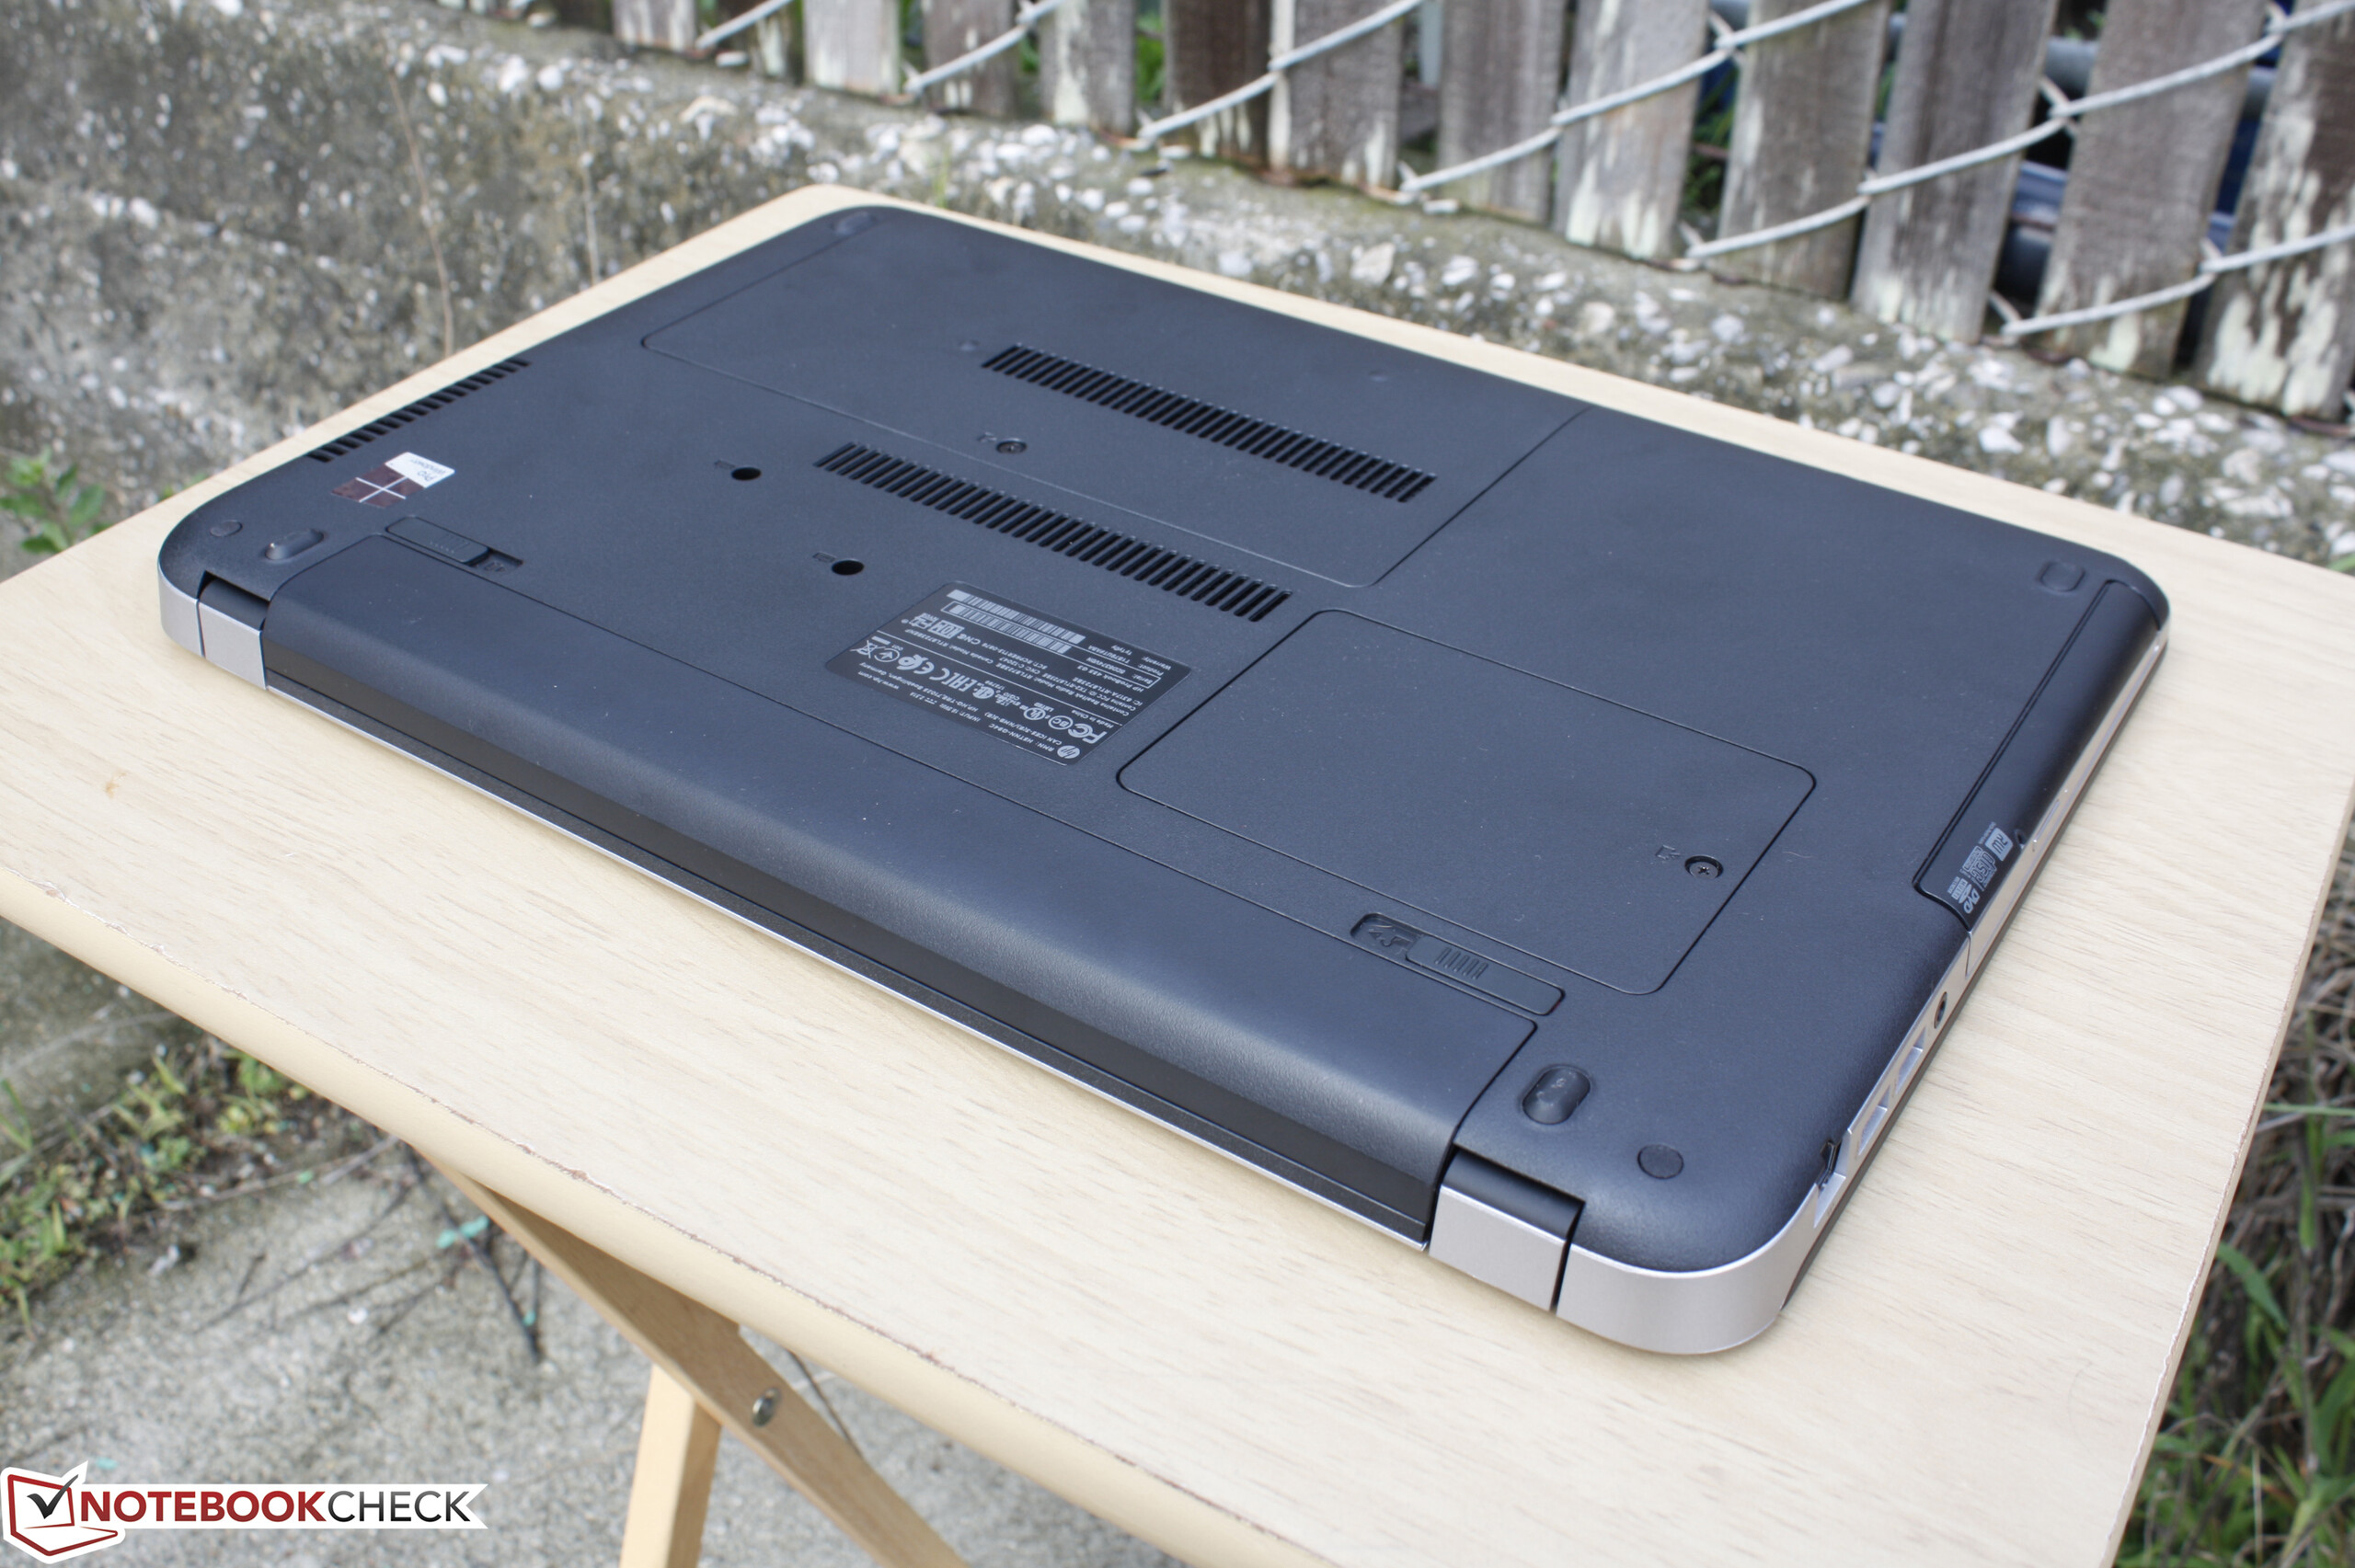
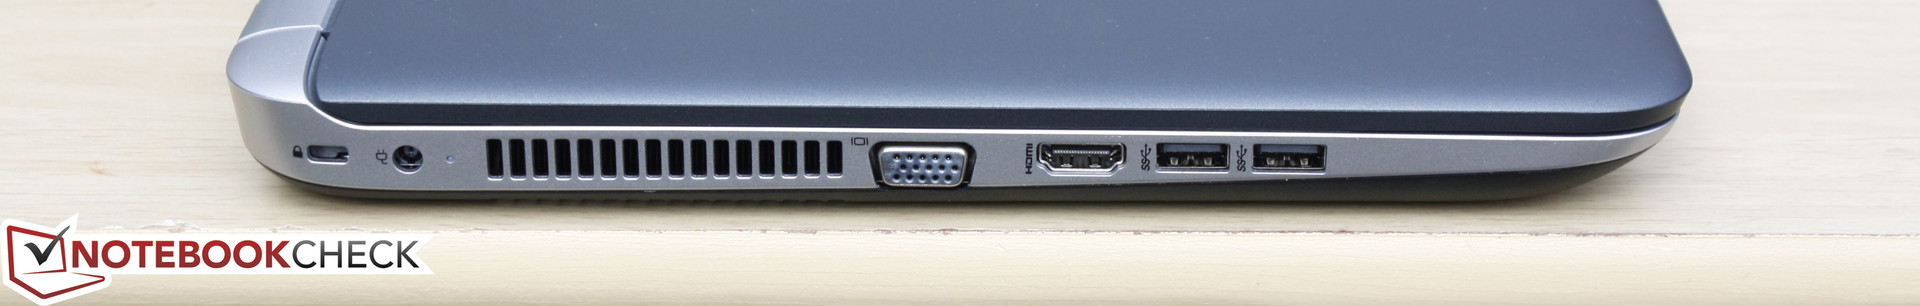
A parte il processore, il ProBook 455 si comporta bene come altri barebones senza grosse pretese. Apprezziamo sia il concept che il design e speriamo che future revisioni aggiungano alcune funzionalità all'hardware incluse USB Type-C e TrackPoint.
E' difficile raccomandare il Carrizo SKU quando le vecchie opzioni Intel Core ix superano di molto quello che ha da offrire AMD con l'attuale generazione.
Nota: si tratta di una recensione breve, con alcune sezioni non tradotte, per la versione integrale in inglese guardate qui.
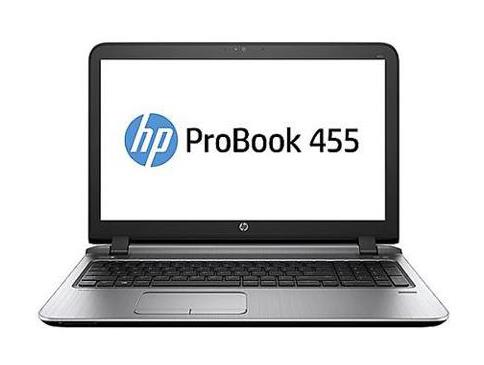
HP ProBook 455 T1B79UT
-
12/15/2016 v6(old)
Allen Ngo
Pricecompare
