 Deutsch
 English
 Español
 Français
 Italiano
 Nederlands
 Polski
 Português
 Русский
 Türkçe
 Svenska
 Chinese
 Magyar
Recensione breve del Portatile EVGA SC17 GTX 1070


| Networking | |
| iperf3 transmit AX12 | |
| EVGA SC17 GTX 1070 | |
| iperf3 receive AX12 | |
| EVGA SC17 GTX 1070 | |
| |||||||||||||||||||||||||
Distribuzione della luminosità: 81 %
Al centro con la batteria: 399.1 cd/m²
Contrasto: 998:1 (Nero: 0.4 cd/m²)
ΔE Color 4.78 | 0.5-29.43 Ø5
ΔE Greyscale 3.8 | 0.57-98 Ø5.3
100% sRGB (Argyll 1.6.3 3D)
86.9% AdobeRGB 1998 (Argyll 1.6.3 3D)
98.8% AdobeRGB 1998 (Argyll 2.2.0 3D)
100% sRGB (Argyll 2.2.0 3D)
87.3% Display P3 (Argyll 2.2.0 3D)
Gamma: 2.03
| EVGA SC17 GTX 1070 Sharp LQ173D1JW31, IPS, 17.30, 3840x2160 | Aorus X7 v6 B173QTN01.0 (AUO1096), TN LED, 17.30, 2560x1440 | MSI GT73VR 6RF IPS, 17.30, 3840x2160 | Eurocom Sky X7E2 IPS, 17.30, 3840x2160 | HP Omen 17-w110ng LG Philips LGD046E, IPS, 17.30, 1920x1080 | |
|---|---|---|---|---|---|
| Display | -28% | -22% | -0% | -26% | |
| Display P3 Coverage | 87.3 | 60.9 -30% | 63.6 -27% | 86.6 -1% | 66.6 -24% |
| sRGB Coverage | 100 | 84.2 -16% | 95.8 -4% | 100 0% | 84.1 -16% |
| AdobeRGB 1998 Coverage | 98.8 | 61.2 -38% | 65.7 -34% | 99.2 0% | 61.5 -38% |
| Response Times | 52% | 21% | 40% | 26% | |
| Response Time Grey 50% / Grey 80% * | 45.6 ? | 31 ? 32% | 33.6 ? 26% | 28 ? 39% | 37 ? 19% |
| Response Time Black / White * | 35.2 ? | 10 ? 72% | 30 ? 15% | 21.2 ? 40% | 24 ? 32% |
| PWM Frequency | 1042 ? | ||||
| Screen | -33% | -12% | -9% | -3% | |
| Brightness middle | 399.1 | 343 -14% | 334.8 -16% | 332.6 -17% | 362 -9% |
| Brightness | 360 | 312 -13% | 316 -12% | 329 -9% | 342 -5% |
| Brightness Distribution | 81 | 80 -1% | 87 7% | 87 7% | 87 7% |
| Black Level * | 0.4 | 0.5 -25% | 0.422 -6% | 0.314 21% | 0.31 22% |
| Contrast | 998 | 686 -31% | 793 -21% | 1059 6% | 1168 17% |
| Colorchecker dE 2000 * | 4.78 | 7.33 -53% | 4.11 14% | 5.94 -24% | 4.5 6% |
| Colorchecker dE 2000 max. * | 7.65 | 10.79 -41% | 7.8 -2% | 8.6 -12% | 9.31 -22% |
| Greyscale dE 2000 * | 3.8 | 7.6 -100% | 5.74 -51% | 6.27 -65% | 3.48 8% |
| Gamma | 2.03 108% | 2.19 100% | 2.3 96% | 2.2 100% | 2.23 99% |
| CCT | 7288 89% | 9024 72% | 5987 109% | 6704 97% | 6144 106% |
| Color Space (Percent of AdobeRGB 1998) | 86.9 | 55 -37% | 60.5 -30% | 91 5% | 55 -37% |
| Color Space (Percent of sRGB) | 100 | 84 -16% | 96 -4% | 100 0% | 84 -16% |
| Media totale (Programma / Settaggio) | -3% /
-21% | -4% /
-10% | 10% /
-1% | -1% /
-4% |
* ... Meglio usare valori piccoli
Tempi di risposta del Display
| ↔ Tempi di risposta dal Nero al Bianco | ||
|---|---|---|
| 35.2 ms ... aumenta ↗ e diminuisce ↘ combinato | ↗ 9.2 ms Incremento | 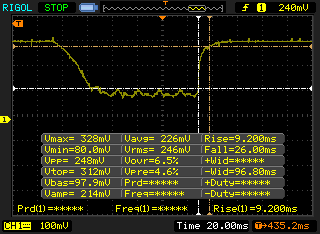 |
| ↘ 26 ms Calo | ||
| Lo schermo mostra tempi di risposta lenti nei nostri tests e sarà insoddisfacente per i gamers. In confronto, tutti i dispositivi di test variano da 0.1 (minimo) a 240 (massimo) ms. » 92 % di tutti i dispositivi è migliore. Questo significa che i tempi di risposta rilevati sono peggiori rispetto alla media di tutti i dispositivi testati (21.5 ms). | ||
| ↔ Tempo di risposta dal 50% Grigio all'80% Grigio | ||
| 45.6 ms ... aumenta ↗ e diminuisce ↘ combinato | ↗ 22.8 ms Incremento | 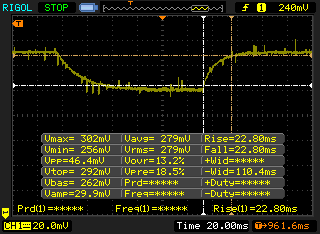 |
| ↘ 22.8 ms Calo | ||
| Lo schermo mostra tempi di risposta lenti nei nostri tests e sarà insoddisfacente per i gamers. In confronto, tutti i dispositivi di test variano da 0.2 (minimo) a 636 (massimo) ms. » 75 % di tutti i dispositivi è migliore. Questo significa che i tempi di risposta rilevati sono peggiori rispetto alla media di tutti i dispositivi testati (33.7 ms). | ||
Sfarfallio dello schermo / PWM (Pulse-Width Modulation)
| flickering dello schermo / PWM rilevato | 1042 Hz | ≤ 29 % settaggio luminosita' | 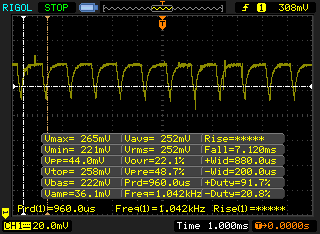 |
Il display sfarfalla a 1042 Hz (Probabilmente a causa dell'uso di PWM) Flickering rilevato ad una luminosita' di 29 % o inferiore. Non dovrebbe verificarsi flickering o PWM sopra questo valore di luminosita'. La frequenza di 1042 Hz è abbastanza alta, quindi la maggioranza degli utenti sensibili al PWM non dovrebbero notare alcun flickering. In confronto: 53 % di tutti i dispositivi testati non utilizza PWM per ridurre la luminosita' del display. Se è rilevato PWM, una media di 17915 (minimo: 5 - massimo: 3846000) Hz è stata rilevata. | |||
| Cinebench R15 | |
| CPU Single 64Bit | |
| MSI GT73VR 6RF | |
| Eurocom Sky X7E2 | |
| EVGA SC17 GTX 1070 | |
| MSI GE62 2QC-468XPL | |
| Asus R510JX-DM149H | |
| Toshiba Satellite S70-B-106 | |
| CPU Multi 64Bit | |
| Eurocom Sky X7E2 | |
| MSI GT73VR 6RF | |
| MSI GE62 2QC-468XPL | |
| EVGA SC17 GTX 1070 | |
| Asus R510JX-DM149H | |
| Toshiba Satellite S70-B-106 | |
| Cinebench R11.5 | |
| CPU Single 64Bit | |
| MSI GT73VR 6RF | |
| Eurocom Sky X7E2 | |
| MSI GE62 2QC-468XPL | |
| EVGA SC17 GTX 1070 | |
| Toshiba Satellite S70-B-106 | |
| CPU Multi 64Bit | |
| MSI GT73VR 6RF | |
| Eurocom Sky X7E2 | |
| MSI GE62 2QC-468XPL | |
| EVGA SC17 GTX 1070 | |
| Toshiba Satellite S70-B-106 | |
| Cinebench R10 | |
| Rendering Multiple CPUs 32Bit | |
| MSI GT73VR 6RF | |
| Eurocom Sky X7E2 | |
| MSI GE62 2QC-468XPL | |
| EVGA SC17 GTX 1070 | |
| Rendering Single 32Bit | |
| Eurocom Sky X7E2 | |
| MSI GT73VR 6RF | |
| EVGA SC17 GTX 1070 | |
| MSI GE62 2QC-468XPL | |
| wPrime 2.10 - 1024m | |
| Asus R510JX-DM149H | |
| EVGA SC17 GTX 1070 | |
| MSI GE62 2QC-468XPL | |
| Eurocom Sky X7E2 | |
| Super Pi Mod 1.5 XS 32M - 32M | |
| MSI GE62 2QC-468XPL | |
| EVGA SC17 GTX 1070 | |
| Asus R510JX-DM149H | |
| Eurocom Sky X7E2 | |
* ... Meglio usare valori piccoli
| PCMark 8 | |
| Home Score Accelerated v2 | |
| HP Omen 17-w110ng | |
| Eurocom Sky X7E2 | |
| EVGA SC17 GTX 1070 | |
| MSI GT73VR 6RF | |
| EVGA SC17 | |
| Work Score Accelerated v2 | |
| HP Omen 17-w110ng | |
| Eurocom Sky X7E2 | |
| EVGA SC17 GTX 1070 | |
| MSI GT73VR 6RF | |
| EVGA SC17 | |
| Creative Score Accelerated v2 | |
| Eurocom Sky X7E2 | |
| MSI GT73VR 6RF | |
| EVGA SC17 GTX 1070 | |
| HP Omen 17-w110ng | |
| EVGA SC17 | |
| PCMark 8 Home Score Accelerated v2 | 4437 punti | |
| PCMark 8 Creative Score Accelerated v2 | 7780 punti | |
| PCMark 8 Work Score Accelerated v2 | 4623 punti | |
Aiuto | ||
| EVGA SC17 GTX 1070 Samsung SM951 MZVPV256 m.2 | Aorus X7 v6 Toshiba NVMe THNSN5512GPU7 | MSI GT73VR 6RF 2x SanDisk X400 1TB M.2 SD8SN8U1T001122 (RAID 0) | Eurocom Sky X7E2 Samsung SM951 MZVPV512HDGL m.2 PCI-e | HP Omen 17-w110ng Samsung PM951 NVMe MZVLV256 | |
|---|---|---|---|---|---|
| CrystalDiskMark 3.0 | 4% | -30% | 11% | -32% | |
| Read Seq | 1658 | 1499 -10% | 914 -45% | 1673 1% | 1156 -30% |
| Write Seq | 1249 | 1411 13% | 916 -27% | 1576 26% | 294.9 -76% |
| Read 512 | 1044 | 966 -7% | 698 -33% | 1180 13% | 616 -41% |
| Write 512 | 1254 | 1103 -12% | 916 -27% | 1561 24% | 294.7 -76% |
| Read 4k | 51.6 | 44.33 -14% | 31.37 -39% | 51.5 0% | 42.7 -17% |
| Write 4k | 145.2 | 155.5 7% | 65.7 -55% | 144 -1% | 153.3 6% |
| Read 4k QD32 | 601 | 696 16% | 425 -29% | 694 15% | 600 0% |
| Write 4k QD32 | 386.8 | 531 37% | 441.8 14% | 422.1 9% | 295.3 -24% |

| 3DMark | |
| 3840x2160 Fire Strike Ultra Graphics | |
| Nvidia GeForce GTX 1080 Founders Edition | |
| Nvidia GeForce GTX 1070 Founders Edition | |
| EVGA SC17 GTX 1070 | |
| Asus G701VO-CS74K | |
| MSI GT72VR 6RD-063US | |
| EVGA SC17 | |
| Fire Strike Extreme Graphics | |
| Nvidia GeForce GTX 1080 Founders Edition | |
| EVGA SC17 GTX 1070 | |
| Asus G701VO-CS74K | |
| MSI GT72VR 6RD-063US | |
| EVGA SC17 | |
| 1920x1080 Fire Strike Graphics | |
| Nvidia GeForce GTX 1080 Founders Edition | |
| MSI GT80-2QES32SR311BW | |
| EVGA SC17 GTX 1070 | |
| Nvidia GeForce GTX 1070 Founders Edition | |
| Asus G701VO-CS74K | |
| MSI GT72VR 6RD-063US | |
| EVGA SC17 | |
| 3DMark 11 | |
| 1280x720 Performance GPU | |
| Nvidia GeForce GTX 1080 Founders Edition | |
| Nvidia GeForce GTX 1070 Founders Edition | |
| EVGA SC17 GTX 1070 | |
| MSI GT80-2QES32SR311BW | |
| Asus G701VO-CS74K | |
| EVGA SC17 | |
| MSI GT72VR 6RD-063US | |
| 1280x720 Performance Combined | |
| Nvidia GeForce GTX 1080 Founders Edition | |
| Nvidia GeForce GTX 1070 Founders Edition | |
| MSI GT80-2QES32SR311BW | |
| EVGA SC17 GTX 1070 | |
| EVGA SC17 | |
| Asus G701VO-CS74K | |
| MSI GT72VR 6RD-063US | |
| 3DMark 11 Performance | 16824 punti | |
| 3DMark Ice Storm Standard Score | 136715 punti | |
| 3DMark Cloud Gate Standard Score | 26217 punti | |
| 3DMark Fire Strike Score | 13287 punti | |
| 3DMark Fire Strike Extreme Score | 7357 punti | |
Aiuto | ||
| Rise of the Tomb Raider | |
| 1920x1080 Very High Preset AA:FX AF:16x | |
| Aorus X5 v6 | |
| EVGA SC17 GTX 1070 | |
| MSI GT72VR 6RD-063US | |
| Asus G701VO-CS74K | |
| Asus Strix GL502VY-DS71 | |
| Asus Strix GL502VT-DS74 | |
| 3840x2160 High Preset AA:FX AF:4x | |
| MSI GT73VR 6RF | |
| EVGA SC17 GTX 1070 | |
| Guild Wars 2 - 1920x1080 All Maximum / On AA:FX | |
| Aorus X5 v6 | |
| EVGA SC17 GTX 1070 | |
| MSI GT72VR 6RD-063US | |
| BioShock Infinite - 1920x1080 Ultra Preset, DX11 (DDOF) | |
| Aorus X5 v6 | |
| EVGA SC17 GTX 1070 | |
| Asus G701VO-CS74K | |
| MSI GT72VR 6RD-063US | |
| Asus Strix GL502VY-DS71 | |
| Asus Strix GL502VT-DS74 | |
| Metro: Last Light - 1920x1080 Very High (DX11) AF:16x | |
| Aorus X5 v6 | |
| EVGA SC17 GTX 1070 | |
| Asus G701VO-CS74K | |
| MSI GT72VR 6RD-063US | |
| Asus Strix GL502VT-DS74 | |
| Thief - 1920x1080 Very High Preset AA:FXAA & High SS AF:8x | |
| Aorus X5 v6 | |
| EVGA SC17 GTX 1070 | |
| MSI GT72VR 6RD-063US | |
| Asus G701VO-CS74K | |
| Asus Strix GL502VY-DS71 | |
| Asus Strix GL502VT-DS74 | |
| Batman: Arkham Knight | |
| 1920x1080 High / On AA:SM AF:16x | |
| Aorus X5 v6 | |
| EVGA SC17 GTX 1070 | |
| Asus G701VO-CS74K | |
| MSI GT72VR 6RD-063US | |
| Asus Strix GL502VT-DS74 | |
| 3840x2160 High / On (Interactive Smoke & Paper Debris Off) AA:SM AF:8x | |
| MSI GT73VR 6RF | |
| EVGA SC17 GTX 1070 | |
| Fallout 4 | |
| 1920x1080 Ultra Preset AA:T AF:16x | |
| Aorus X5 v6 | |
| EVGA SC17 GTX 1070 | |
| Asus G701VO-CS74K | |
| MSI GT72VR 6RD-063US | |
| Asus Strix GL502VY-DS71 | |
| Asus Strix GL502VT-DS74 | |
| 3840x2160 High Preset AA:T AF:16x | |
| MSI GT73VR 6RF | |
| EVGA SC17 GTX 1070 | |
| Doom | |
| 1920x1080 Ultra Preset AA:SM | |
| Aorus X5 v6 | |
| EVGA SC17 GTX 1070 | |
| MSI GT72VR 6RD-063US | |
| Asus G701VO-CS74K | |
| Asus Strix GL502VY-DS71 | |
| 3840x2160 High Preset AA:FX | |
| MSI GT73VR 6RF | |
| EVGA SC17 GTX 1070 | |
| Overwatch - 3840x2160 High (Render Scale 100 %) AA:SM AF:4x | |
| MSI GT73VR 6RF | |
| EVGA SC17 GTX 1070 | |
| Mafia 3 | |
| 1920x1080 High Preset | |
| MSI GT73VR 6RF | |
| EVGA SC17 GTX 1070 | |
| 3840x2160 High Preset | |
| EVGA SC17 GTX 1070 | |
| basso | medio | alto | ultra | 4K | |
| Guild Wars 2 (2012) | 63.9 | ||||
| BioShock Infinite (2013) | 131.8 | ||||
| Metro: Last Light (2013) | 114 | ||||
| Thief (2014) | 103.2 | ||||
| Batman: Arkham Knight (2015) | 87 | 45 | |||
| Metal Gear Solid V (2015) | 60 | 60 | |||
| Fallout 4 (2015) | 102.9 | 44.3 | |||
| Rise of the Tomb Raider (2016) | 96.4 | 40.6 | |||
| Doom (2016) | 118.8 | 50.6 | |||
| Overwatch (2016) | 83.5 | ||||
| Mafia 3 (2016) | 62 | 22.1 |
Rumorosità
| Idle |
| 33.9 / 33.9 / 33.9 dB(A) |
| Sotto carico |
| 43.8 / 53.4 dB(A) |
 | ||
30 dB silenzioso 40 dB(A) udibile 50 dB(A) rumoroso |
||
min: | ||
| EVGA SC17 GTX 1070 GeForce GTX 1070 Mobile, 6820HK, Samsung SM951 MZVPV256 m.2 | Aorus X7 v6 GeForce GTX 1070 Mobile, 6820HK, Toshiba NVMe THNSN5512GPU7 | MSI GT73VR 6RF GeForce GTX 1080 Mobile, 6820HK, 2x SanDisk X400 1TB M.2 SD8SN8U1T001122 (RAID 0) | Eurocom Sky X7E2 GeForce GTX 1080 Mobile, 6700K, Samsung SM951 MZVPV512HDGL m.2 PCI-e | HP Omen 17-w110ng GeForce GTX 1070 Mobile, 6700HQ, Samsung PM951 NVMe MZVLV256 | EVGA SC17 GeForce GTX 980M, 6820HK, Samsung SSD 950 Pro 512GB m.2 NVMe | |
|---|---|---|---|---|---|---|
| Noise | -3% | -4% | 1% | -1% | 4% | |
| off /ambiente * | 29.2 | 30 -3% | 29.2 -0% | 28.9 1% | 30 -3% | 29.1 -0% |
| Idle Minimum * | 33.9 | 33 3% | 32 6% | 28.9 15% | 33 3% | 33 3% |
| Idle Average * | 33.9 | 35 -3% | 32 6% | 30.6 10% | 34 -0% | 33.2 2% |
| Idle Maximum * | 33.9 | 40 -18% | 35 -3% | 35.7 -5% | 35 -3% | 33.7 1% |
| Load Average * | 43.8 | 43 2% | 50 -14% | 49 -12% | 45 -3% | 41.7 5% |
| Load Maximum * | 53.4 | 54 -1% | 64 -20% | 55 -3% | 52 3% | 48.2 10% |
* ... Meglio usare valori piccoli
(-) La temperatura massima sul lato superiore è di 47.6 °C / 118 F, rispetto alla media di 40.4 °C / 105 F, che varia da 21.2 a 68.8 °C per questa classe Gaming.
(-) Il lato inferiore si riscalda fino ad un massimo di 53.2 °C / 128 F, rispetto alla media di 43.2 °C / 110 F
(+) In idle, la temperatura media del lato superiore è di 27.3 °C / 81 F, rispetto alla media deld ispositivo di 33.8 °C / 93 F.
(±) I poggiapolsi e il touchpad possono diventare molto caldi al tatto con un massimo di 36.6 °C / 97.9 F.
(-) La temperatura media della zona del palmo della mano di dispositivi simili e'stata di 28.9 °C / 84 F (-7.7 °C / -13.9 F).
EVGA SC17 GTX 1070 analisi audio
(-) | altoparlanti non molto potenti (64.6 dB)
Bassi 100 - 315 Hz
(±) | bassi ridotti - in media 8.6% inferiori alla media
(±) | la linearità dei bassi è media (13.9% delta rispetto alla precedente frequenza)
Medi 400 - 2000 Hz
(+) | medi bilanciati - solo only 3.9% rispetto alla media
(+) | medi lineari (6.7% delta rispetto alla precedente frequenza)
Alti 2 - 16 kHz
(+) | Alti bilanciati - appena 2.8% dalla media
(±) | la linearità degli alti è media (12.7% delta rispetto alla precedente frequenza)
Nel complesso 100 - 16.000 Hz
(±) | la linearità complessiva del suono è media (24.8% di differenza rispetto alla media
Rispetto alla stessa classe
» 87% di tutti i dispositivi testati in questa classe è stato migliore, 4% simile, 9% peggiore
» Il migliore ha avuto un delta di 6%, medio di 18%, peggiore di 132%
Rispetto a tutti i dispositivi testati
» 72% di tutti i dispositivi testati in questa classe è stato migliore, 6% similare, 22% peggiore
» Il migliore ha avuto un delta di 4%, medio di 25%, peggiore di 134%
Apple MacBook 12 (Early 2016) 1.1 GHz analisi audio
(+) | gli altoparlanti sono relativamente potenti (83.6 dB)
Bassi 100 - 315 Hz
(±) | bassi ridotti - in media 11.3% inferiori alla media
(±) | la linearità dei bassi è media (14.2% delta rispetto alla precedente frequenza)
Medi 400 - 2000 Hz
(+) | medi bilanciati - solo only 2.4% rispetto alla media
(+) | medi lineari (5.5% delta rispetto alla precedente frequenza)
Alti 2 - 16 kHz
(+) | Alti bilanciati - appena 2% dalla media
(+) | alti lineari (4.5% delta rispetto alla precedente frequenza)
Nel complesso 100 - 16.000 Hz
(+) | suono nel complesso lineare (10.2% differenza dalla media)
Rispetto alla stessa classe
» 5% di tutti i dispositivi testati in questa classe è stato migliore, 2% simile, 93% peggiore
» Il migliore ha avuto un delta di 5%, medio di 19%, peggiore di 53%
Rispetto a tutti i dispositivi testati
» 3% di tutti i dispositivi testati in questa classe è stato migliore, 1% similare, 96% peggiore
» Il migliore ha avuto un delta di 4%, medio di 25%, peggiore di 134%
| Off / Standby | |
| Idle | |
| Sotto carico |
|
Leggenda:
min: Attualmente utilizziamo il Metrahit Energy, un multimetro digitale professionale per la misurazione della qualità della potenza e dell'energia monofase, per le nostre misurazioni. | |
| EVGA SC17 GTX 1070 6820HK, GeForce GTX 1070 Mobile, Samsung SM951 MZVPV256 m.2, IPS, 3840x2160, 17.30 | Aorus X7 v6 6820HK, GeForce GTX 1070 Mobile, Toshiba NVMe THNSN5512GPU7, TN LED, 2560x1440, 17.30 | MSI GT73VR 6RF 6820HK, GeForce GTX 1080 Mobile, 2x SanDisk X400 1TB M.2 SD8SN8U1T001122 (RAID 0), IPS, 3840x2160, 17.30 | HP Omen 17-w110ng 6700HQ, GeForce GTX 1070 Mobile, Samsung PM951 NVMe MZVLV256, IPS, 1920x1080, 17.30 | EVGA SC17 6820HK, GeForce GTX 980M, Samsung SSD 950 Pro 512GB m.2 NVMe, IPS, 3840x2160, 17.30 | |
|---|---|---|---|---|---|
| Power Consumption | 2% | -13% | 25% | 11% | |
| Idle Minimum * | 27.3 | 29 -6% | 28.9 -6% | 19 30% | 20.9 23% |
| Idle Average * | 34.9 | 31 11% | 30.6 12% | 25 28% | 31.7 9% |
| Idle Maximum * | 37.6 | 38 -1% | 33.1 12% | 31 18% | 32.6 13% |
| Load Average * | 164.4 | 111 32% | 224.4 -36% | 90 45% | 142.8 13% |
| Load Maximum * | 202.5 | 253 -25% | 302.6 -49% | 193 5% | 210.5 -4% |
* ... Meglio usare valori piccoli
| EVGA SC17 GTX 1070 6820HK, GeForce GTX 1070 Mobile, 74.48 Wh | Aorus X7 v6 6820HK, GeForce GTX 1070 Mobile, 94 Wh | MSI GT73VR 6RF 6820HK, GeForce GTX 1080 Mobile, 75.2 Wh | Eurocom Sky X7E2 6700K, GeForce GTX 1080 Mobile, 89 Wh | HP Omen 17-w110ng 6700HQ, GeForce GTX 1070 Mobile, 95 Wh | EVGA SC17 6820HK, GeForce GTX 980M, 74.48 Wh | |
|---|---|---|---|---|---|---|
| Autonomia della batteria | 14% | 23% | -9% | 81% | 32% | |
| Reader / Idle | 242 | 306 26% | 137 -43% | 432 79% | 310 28% | |
| WiFi v1.3 | 160 | 182 14% | 198 24% | 104 -35% | 247 54% | 206 29% |
| Load | 55 | 65 18% | 83 51% | 115 109% | 76 38% |
Pro
Contro
L'originale SC17 con GTX 980M si faceva notare perché puntava sull'overclocking e per la solida piattaforma molto più portatile rispetto ad un equivalente, GT72, G752, o Clevo barebone. Ora che la maggioranza dei produttori gaming ha portato i suoi notebooks verso la Pascal, l'ultimo aggiornamento SC17 non offre abbastanza per essere un must buy. I produttori come MSI ed Aorus hanno colto l'opportunità di aggiungere altre features oltre al semplice upgrade della GPU come gli schermi 5 ms/120 Hz, G-Sync, RAID, illuminazione individuale RGB dei tasti, tasti macro ed ausiliari, Thunderbolt 3, ed altro che manca sull'SC17. L'EVGA non ha nemmeno un semplice card reader come il Razer Blade 14 o il Blade Pro 17.
Performance e qualità di costruzione rispecchiano il prezzo premium, ma sta diventando molto difficile scrollarsi di dosso l'etichetta barebone per l'SC17.
Nota: si tratta di una recensione breve, con alcune sezioni non tradotte, per la versione integrale in inglese guardate qui.
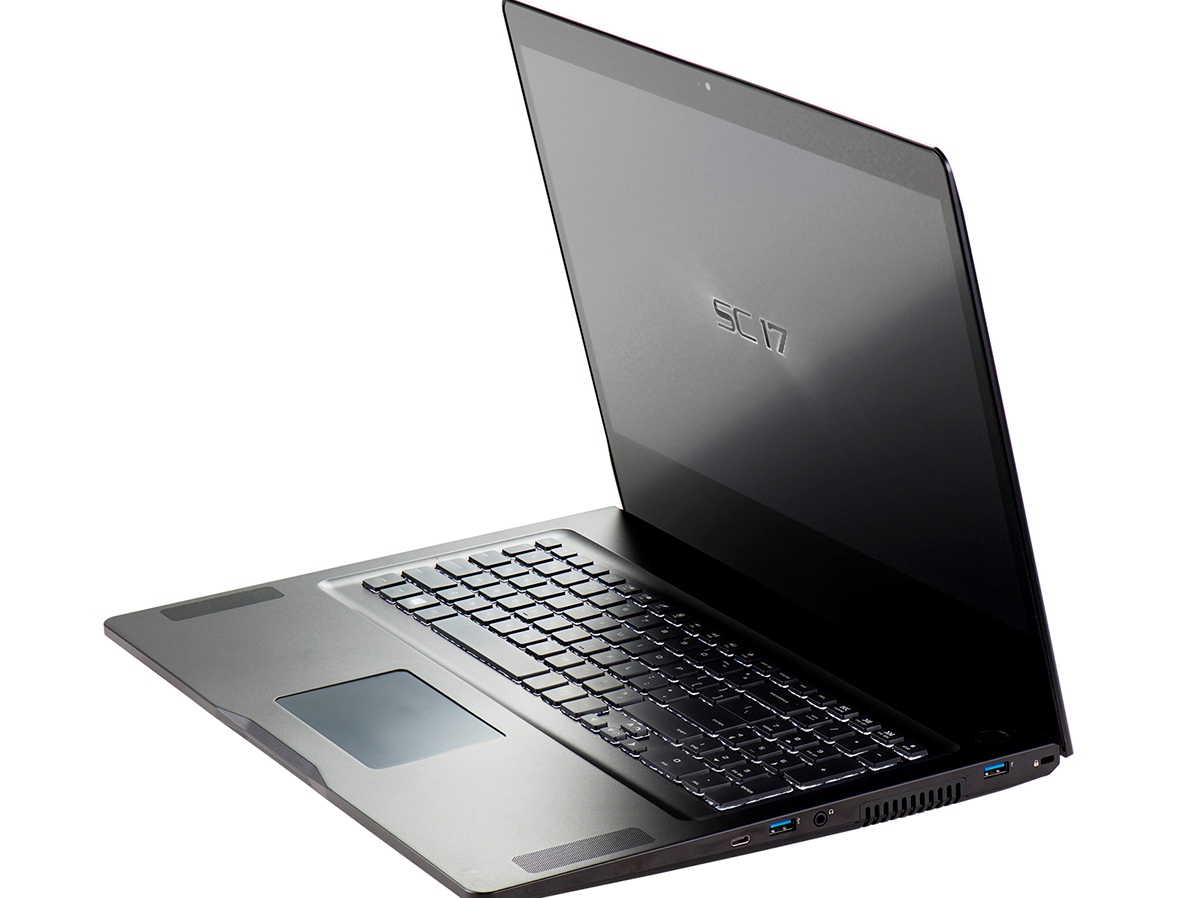
EVGA SC17 GTX 1070
-
11/20/2016 v5.1(old)
Allen Ngo
Pricecompare
