 Deutsch
 English
 Español
 Français
 Italiano
 Nederlands
 Polski
 Português
 Русский
 Türkçe
 Svenska
 Chinese
 Magyar
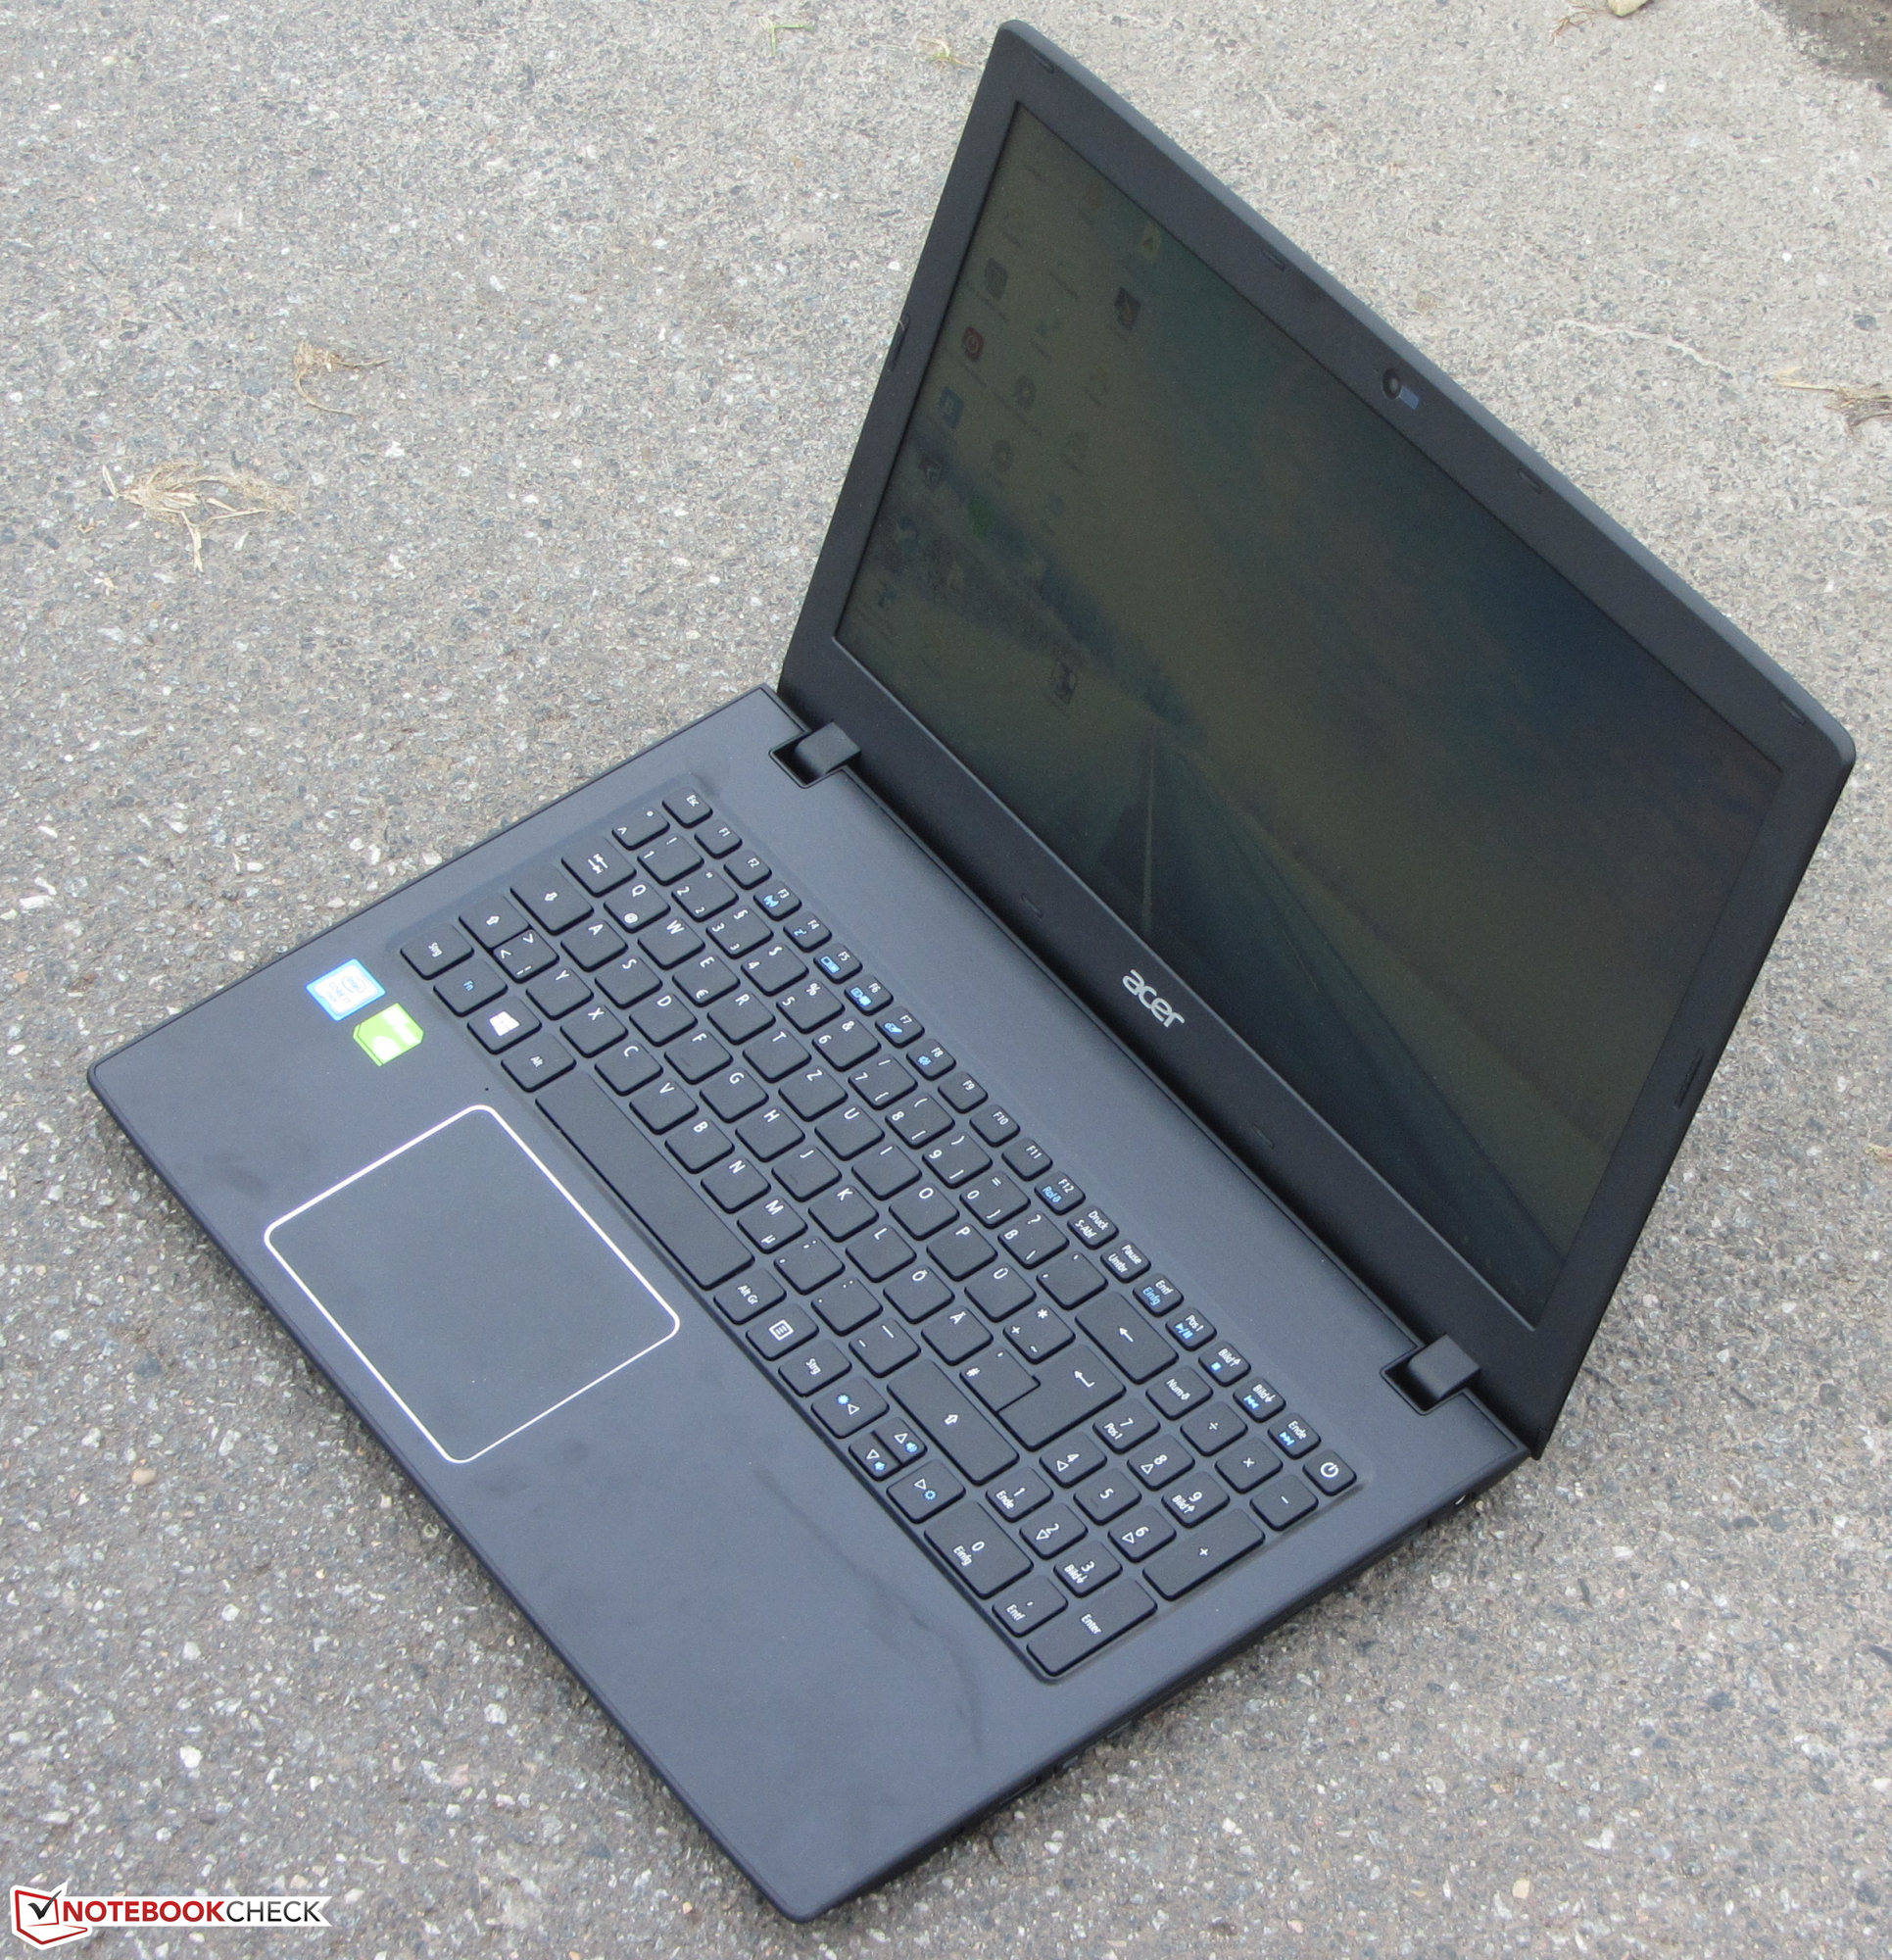
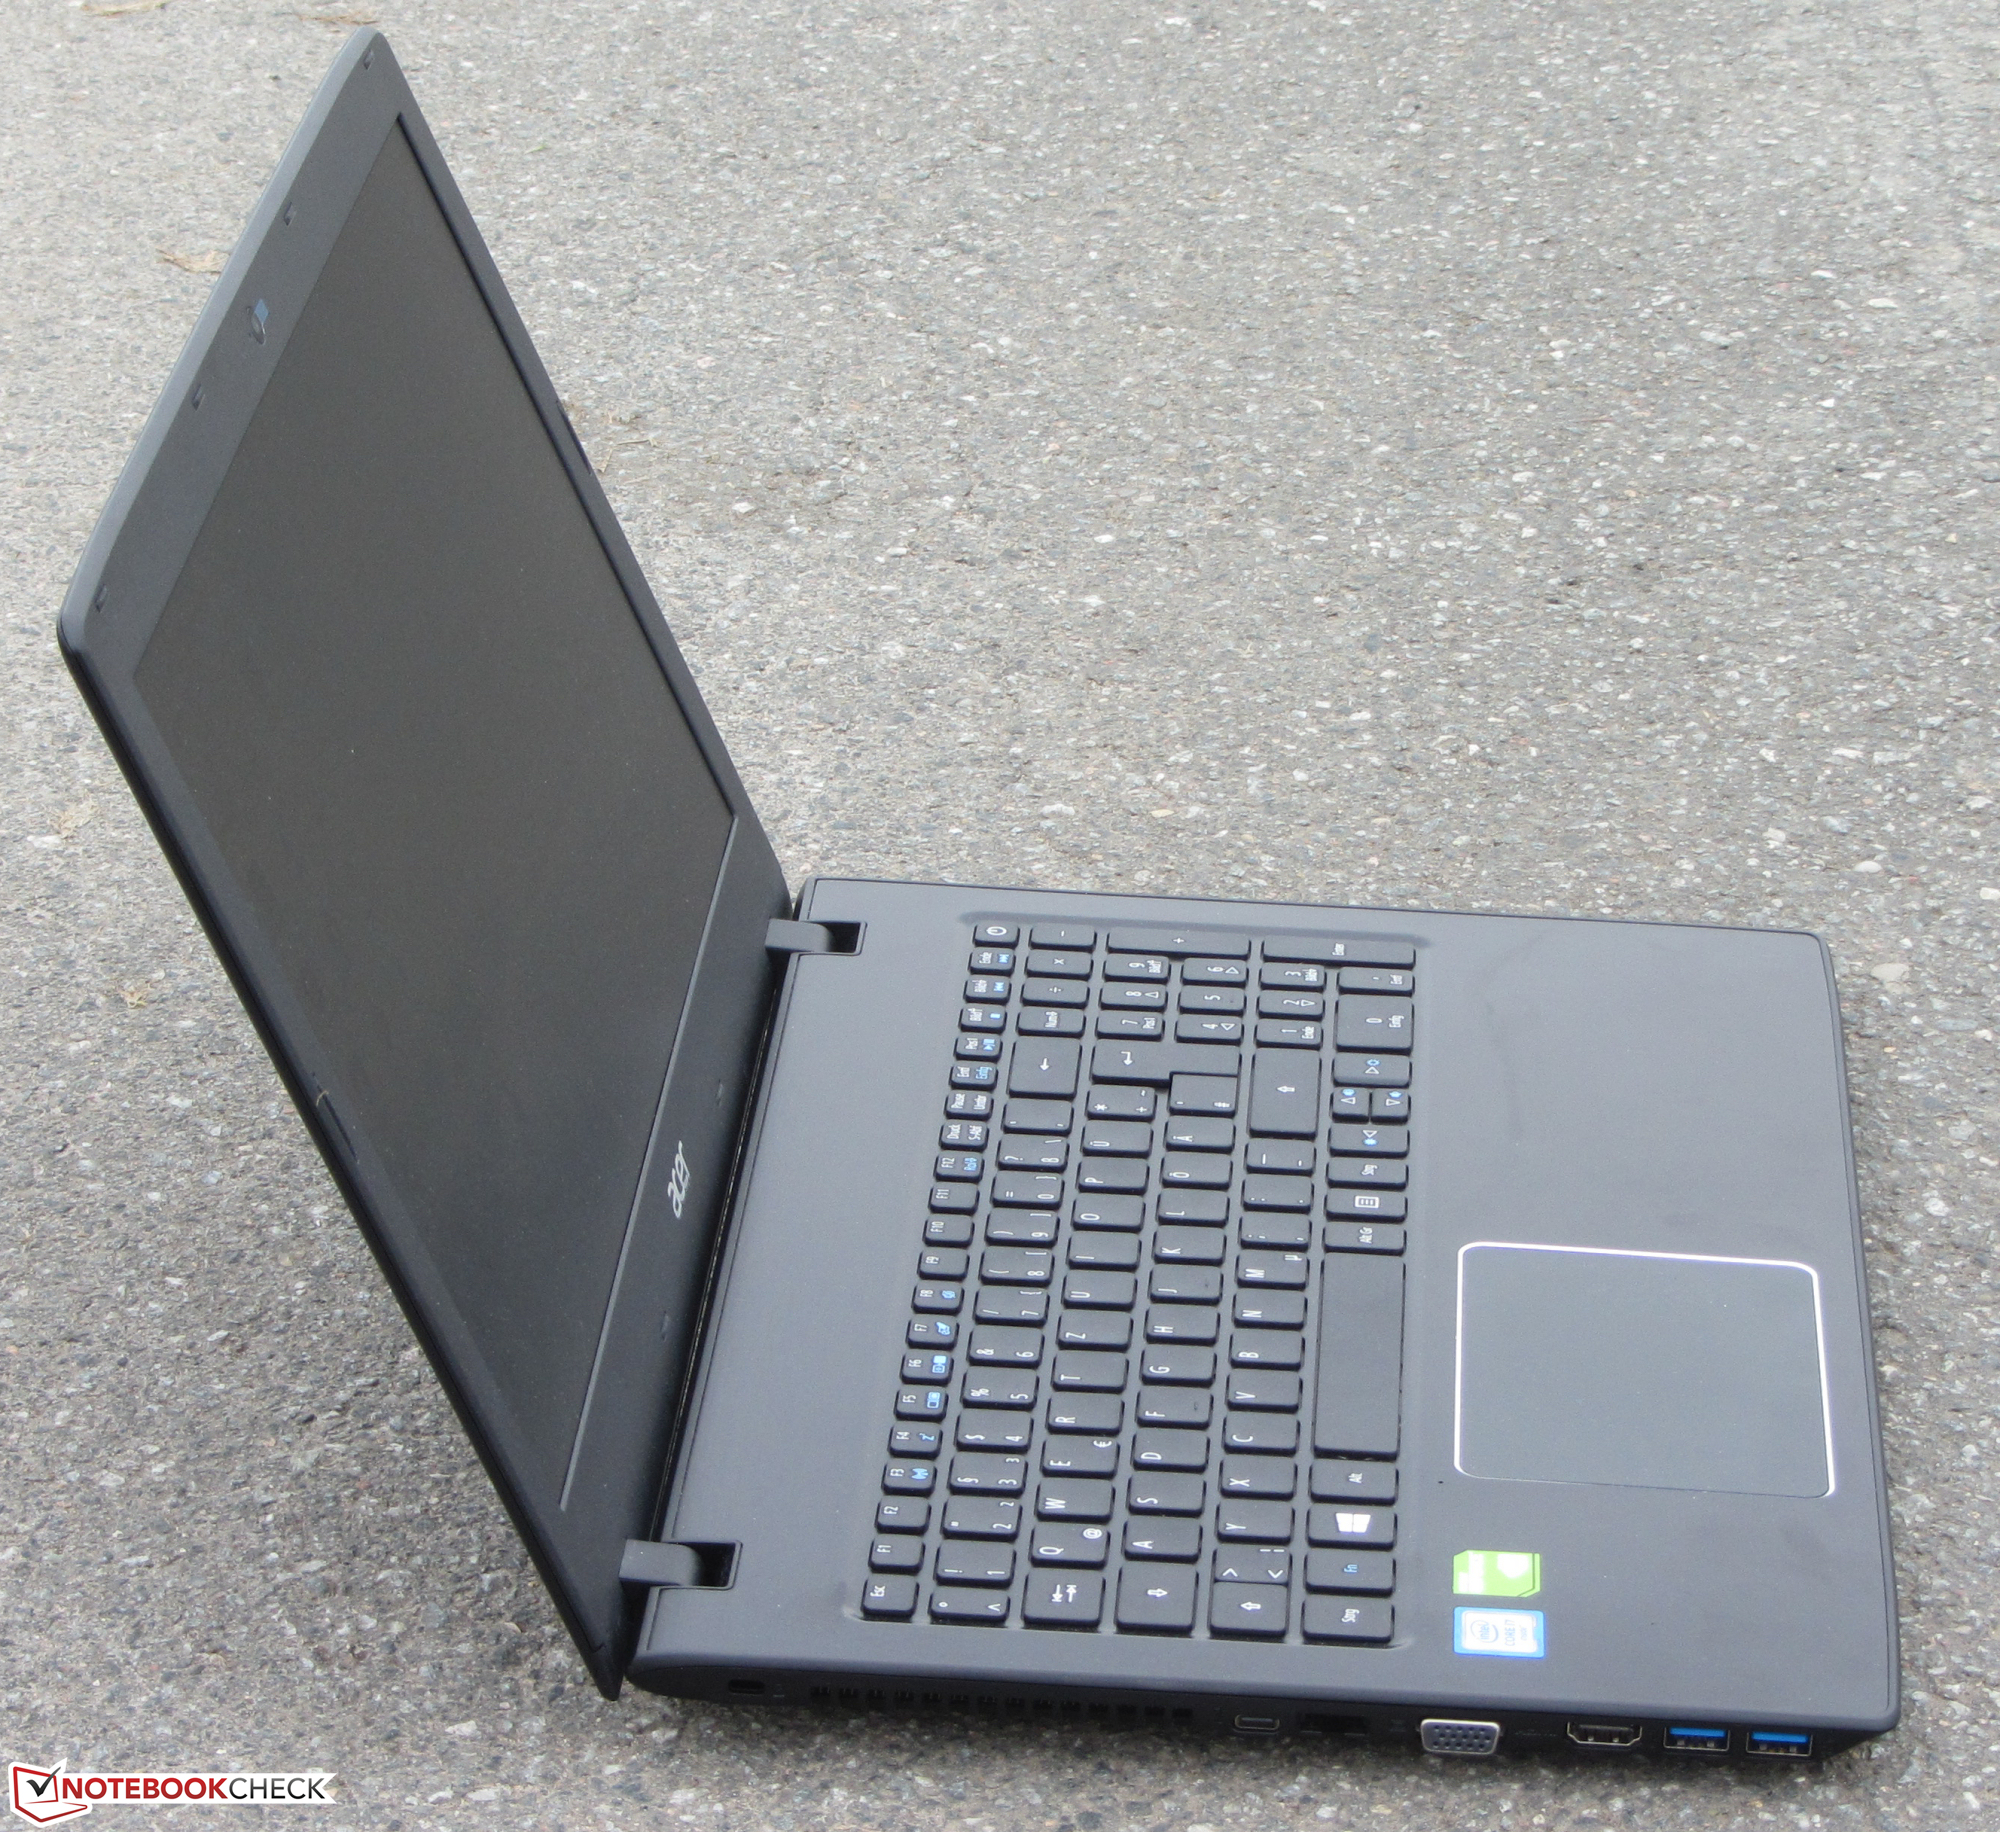
Recensione breve del Portatile Acer TravelMate P259-MG-71UU


| SD Card Reader | |
| average JPG Copy Test (av. of 3 runs) | |
| HP ProBook 450 G4 Y8B60EA | |
| Acer TravelMate P259-MG-71UU | |
| Lenovo ThinkPad E560-20EWS00000 | |
| Dell Latitude 15-3570 | |
| maximum AS SSD Seq Read Test (1GB) | |
| HP ProBook 450 G4 Y8B60EA | |
| Lenovo ThinkPad E560-20EWS00000 | |
| Dell Latitude 15-3570 | |
| Networking | |
| iperf Server (receive) TCP 1 m | |
| HP ProBook 450 G4 Y8B60EA | |
| iperf Client (transmit) TCP 1 m | |
| HP ProBook 450 G4 Y8B60EA | |
| iperf3 receive AX12 | |
| Acer TravelMate P259-MG-71UU | |
| iperf3 transmit AX12 | |
| Acer TravelMate P259-MG-71UU | |
| |||||||||||||||||||||||||
Distribuzione della luminosità: 93 %
Al centro con la batteria: 180 cd/m²
Contrasto: 400:1 (Nero: 0.45 cd/m²)
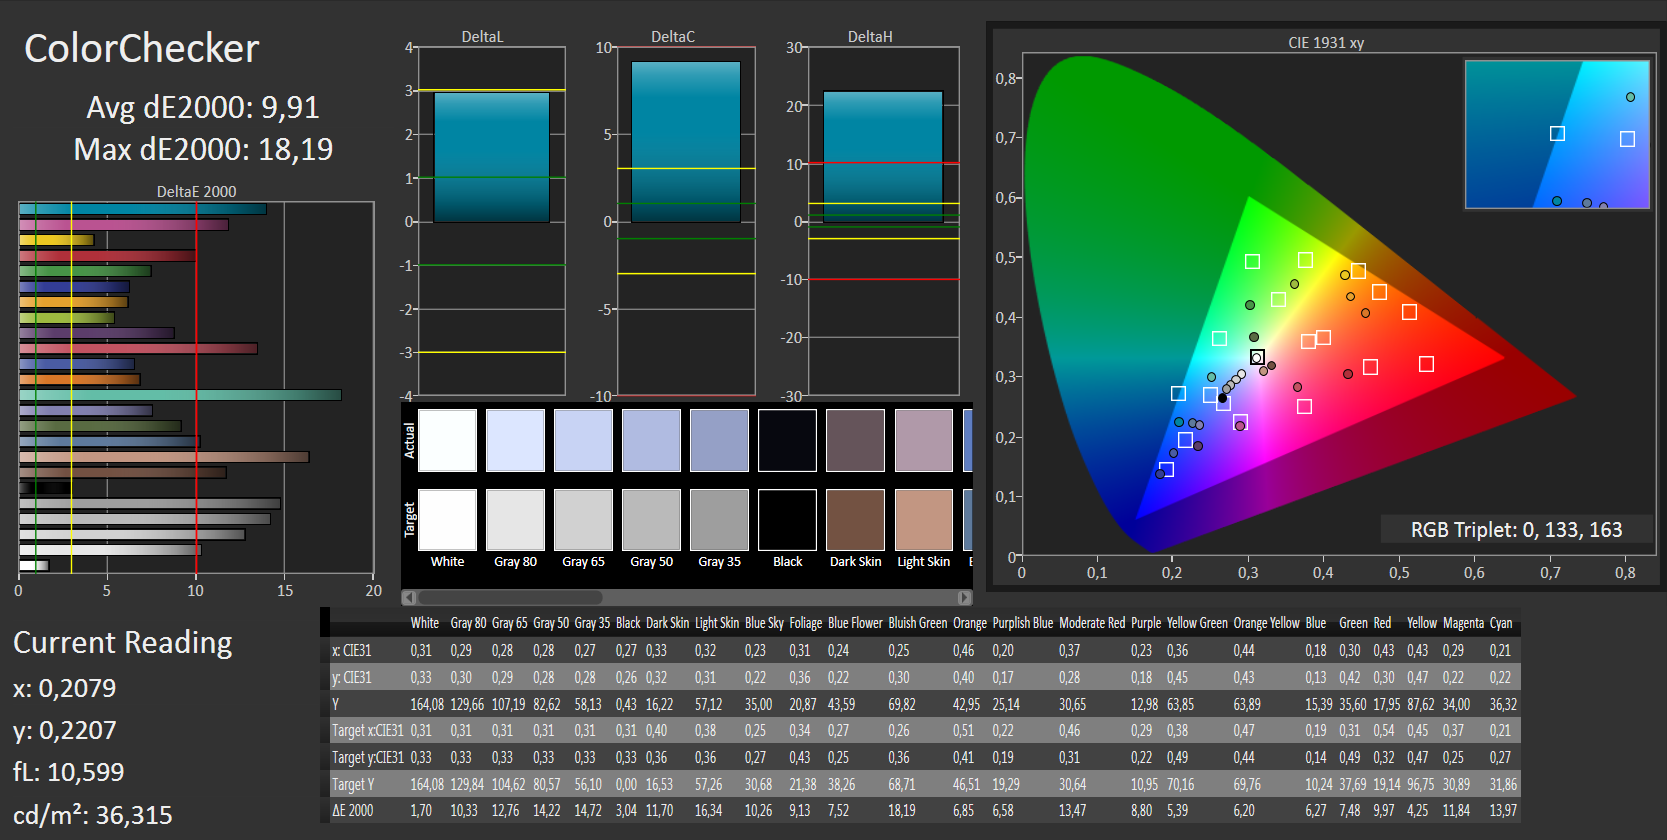
ΔE Color 9.91 | 0.5-29.43 Ø5
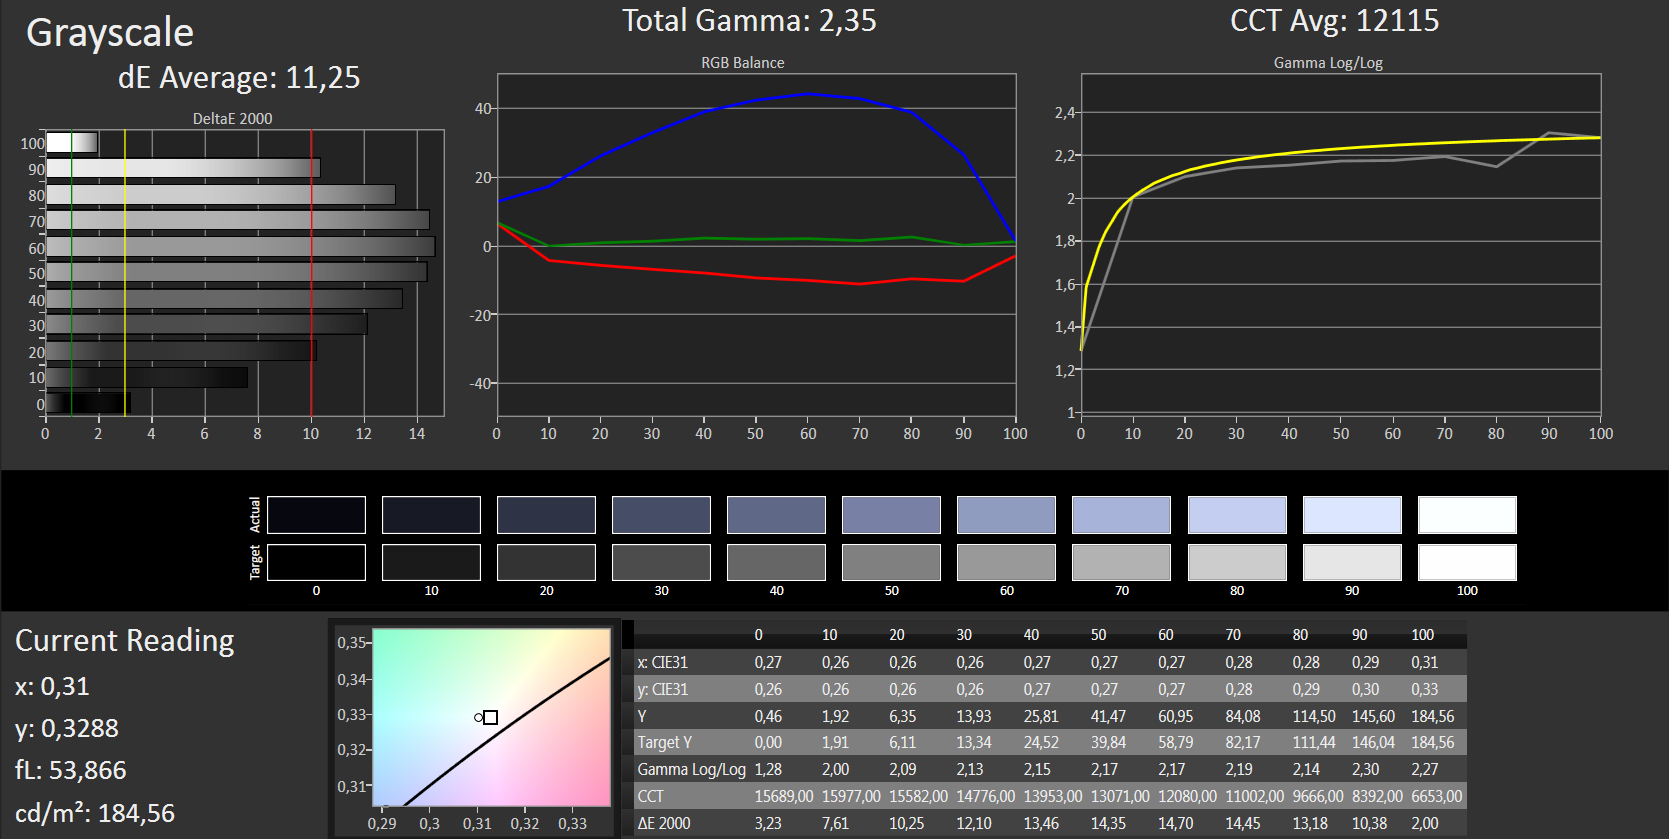
ΔE Greyscale 11.25 | 0.57-98 Ø5.3
58% sRGB (Argyll 1.6.3 3D)
37% AdobeRGB 1998 (Argyll 1.6.3 3D)
39.85% AdobeRGB 1998 (Argyll 2.2.0 3D)
58% sRGB (Argyll 2.2.0 3D)
38.58% Display P3 (Argyll 2.2.0 3D)
Gamma: 2.35
| Acer TravelMate P259-MG-71UU TN LED, 1920x1080, 15.60 | HP ProBook 450 G4 Y8B60EA TN LED, 1920x1080, 15.60 | Lenovo ThinkPad E560-20EWS00000 IPS-Panel, 1920x1080, 15.60 | Dell Latitude 15-3570 TN LED, 1366x768, 15.60 | Fujitsu LifeBook A556 PL 1366x768, 15.60 | |
|---|---|---|---|---|---|
| Display | 3% | -0% | 5% | 6% | |
| Display P3 Coverage | 38.58 | 39.89 3% | 38.5 0% | 40.61 5% | 41.18 7% |
| sRGB Coverage | 58 | 59.5 3% | 57.5 -1% | 61.1 5% | 60.9 5% |
| AdobeRGB 1998 Coverage | 39.85 | 41.24 3% | 39.8 0% | 41.96 5% | 42.7 7% |
| Response Times | -28% | 5% | -27% | ||
| Response Time Grey 50% / Grey 80% * | 43 ? | 51 ? -19% | 38.4 ? 11% | 37 ? 14% | |
| Response Time Black / White * | 22 ? | 30 ? -36% | 22.4 ? -2% | 37 ? -68% | |
| PWM Frequency | 50 ? | ||||
| Screen | 4% | 35% | -7% | -35% | |
| Brightness middle | 180 | 214 19% | 257 43% | 202 12% | 250.7 39% |
| Brightness | 178 | 201 13% | 234 31% | 211 19% | 249 40% |
| Brightness Distribution | 93 | 77 -17% | 83 -11% | 88 -5% | 83 -11% |
| Black Level * | 0.45 | 0.43 4% | 0.27 40% | 0.62 -38% | 1.3 -189% |
| Contrast | 400 | 498 25% | 952 138% | 326 -18% | 193 -52% |
| Colorchecker dE 2000 * | 9.91 | 10.68 -8% | 7.16 28% | 12.35 -25% | |
| Colorchecker dE 2000 max. * | 18.19 | 18.07 1% | 19.9 -9% | ||
| Greyscale dE 2000 * | 11.25 | 11.32 -1% | 6.28 44% | 13.46 -20% | |
| Gamma | 2.35 94% | 2.26 97% | 2.44 90% | 2.44 90% | |
| CCT | 12115 54% | 12204 53% | 6806 96% | 15217 43% | |
| Color Space (Percent of AdobeRGB 1998) | 37 | 38 3% | 36.6 -1% | 39 5% | |
| Color Space (Percent of sRGB) | 58 | 59 2% | 57.3 -1% | 61 5% | |
| Media totale (Programma / Settaggio) | -7% /
-0% | 13% /
23% | -10% /
-8% | -15% /
-19% |
* ... Meglio usare valori piccoli
Sfarfallio dello schermo / PWM (Pulse-Width Modulation)
| flickering dello schermo / PWM non rilevato | ||
In confronto: 53 % di tutti i dispositivi testati non utilizza PWM per ridurre la luminosita' del display. Se è rilevato PWM, una media di 17924 (minimo: 5 - massimo: 3846000) Hz è stata rilevata. | ||
Tempi di risposta del Display
| ↔ Tempi di risposta dal Nero al Bianco | ||
|---|---|---|
| 22 ms ... aumenta ↗ e diminuisce ↘ combinato | ↗ 6 ms Incremento | 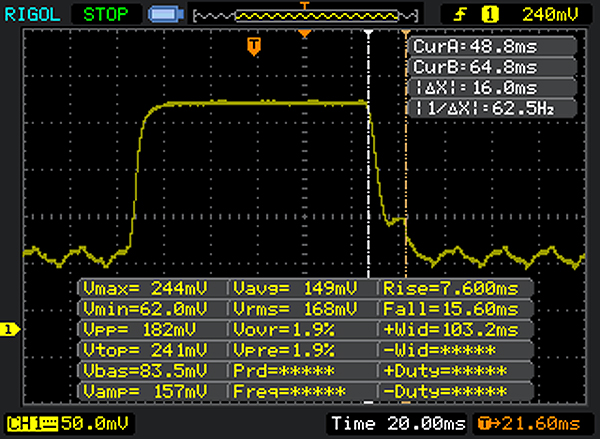 |
| ↘ 16 ms Calo | ||
| Lo schermo mostra buoni tempi di risposta durante i nostri tests, ma potrebbe essere troppo lento per i gamers competitivi. In confronto, tutti i dispositivi di test variano da 0.1 (minimo) a 240 (massimo) ms. » 42 % di tutti i dispositivi è migliore. Questo significa che i tempi di risposta rilevati sono simili alla media di tutti i dispositivi testati (21.5 ms). | ||
| ↔ Tempo di risposta dal 50% Grigio all'80% Grigio | ||
| 43 ms ... aumenta ↗ e diminuisce ↘ combinato | ↗ 20 ms Incremento | 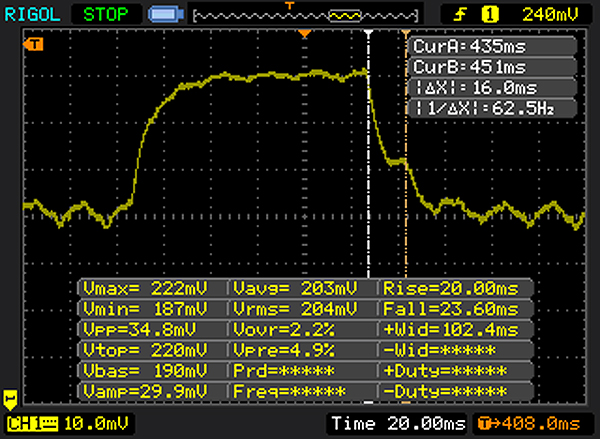 |
| ↘ 23 ms Calo | ||
| Lo schermo mostra tempi di risposta lenti nei nostri tests e sarà insoddisfacente per i gamers. In confronto, tutti i dispositivi di test variano da 0.2 (minimo) a 636 (massimo) ms. » 67 % di tutti i dispositivi è migliore. Questo significa che i tempi di risposta rilevati sono peggiori rispetto alla media di tutti i dispositivi testati (33.7 ms). | ||


| Cinebench R15 | |
| CPU Single 64Bit | |
| HP ProBook 450 G4 Y8B60EA | |
| Acer TravelMate P259-MG-71UU | |
| Lenovo ThinkPad E560-20EWS00000 | |
| Dell Latitude 15-3570 | |
| Fujitsu LifeBook A556 PL | |
| CPU Multi 64Bit | |
| HP ProBook 450 G4 Y8B60EA | |
| Acer TravelMate P259-MG-71UU | |
| Lenovo ThinkPad E560-20EWS00000 | |
| Dell Latitude 15-3570 | |
| Fujitsu LifeBook A556 PL | |
| Cinebench R11.5 | |
| CPU Multi 64Bit | |
| Lenovo ThinkPad E560-20EWS00000 | |
| Acer TravelMate P259-MG-71UU | |
| CPU Single 64Bit | |
| Acer TravelMate P259-MG-71UU | |
| Lenovo ThinkPad E560-20EWS00000 | |
| Cinebench R10 | |
| Rendering Multiple CPUs 32Bit | |
| Acer TravelMate P259-MG-71UU | |
| Lenovo ThinkPad E560-20EWS00000 | |
| Rendering Single 32Bit | |
| Lenovo ThinkPad E560-20EWS00000 | |
| Acer TravelMate P259-MG-71UU | |
| Geekbench 3 | |
| 32 Bit Single-Core Score | |
| Acer TravelMate P259-MG-71UU | |
| Lenovo ThinkPad E560-20EWS00000 | |
| 32 Bit Multi-Core Score | |
| Acer TravelMate P259-MG-71UU | |
| Lenovo ThinkPad E560-20EWS00000 | |
| Geekbench 4.0 | |
| 64 Bit Single-Core Score | |
| Acer TravelMate P259-MG-71UU | |
| 64 Bit Multi-Core Score | |
| Acer TravelMate P259-MG-71UU | |
| JetStream 1.1 - Total Score | |
| HP ProBook 450 G4 Y8B60EA | |
| Lenovo ThinkPad E560-20EWS00000 | |
| Acer TravelMate P259-MG-71UU | |
| Mozilla Kraken 1.1 - Total | |
| Acer TravelMate P259-MG-71UU | |
| Lenovo ThinkPad E560-20EWS00000 | |
| HP ProBook 450 G4 Y8B60EA | |
* ... Meglio usare valori piccoli
| PCMark 7 Score | 4890 punti | |
| PCMark 8 Home Score Accelerated v2 | 3823 punti | |
| PCMark 8 Creative Score Accelerated v2 | 4112 punti | |
| PCMark 8 Work Score Accelerated v2 | 4699 punti | |
Aiuto | ||
| PCMark 8 | |
| Home Score Accelerated v2 | |
| Acer TravelMate P259-MG-71UU | |
| Lenovo ThinkPad E560-20EWS00000 | |
| Dell Latitude 15-3570 | |
| HP ProBook 450 G4 Y8B60EA | |
| Work Score Accelerated v2 | |
| HP ProBook 450 G4 Y8B60EA | |
| Acer TravelMate P259-MG-71UU | |
| Lenovo ThinkPad E560-20EWS00000 | |
| Dell Latitude 15-3570 | |

| Acer TravelMate P259-MG-71UU Liteonit CV3-8D256 | Lenovo ThinkPad E560-20EWS00000 Samsung CM871 MZ7LF192HCGS | Dell Latitude 15-3570 Samsung CM871 MZNLF128HCHP | Fujitsu LifeBook A556 PL Toshiba MQ02ABF050H (SSHD 500 + 8 GB) | |
|---|---|---|---|---|
| CrystalDiskMark 3.0 | -38% | -44% | -89% | |
| Read Seq | 478.5 | 462 -3% | 453.2 -5% | 105.8 -78% |
| Write Seq | 258.2 | 174.5 -32% | 137.7 -47% | 88.8 -66% |
| Read 512 | 254.3 | 306.8 21% | 308.5 21% | 29.45 -88% |
| Write 512 | 264.8 | 168.6 -36% | 134.1 -49% | 36.9 -86% |
| Read 4k | 28.32 | 16.14 -43% | 19.06 -33% | 0.428 -98% |
| Write 4k | 76.3 | 36.24 -53% | 21.31 -72% | 0.646 -99% |
| Read 4k QD32 | 346.2 | 95.7 -72% | 93.5 -73% | 0.978 -100% |
| Write 4k QD32 | 240.2 | 36.23 -85% | 23.3 -90% | 0.615 -100% |
| 3DMark 06 Standard Score | 14930 punti | |
| 3DMark 11 Performance | 3027 punti | |
| 3DMark Ice Storm Standard Score | 48176 punti | |
| 3DMark Cloud Gate Standard Score | 5606 punti | |
| 3DMark Fire Strike Score | 2025 punti | |
| 3DMark Fire Strike Extreme Score | 953 punti | |
Aiuto | ||
| 3DMark 11 - 1280x720 Performance GPU | |
| Acer TravelMate P259-MG-71UU | |
| Dell Inspiron 17 7778 | |
| Lenovo ThinkPad E470-20H2S00400 | |
| Lenovo ThinkPad E560-20EWS00000 | |
| HP ProBook 450 G4 Y8B60EA | |
| Fujitsu LifeBook A556 PL | |
| Dell Latitude 15-3570 | |
| 3DMark | |
| 1280x720 Cloud Gate Standard Graphics | |
| Acer TravelMate P259-MG-71UU | |
| Dell Inspiron 17 7778 | |
| Lenovo ThinkPad E560-20EWS00000 | |
| Lenovo ThinkPad E470-20H2S00400 | |
| HP ProBook 450 G4 Y8B60EA | |
| Fujitsu LifeBook A556 PL | |
| Dell Latitude 15-3570 | |
| 1920x1080 Fire Strike Graphics | |
| Acer TravelMate P259-MG-71UU | |
| Dell Inspiron 17 7778 | |
| Lenovo ThinkPad E560-20EWS00000 | |
| Lenovo ThinkPad E470-20H2S00400 | |
| HP ProBook 450 G4 Y8B60EA | |
| Fujitsu LifeBook A556 PL | |
| basso | medio | alto | ultra | |
| Tomb Raider (2013) | 182.8 | 95.9 | 62.6 | 29.4 |
| BioShock Infinite (2013) | 117 | 70.9 | 61.9 | 24 |
| Battlefield 4 (2013) | 82.7 | 58.3 | 42.9 | 17.4 |
| FIFA 17 (2016) | 135.4 | 105.3 | 58.3 | 55 |
| Battlefield 1 (2016) | 61.7 | 40.5 | 19 | 17 |
| Civilization VI (2016) | 48.8 | 26 | 13.5 | 10.5 |
| Farming Simulator 17 (2016) | 146.2 | 99.6 | 42.8 | 28.2 |
| Titanfall 2 (2016) | 68.6 | 44.8 | 20 | 16.4 |
| Call of Duty Infinite Warfare (2016) | 42.8 | 39.2 | 21.8 | 16.4 |
| Dishonored 2 (2016) | 33.4 | 26 | 13.6 | 11.3 |
| Watch Dogs 2 (2016) | 33.2 | 28.6 | 13.8 | 8.5 |
| BioShock Infinite - 1366x768 High Preset | |
| Acer TravelMate P259-MG-71UU | |
| Dell Inspiron 17 7778 | |
| Dell Vostro 15 5568 | |
| Lenovo ThinkPad E560-20EWS00000 | |
| Lenovo ThinkPad E470-20H2S00400 | |
| HP ProBook 450 G4 Y8B60EA | |
| Fujitsu LifeBook A556 PL | |
| Dell Latitude 15-3570 | |
| Battlefield 4 - 1366x768 Medium Preset | |
| Acer TravelMate P259-MG-71UU | |
| Lenovo ThinkPad E560-20EWS00000 | |
| Lenovo ThinkPad E470-20H2S00400 | |
| Dell Inspiron 17 7778 | |
Rumorosità
| Idle |
| 31.6 / 31.6 / 32 dB(A) |
| DVD |
| 35.8 / dB(A) |
| Sotto carico |
| 35.5 / 38.3 dB(A) |
 | ||
30 dB silenzioso 40 dB(A) udibile 50 dB(A) rumoroso |
||
min: | ||
| Acer TravelMate P259-MG-71UU 6500U, GeForce 940MX | HP ProBook 450 G4 Y8B60EA i7-7500U, GeForce 930MX | Lenovo ThinkPad E560-20EWS00000 6500U, Radeon R7 M370 | Dell Latitude 15-3570 6200U, HD Graphics 520 | Fujitsu LifeBook A556 PL 6200U, HD Graphics 520 | |
|---|---|---|---|---|---|
| Noise | -4% | 7% | 3% | -0% | |
| off /ambiente * | 30.5 | 31.6 -4% | 31 -2% | ||
| Idle Minimum * | 31.6 | 32.6 -3% | 29.2 8% | 31 2% | 30.9 2% |
| Idle Average * | 31.6 | 32.6 -3% | 29.2 8% | 31 2% | 31 2% |
| Idle Maximum * | 32 | 33 -3% | 29.2 9% | 31 3% | 31.1 3% |
| Load Average * | 35.5 | 38.9 -10% | 33.6 5% | 34.2 4% | 36.9 -4% |
| Load Maximum * | 38.3 | 38.9 -2% | 35.5 7% | 34.3 10% | 39.8 -4% |
* ... Meglio usare valori piccoli
(+) La temperatura massima sul lato superiore è di 35.1 °C / 95 F, rispetto alla media di 34.2 °C / 94 F, che varia da 21.2 a 62.5 °C per questa classe Office.
(-) Il lato inferiore si riscalda fino ad un massimo di 46.7 °C / 116 F, rispetto alla media di 36.7 °C / 98 F
(+) In idle, la temperatura media del lato superiore è di 25.1 °C / 77 F, rispetto alla media deld ispositivo di 29.5 °C / 85 F.
(+) I poggiapolsi e il touchpad raggiungono la temperatura massima della pelle (34 °C / 93.2 F) e quindi non sono caldi.
(-) La temperatura media della zona del palmo della mano di dispositivi simili e'stata di 27.7 °C / 81.9 F (-6.3 °C / -11.3 F).
| Acer TravelMate P259-MG-71UU 6500U, GeForce 940MX | HP ProBook 450 G4 Y8B60EA i7-7500U, GeForce 930MX | Lenovo ThinkPad E560-20EWS00000 6500U, Radeon R7 M370 | Dell Latitude 15-3570 6200U, HD Graphics 520 | Fujitsu LifeBook A556 PL 6200U, HD Graphics 520 | |
|---|---|---|---|---|---|
| Heat | -7% | -3% | -10% | 14% | |
| Maximum Upper Side * | 35.1 | 44.3 -26% | 45 -28% | 36.1 -3% | 33.2 5% |
| Maximum Bottom * | 46.7 | 46.3 1% | 39.8 15% | 47 -1% | 30.1 36% |
| Idle Upper Side * | 27 | 27.8 -3% | 26.1 3% | 31.7 -17% | 25.3 6% |
| Idle Bottom * | 27.4 | 27.7 -1% | 27.7 -1% | 32.9 -20% | 25 9% |
* ... Meglio usare valori piccoli
Acer TravelMate P259-MG-71UU analisi audio
(±) | potenza degli altiparlanti media ma buona (73 dB)
Bassi 100 - 315 Hz
(-) | quasi nessun basso - in media 24.4% inferiori alla media
(±) | la linearità dei bassi è media (11.7% delta rispetto alla precedente frequenza)
Medi 400 - 2000 Hz
(+) | medi bilanciati - solo only 4.1% rispetto alla media
(±) | linearità dei medi adeguata (11.3% delta rispetto alla precedente frequenza)
Alti 2 - 16 kHz
(±) | alti elevati - circa 7.5% superiori alla media
(±) | la linearità degli alti è media (8.5% delta rispetto alla precedente frequenza)
Nel complesso 100 - 16.000 Hz
(±) | la linearità complessiva del suono è media (26.8% di differenza rispetto alla media
Rispetto alla stessa classe
» 80% di tutti i dispositivi testati in questa classe è stato migliore, 7% simile, 13% peggiore
» Il migliore ha avuto un delta di 7%, medio di 22%, peggiore di 53%
Rispetto a tutti i dispositivi testati
» 79% di tutti i dispositivi testati in questa classe è stato migliore, 4% similare, 17% peggiore
» Il migliore ha avuto un delta di 4%, medio di 25%, peggiore di 134%
Apple MacBook 12 (Early 2016) 1.1 GHz analisi audio
(+) | gli altoparlanti sono relativamente potenti (83.6 dB)
Bassi 100 - 315 Hz
(±) | bassi ridotti - in media 11.3% inferiori alla media
(±) | la linearità dei bassi è media (14.2% delta rispetto alla precedente frequenza)
Medi 400 - 2000 Hz
(+) | medi bilanciati - solo only 2.4% rispetto alla media
(+) | medi lineari (5.5% delta rispetto alla precedente frequenza)
Alti 2 - 16 kHz
(+) | Alti bilanciati - appena 2% dalla media
(+) | alti lineari (4.5% delta rispetto alla precedente frequenza)
Nel complesso 100 - 16.000 Hz
(+) | suono nel complesso lineare (10.2% differenza dalla media)
Rispetto alla stessa classe
» 5% di tutti i dispositivi testati in questa classe è stato migliore, 2% simile, 93% peggiore
» Il migliore ha avuto un delta di 5%, medio di 19%, peggiore di 53%
Rispetto a tutti i dispositivi testati
» 3% di tutti i dispositivi testati in questa classe è stato migliore, 1% similare, 96% peggiore
» Il migliore ha avuto un delta di 4%, medio di 25%, peggiore di 134%
| Off / Standby | |
| Idle | |
| Sotto carico |
|
Leggenda:
min: Attualmente utilizziamo il Metrahit Energy, un multimetro digitale professionale per la misurazione della qualità della potenza e dell'energia monofase, per le nostre misurazioni. | |
| Acer TravelMate P259-MG-71UU 6500U, GeForce 940MX | HP ProBook 450 G4 Y8B60EA i7-7500U, GeForce 930MX | Lenovo ThinkPad E560-20EWS00000 6500U, Radeon R7 M370 | Dell Latitude 15-3570 6200U, HD Graphics 520 | Fujitsu LifeBook A556 PL 6200U, HD Graphics 520 | |
|---|---|---|---|---|---|
| Power Consumption | 15% | 3% | 30% | 23% | |
| Idle Minimum * | 7 | 3.8 46% | 4.2 40% | 4.9 30% | 4.5 36% |
| Idle Average * | 8 | 6.6 17% | 7.5 6% | 7.2 10% | 6.1 24% |
| Idle Maximum * | 10.6 | 11.3 -7% | 8.2 23% | 7.5 29% | 10.5 1% |
| Load Average * | 39.7 | 38 4% | 49.6 -25% | 25.4 36% | 29.9 25% |
| Load Maximum * | 51.9 | 45 13% | 65.8 -27% | 28 46% | 37.2 28% |
* ... Meglio usare valori piccoli
| Acer TravelMate P259-MG-71UU 6500U, GeForce 940MX, 41 Wh | HP ProBook 450 G4 Y8B60EA i7-7500U, GeForce 930MX, 45 Wh | Lenovo ThinkPad E560-20EWS00000 6500U, Radeon R7 M370, 48 Wh | Dell Latitude 15-3570 6200U, HD Graphics 520, 65 Wh | Fujitsu LifeBook A556 PL 6200U, HD Graphics 520, 45 Wh | |
|---|---|---|---|---|---|
| Autonomia della batteria | 75% | 55% | 114% | -5% | |
| Reader / Idle | 615 | 746 21% | 884 44% | 1024 67% | 587 -5% |
| H.264 | 245 | 413 69% | |||
| WiFi v1.3 | 280 | 513 83% | 342 22% | 542 94% | |
| Load | 56 | 123 120% | 104 86% | 157 180% | |
| WiFi | 349 |
Pro
Contro
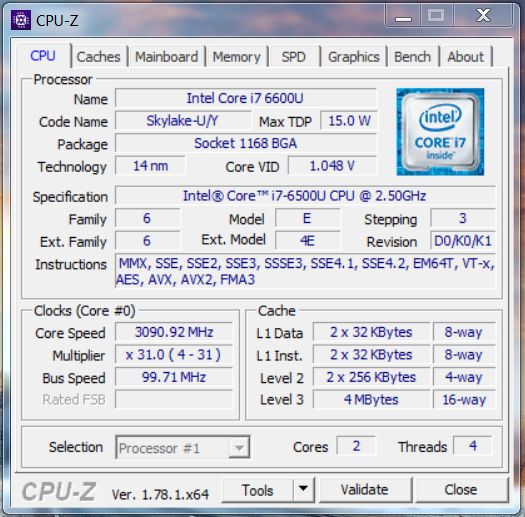
Kaby Lake non ha trovato la sua situazione ideale nel Travelmate. Il processore Core i7 della generazione Skylake utilizzato, tuttavia, fornisce prestazioni adeguate per le applicazioni. Grazie alla unità grafica GeForce, possono essere usati vari giochi vecchi e nuovi. Il portatile non è rumoroso indipendentemente dal carico di lavoro. E' silenzioso anche in idle in alcune condizioni. Anche le temperature sono moderate. Un veloce SSD assicura un sistema veloce. C'è anche molto spazio di archiviazione. La cover per la manutenzione consente una facile sostituzione di entrambi i drives. La tastiera installata è nel complesso soddisfacente. Il pacchetto è completato da tre anni di garanzia.
Acer ha fatto un buon lavoro con il Travelmate P259-MG-71UU, ma la scelta di uno schermo scarso ha impedito un punteggio migliore.
LO schermo installato è scuro, con contrasto basso, e angoli di visuale limitati. Ci aspettiamo uno pannello IPS nettamente migliore per un dispositivo da 1000 Euro come il Travelmate. Anche una tastiera illuminata dovrebbe essere nella configurazione base. Da citare anche l'autonomia mediocre: un portatile che punta ai professionisti deve offrire di più sotto questo aspetto. Il Travelmate P259-MG andrebbe più visto come un tuttofare da 15.6" per la scrivania di casa che per il business.
Nota: si tratta di una recensione breve, con alcune sezioni non tradotte, per la versione integrale in inglese guardate qui.
Acer TravelMate P259-MG-71UU
-
01/01/2017 v6(old)
Sascha Mölck