 Deutsch
 English
 Español
 Français
 Italiano
 Nederlands
 Polski
 Português
 Русский
 Türkçe
 Svenska
 Chinese
 Magyar
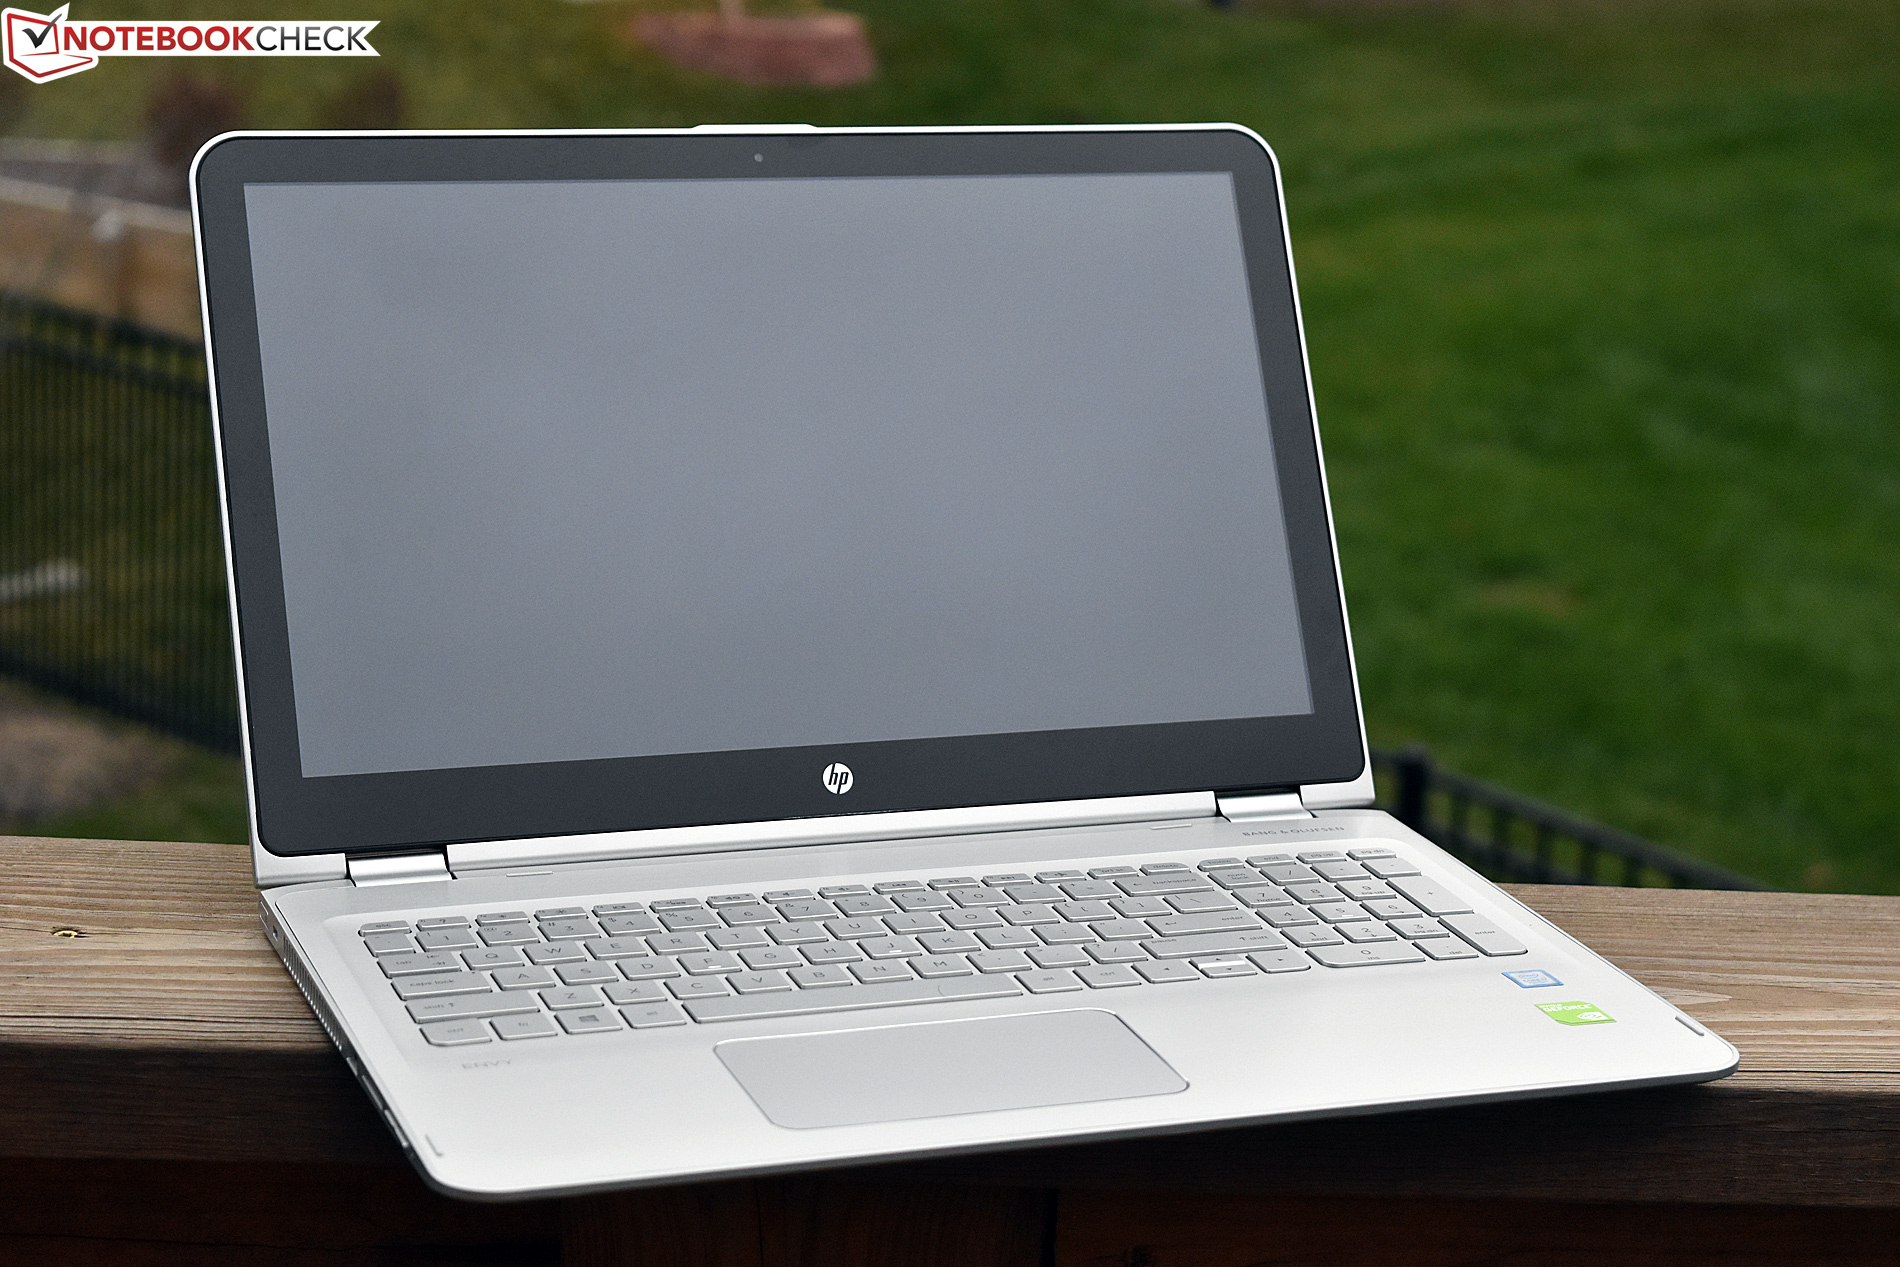
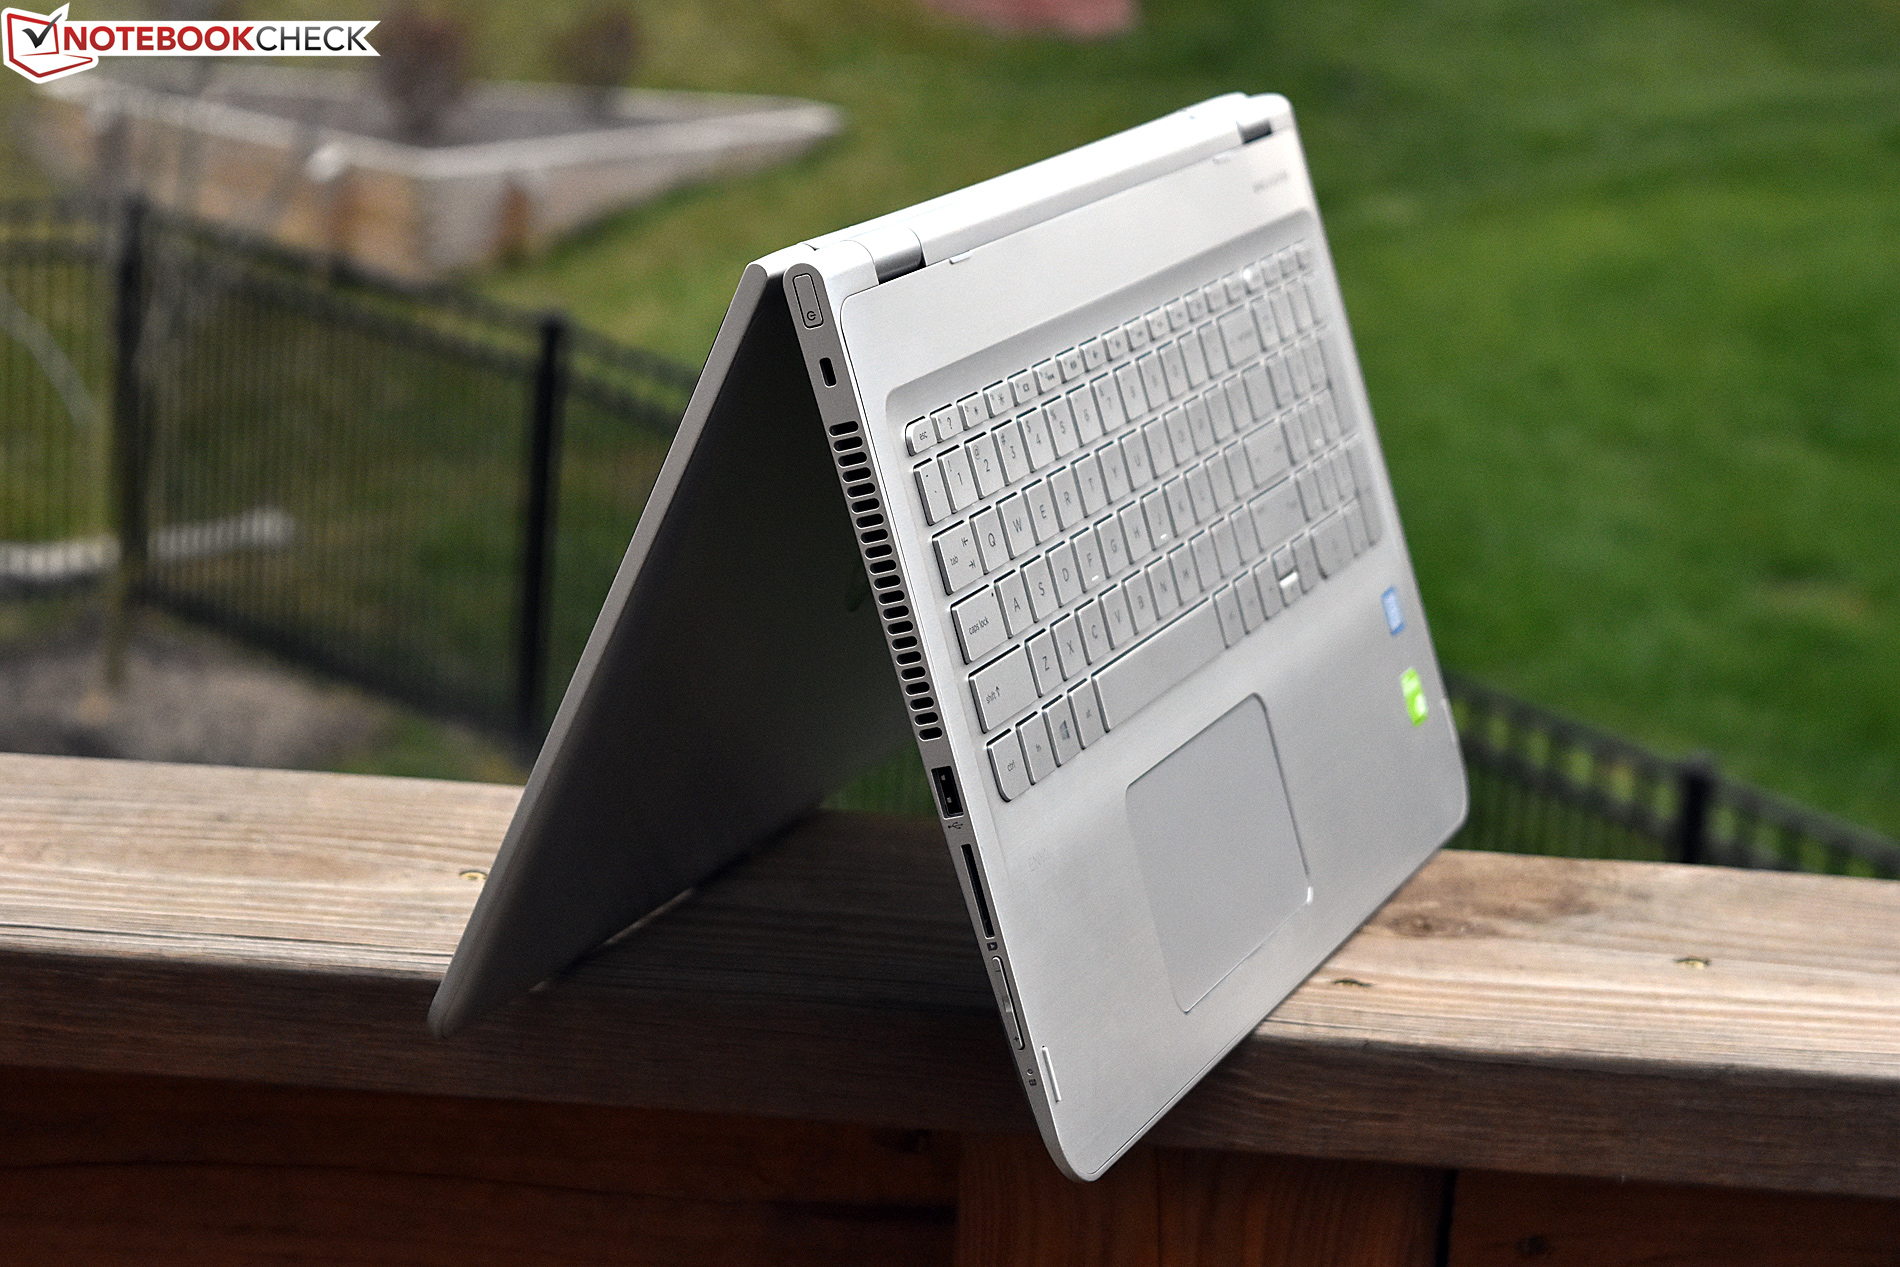
Recensione breve del Convertibile HP Envy x360 15t-w200
| SD Card Reader | |
| average JPG Copy Test (av. of 3 runs) | |
| HP Pavilion 15-bk001ng x360 | |
| Lenovo Yoga 510-15ISK | |
| HP Envy x360 15t-w200 | |
| Dell Inspiron 15 5568 | |
| maximum AS SSD Seq Read Test (1GB) | |
| HP Envy x360 15t-w200 | |
| HP Pavilion 15-bk001ng x360 | |
| Lenovo Yoga 510-15ISK | |
| Dell Inspiron 15 5568 | |
| Networking | |
| iperf3 transmit AX12 | |
| HP Envy x360 15t-w200 | |
| iperf3 receive AX12 | |
| HP Envy x360 15t-w200 | |
| |||||||||||||||||||||||||
Distribuzione della luminosità: 82 %
Al centro con la batteria: 204.9 cd/m²
Contrasto: 1009:1 (Nero: 0.203 cd/m²)
ΔE Color 4.7 | 0.5-29.43 Ø5
ΔE Greyscale 3.86 | 0.57-98 Ø5.3
64% sRGB (Argyll 1.6.3 3D)
41% AdobeRGB 1998 (Argyll 1.6.3 3D)
44.75% AdobeRGB 1998 (Argyll 2.2.0 3D)
65% sRGB (Argyll 2.2.0 3D)
43.31% Display P3 (Argyll 2.2.0 3D)
Gamma: 2.36
| HP Envy x360 15t-w200 BOE0679 , IPS, 15.60, 1920x1080 | HP Pavilion 15-bk001ng x360 Chi Mey CHMN15D3, IPS, 15.60, 1920x1080 | Dell Inspiron 15 5568 AU Optronics B156HW01 V0, IPS, 15.60, 1920x1080 | Lenovo Yoga 510-15ISK BOE HF NV156FHM-N42, IPS, 15.60, 1920x1080 | HP Spectre x360 15-ap012dx IPS, 15.60, 3840x2160 | |
|---|---|---|---|---|---|
| Display | -3% | -12% | -2% | 41% | |
| Display P3 Coverage | 43.31 | 41.84 -3% | 38.04 -12% | 42.58 -2% | 62.8 45% |
| sRGB Coverage | 65 | 62.7 -4% | 57.1 -12% | 63.9 -2% | 88.2 36% |
| AdobeRGB 1998 Coverage | 44.75 | 43.25 -3% | 39.3 -12% | 43.99 -2% | 63.9 43% |
| Response Times | 23% | 25% | 8% | 22% | |
| Response Time Grey 50% / Grey 80% * | 56 ? | 30.8 ? 45% | 42 ? 25% | 43.2 ? 23% | 32.8 ? 41% |
| Response Time Black / White * | 28.8 ? | 22 ? 24% | 22 ? 24% | 30.8 ? -7% | 28 ? 3% |
| PWM Frequency | 201.6 | 200 ? -1% | |||
| Screen | 6% | 1% | 5% | 3% | |
| Brightness middle | 204.9 | 225 10% | 266 30% | 254 24% | 298 45% |
| Brightness | 190 | 210 11% | 249 31% | 230 21% | 295 55% |
| Brightness Distribution | 82 | 85 4% | 85 4% | 86 5% | 88 7% |
| Black Level * | 0.203 | 0.22 -8% | 0.26 -28% | 0.26 -28% | 0.57 -181% |
| Contrast | 1009 | 1023 1% | 1023 1% | 977 -3% | 523 -48% |
| Colorchecker dE 2000 * | 4.7 | 4.13 12% | 4.98 -6% | 4.23 10% | 4.43 6% |
| Colorchecker dE 2000 max. * | 9.03 | 9.36 -4% | 11.82 -31% | 9.5 -5% | 6.62 27% |
| Greyscale dE 2000 * | 3.86 | 2.53 34% | 2.68 31% | 2.87 26% | 2.45 37% |
| Gamma | 2.36 93% | 2.6 85% | 2.27 97% | 2.35 94% | 2.45 90% |
| CCT | 6834 95% | 6360 102% | 6583 99% | 5965 109% | 6326 103% |
| Color Space (Percent of AdobeRGB 1998) | 41 | 39.8 -3% | 36 -12% | 40.35 -2% | 57.2 40% |
| Color Space (Percent of sRGB) | 64 | 62.5 -2% | 57 -11% | 63.48 -1% | 87.8 37% |
| Media totale (Programma / Settaggio) | 9% /
7% | 5% /
1% | 4% /
4% | 22% /
13% |
* ... Meglio usare valori piccoli
Tempi di risposta del Display
| ↔ Tempi di risposta dal Nero al Bianco | ||
|---|---|---|
| 28.8 ms ... aumenta ↗ e diminuisce ↘ combinato | ↗ 6 ms Incremento | 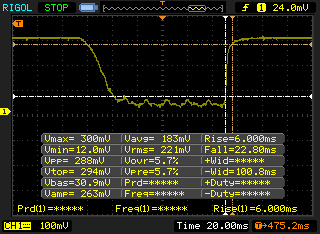 |
| ↘ 22.8 ms Calo | ||
| Lo schermo mostra tempi di risposta relativamente lenti nei nostri tests e potrebbe essere troppo lento per i gamers. In confronto, tutti i dispositivi di test variano da 0.1 (minimo) a 240 (massimo) ms. » 72 % di tutti i dispositivi è migliore. Questo significa che i tempi di risposta rilevati sono peggiori rispetto alla media di tutti i dispositivi testati (21.5 ms). | ||
| ↔ Tempo di risposta dal 50% Grigio all'80% Grigio | ||
| 56 ms ... aumenta ↗ e diminuisce ↘ combinato | ↗ 22.8 ms Incremento | 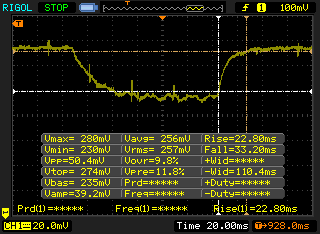 |
| ↘ 33.2 ms Calo | ||
| Lo schermo mostra tempi di risposta lenti nei nostri tests e sarà insoddisfacente per i gamers. In confronto, tutti i dispositivi di test variano da 0.2 (minimo) a 636 (massimo) ms. » 91 % di tutti i dispositivi è migliore. Questo significa che i tempi di risposta rilevati sono peggiori rispetto alla media di tutti i dispositivi testati (33.7 ms). | ||
Sfarfallio dello schermo / PWM (Pulse-Width Modulation)
| flickering dello schermo / PWM rilevato | 201.6 Hz | 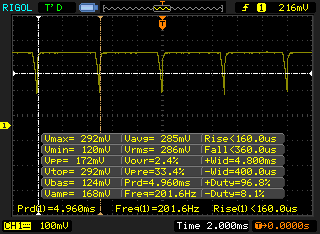 | |
Il display sfarfalla a 201.6 Hz (Probabilmente a causa dell'uso di PWM) . La frequenza di 201.6 Hz è relativamente bassa, quindi gli utenti sensibili potrebbero notare il flickering ed accusare stanchezza agli occhi a questo livello di luminosità e a livelli inferiori. In confronto: 53 % di tutti i dispositivi testati non utilizza PWM per ridurre la luminosita' del display. Se è rilevato PWM, una media di 17900 (minimo: 5 - massimo: 3846000) Hz è stata rilevata. | |||
| Cinebench R11.5 | |
| CPU Single 64Bit | |
| HP Envy x360 15t-w200 | |
| HP Spectre x360 15-ap012dx | |
| Lenovo Yoga 510-15ISK | |
| HP Pavilion 15-bk001ng x360 | |
| CPU Multi 64Bit | |
| HP Envy x360 15t-w200 | |
| HP Spectre x360 15-ap012dx | |
| Lenovo Yoga 510-15ISK | |
| HP Pavilion 15-bk001ng x360 | |
| wPrime 2.10 - 1024m | |
| HP Spectre x360 15-ap012dx | |
| HP Envy x360 15t-w200 | |
| Super Pi Mod 1.5 XS 32M - 32M | |
| HP Spectre x360 15-ap012dx | |
| HP Envy x360 15t-w200 | |
* ... Meglio usare valori piccoli
| PCMark 8 - Home Score Accelerated v2 | |
| Lenovo Yoga 510-15ISK | |
| Dell Inspiron 15 5568 | |
| HP Envy x360 15t-w200 | |
| HP Pavilion 15-bk001ng x360 | |
| HP Spectre x360 15-ap012dx | |
| PCMark 8 Home Score Accelerated v2 | 3236 punti | |
Aiuto | ||
| HP Envy x360 15t-w200 WDC Slim WD10SPCX-24HWST1 | HP Pavilion 15-bk001ng x360 WDC Slim WD10SPCX-21KHST0 | Dell Inspiron 15 5568 Toshiba THNSNK256GCS8 | Lenovo Yoga 510-15ISK Liteonit CV3-DE256 | HP Spectre x360 15-ap012dx Sandisk X300 SD7SN6S-256G-1006 | |
|---|---|---|---|---|---|
| CrystalDiskMark 3.0 | 7% | 8595% | 9131% | 8601% | |
| Read Seq | 104.3 | 106.9 2% | 458.6 340% | 487 367% | 475.6 356% |
| Write Seq | 104.2 | 106 2% | 270 159% | 450.7 333% | 425 308% |
| Read 512 | 31.86 | 33.01 4% | 397.4 1147% | 384.5 1107% | 258.4 711% |
| Write 512 | 48.09 | 51.2 6% | 242 403% | 356.3 641% | 318.9 563% |
| Read 4k | 0.352 | 0.373 6% | 19.88 5548% | 27.05 7585% | 35.48 9980% |
| Write 4k | 1.048 | 1.097 5% | 86.7 8173% | 63.7 5978% | 93 8774% |
| Read 4k QD32 | 0.801 | 1.029 28% | 275.3 34270% | 281.5 35044% | 281.2 35006% |
| Write 4k QD32 | 1.05 | 1.055 0% | 197.6 18719% | 232 21995% | 138.7 13110% |

| 3DMark 11 | |
| 1280x720 Performance GPU | |
| HP Envy x360 15t-w200 | |
| Lenovo Yoga 510-15ISK | |
| Dell Inspiron 15 5568 | |
| HP Spectre x360 15-ap012dx | |
| HP Pavilion 15-bk001ng x360 | |
| 1280x720 Performance Combined | |
| HP Envy x360 15t-w200 | |
| Lenovo Yoga 510-15ISK | |
| Dell Inspiron 15 5568 | |
| HP Spectre x360 15-ap012dx | |
| HP Pavilion 15-bk001ng x360 | |
| 3DMark | |
| 1280x720 Cloud Gate Standard Graphics | |
| Dell Inspiron 15 5568 | |
| HP Envy x360 15t-w200 | |
| HP Spectre x360 15-ap012dx | |
| Lenovo Yoga 510-15ISK | |
| HP Pavilion 15-bk001ng x360 | |
| 1920x1080 Fire Strike Graphics | |
| HP Envy x360 15t-w200 | |
| Lenovo Yoga 510-15ISK | |
| HP Spectre x360 15-ap012dx | |
| HP Pavilion 15-bk001ng x360 | |
| 3DMark 06 Standard Score | 11671 punti | |
| 3DMark 11 Performance | 2286 punti | |
| 3DMark Ice Storm Standard Score | 42360 punti | |
| 3DMark Cloud Gate Standard Score | 6639 punti | |
| 3DMark Fire Strike Score | 1340 punti | |
Aiuto | ||
| Batman: Arkham Knight | |
| 1280x720 Low / Off AF:Trilinear (ordina per valore) | |
| HP Envy x360 15t-w200 | |
| Lenovo Yoga 510-15ISK | |
| HP Envy 15-w103ng x360 | |
| 1366x768 Normal / Off AF:4x (ordina per valore) | |
| HP Envy x360 15t-w200 | |
| Lenovo Yoga 510-15ISK | |
| HP Envy 15-w103ng x360 | |
| 1920x1080 High / On (Interactive Smoke & Paper Debris Off) AA:SM AF:8x (ordina per valore) | |
| HP Envy x360 15t-w200 | |
| Lenovo Yoga 510-15ISK | |
| HP Envy 15-w103ng x360 | |
| Metro: Last Light | |
| 1024x768 Low (DX10) AF:4x (ordina per valore) | |
| HP Envy x360 15t-w200 | |
| Lenovo Yoga 510-15ISK | |
| 1366x768 Medium (DX10) AF:4x (ordina per valore) | |
| HP Envy x360 15t-w200 | |
| Lenovo Yoga 510-15ISK | |
| 1366x768 High (DX11) AF:16x (ordina per valore) | |
| HP Envy x360 15t-w200 | |
| Lenovo Yoga 510-15ISK | |
| basso | medio | alto | ultra | |
| BioShock Infinite (2013) | 63 | 46 | 46 | 13 |
| Metro: Last Light (2013) | 43 | 34 | 21 | |
| Batman: Arkham Knight (2015) | 27 | 23 | 11 |
Rumorosità
| Idle |
| 33.8 / 33.9 / 34.2 dB(A) |
| Sotto carico |
| 36 / 44 dB(A) |
 | ||
30 dB silenzioso 40 dB(A) udibile 50 dB(A) rumoroso |
||
min: | ||
| HP Envy x360 15t-w200 GeForce 930MX, i7-7500U, WDC Slim WD10SPCX-24HWST1 | HP Pavilion 15-bk001ng x360 HD Graphics 520, 6200U, WDC Slim WD10SPCX-21KHST0 | Dell Inspiron 15 5568 HD Graphics 520, 6500U, Toshiba THNSNK256GCS8 | Lenovo Yoga 510-15ISK Radeon R7 M460, 6200U, Liteonit CV3-DE256 | HP Spectre x360 15-ap012dx HD Graphics 520, 6200U, Sandisk X300 SD7SN6S-256G-1006 | |
|---|---|---|---|---|---|
| Noise | 7% | 3% | 9% | 8% | |
| off /ambiente * | 30.2 | 28.9 4% | 31.2 -3% | 29 4% | 29.5 2% |
| Idle Minimum * | 33.8 | 29.6 12% | 32.8 3% | 29 14% | 29.5 13% |
| Idle Average * | 33.9 | 29.6 13% | 32.8 3% | 29 14% | 29.5 13% |
| Idle Maximum * | 34.2 | 30.2 12% | 33.8 1% | 29 15% | 29.6 13% |
| Load Average * | 36 | 39 -8% | 36.3 -1% | 35.9 -0% | 38.1 -6% |
| Load Maximum * | 44 | 39.9 9% | 36.3 17% | 41 7% | 38.2 13% |
* ... Meglio usare valori piccoli
(+) La temperatura massima sul lato superiore è di 34 °C / 93 F, rispetto alla media di 35.3 °C / 96 F, che varia da 19.6 a 55.7 °C per questa classe Convertible.
(+) Il lato inferiore si riscalda fino ad un massimo di 38 °C / 100 F, rispetto alla media di 36.7 °C / 98 F
(+) In idle, la temperatura media del lato superiore è di 22.9 °C / 73 F, rispetto alla media deld ispositivo di 30.2 °C / 86 F.
(+) I poggiapolsi e il touchpad sono piu' freddi della temperatura della pelle con un massimo di 23.2 °C / 73.8 F e sono quindi freddi al tatto.
(+) La temperatura media della zona del palmo della mano di dispositivi simili e'stata di 28.1 °C / 82.6 F (+4.9 °C / 8.8 F).
HP Envy x360 15t-w200 analisi audio
(±) | potenza degli altiparlanti media ma buona (72.8 dB)
Bassi 100 - 315 Hz
(-) | quasi nessun basso - in media 15.8% inferiori alla media
(-) | bassi non lineari (16.6% delta rispetto alla precedente frequenza)
Medi 400 - 2000 Hz
(+) | medi bilanciati - solo only 3.8% rispetto alla media
(±) | linearità dei medi adeguata (9.5% delta rispetto alla precedente frequenza)
Alti 2 - 16 kHz
(+) | Alti bilanciati - appena 4.4% dalla media
(+) | alti lineari (6.9% delta rispetto alla precedente frequenza)
Nel complesso 100 - 16.000 Hz
(±) | la linearità complessiva del suono è media (24.1% di differenza rispetto alla media
Rispetto alla stessa classe
» 70% di tutti i dispositivi testati in questa classe è stato migliore, 5% simile, 24% peggiore
» Il migliore ha avuto un delta di 6%, medio di 21%, peggiore di 57%
Rispetto a tutti i dispositivi testati
» 68% di tutti i dispositivi testati in questa classe è stato migliore, 7% similare, 25% peggiore
» Il migliore ha avuto un delta di 4%, medio di 25%, peggiore di 134%
Lenovo Yoga 510-15ISK analisi audio
(±) | potenza degli altiparlanti media ma buona (76.9 dB)
Bassi 100 - 315 Hz
(±) | bassi ridotti - in media 12.5% inferiori alla media
(-) | bassi non lineari (16.4% delta rispetto alla precedente frequenza)
Medi 400 - 2000 Hz
(±) | medi elevati - circa 8.2% superiore alla media
(+) | medi lineari (4.5% delta rispetto alla precedente frequenza)
Alti 2 - 16 kHz
(+) | Alti bilanciati - appena 2.7% dalla media
(±) | la linearità degli alti è media (9.8% delta rispetto alla precedente frequenza)
Nel complesso 100 - 16.000 Hz
(±) | la linearità complessiva del suono è media (24% di differenza rispetto alla media
Rispetto alla stessa classe
» 70% di tutti i dispositivi testati in questa classe è stato migliore, 5% simile, 25% peggiore
» Il migliore ha avuto un delta di 6%, medio di 21%, peggiore di 57%
Rispetto a tutti i dispositivi testati
» 68% di tutti i dispositivi testati in questa classe è stato migliore, 7% similare, 25% peggiore
» Il migliore ha avuto un delta di 4%, medio di 25%, peggiore di 134%
| Off / Standby | |
| Idle | |
| Sotto carico |
|
Leggenda:
min: Attualmente utilizziamo il Metrahit Energy, un multimetro digitale professionale per la misurazione della qualità della potenza e dell'energia monofase, per le nostre misurazioni. | |
| HP Envy x360 15t-w200 i7-7500U, GeForce 930MX, WDC Slim WD10SPCX-24HWST1, IPS, 1920x1080, 15.60 | HP Pavilion 15-bk001ng x360 6200U, HD Graphics 520, WDC Slim WD10SPCX-21KHST0, IPS, 1920x1080, 15.60 | Dell Inspiron 15 5568 6500U, HD Graphics 520, Toshiba THNSNK256GCS8, IPS, 1920x1080, 15.60 | Lenovo Yoga 510-15ISK 6200U, Radeon R7 M460, Liteonit CV3-DE256, IPS, 1920x1080, 15.60 | HP Spectre x360 15-ap012dx 6200U, HD Graphics 520, Sandisk X300 SD7SN6S-256G-1006, IPS, 3840x2160, 15.60 | |
|---|---|---|---|---|---|
| Power Consumption | 5% | 9% | -6% | -34% | |
| Idle Minimum * | 5 | 4.3 14% | 4.34 13% | 4 20% | 6.5 -30% |
| Idle Average * | 8.3 | 8.2 1% | 7.5 10% | 7.5 10% | 13.3 -60% |
| Idle Maximum * | 7.8 | 9 -15% | 8.4 -8% | 8.1 -4% | 15.1 -94% |
| Load Average * | 28.8 | 29.8 -3% | 30.4 -6% | 40.8 -42% | 30.8 -7% |
| Load Maximum * | 49.7 | 36.4 27% | 32.5 35% | 57.3 -15% | 38.5 23% |
* ... Meglio usare valori piccoli
| HP Envy x360 15t-w200 i7-7500U, GeForce 930MX, 48 Wh | HP Pavilion 15-bk001ng x360 6200U, HD Graphics 520, 48 Wh | Dell Inspiron 15 5568 6500U, HD Graphics 520, 42 Wh | Lenovo Yoga 510-15ISK 6200U, Radeon R7 M460, 35 Wh | HP Spectre x360 15-ap012dx 6200U, HD Graphics 520, 65 Wh | |
|---|---|---|---|---|---|
| Autonomia della batteria | 25% | -11% | 11% | 24% | |
| Reader / Idle | 635 | 449 -29% | 730 15% | 705 11% | |
| WiFi v1.3 | 320 | 401 25% | 299 -7% | 335 5% | 431 35% |
| Load | 89 | 93 4% | 100 12% | 113 27% |
Pro
Contro
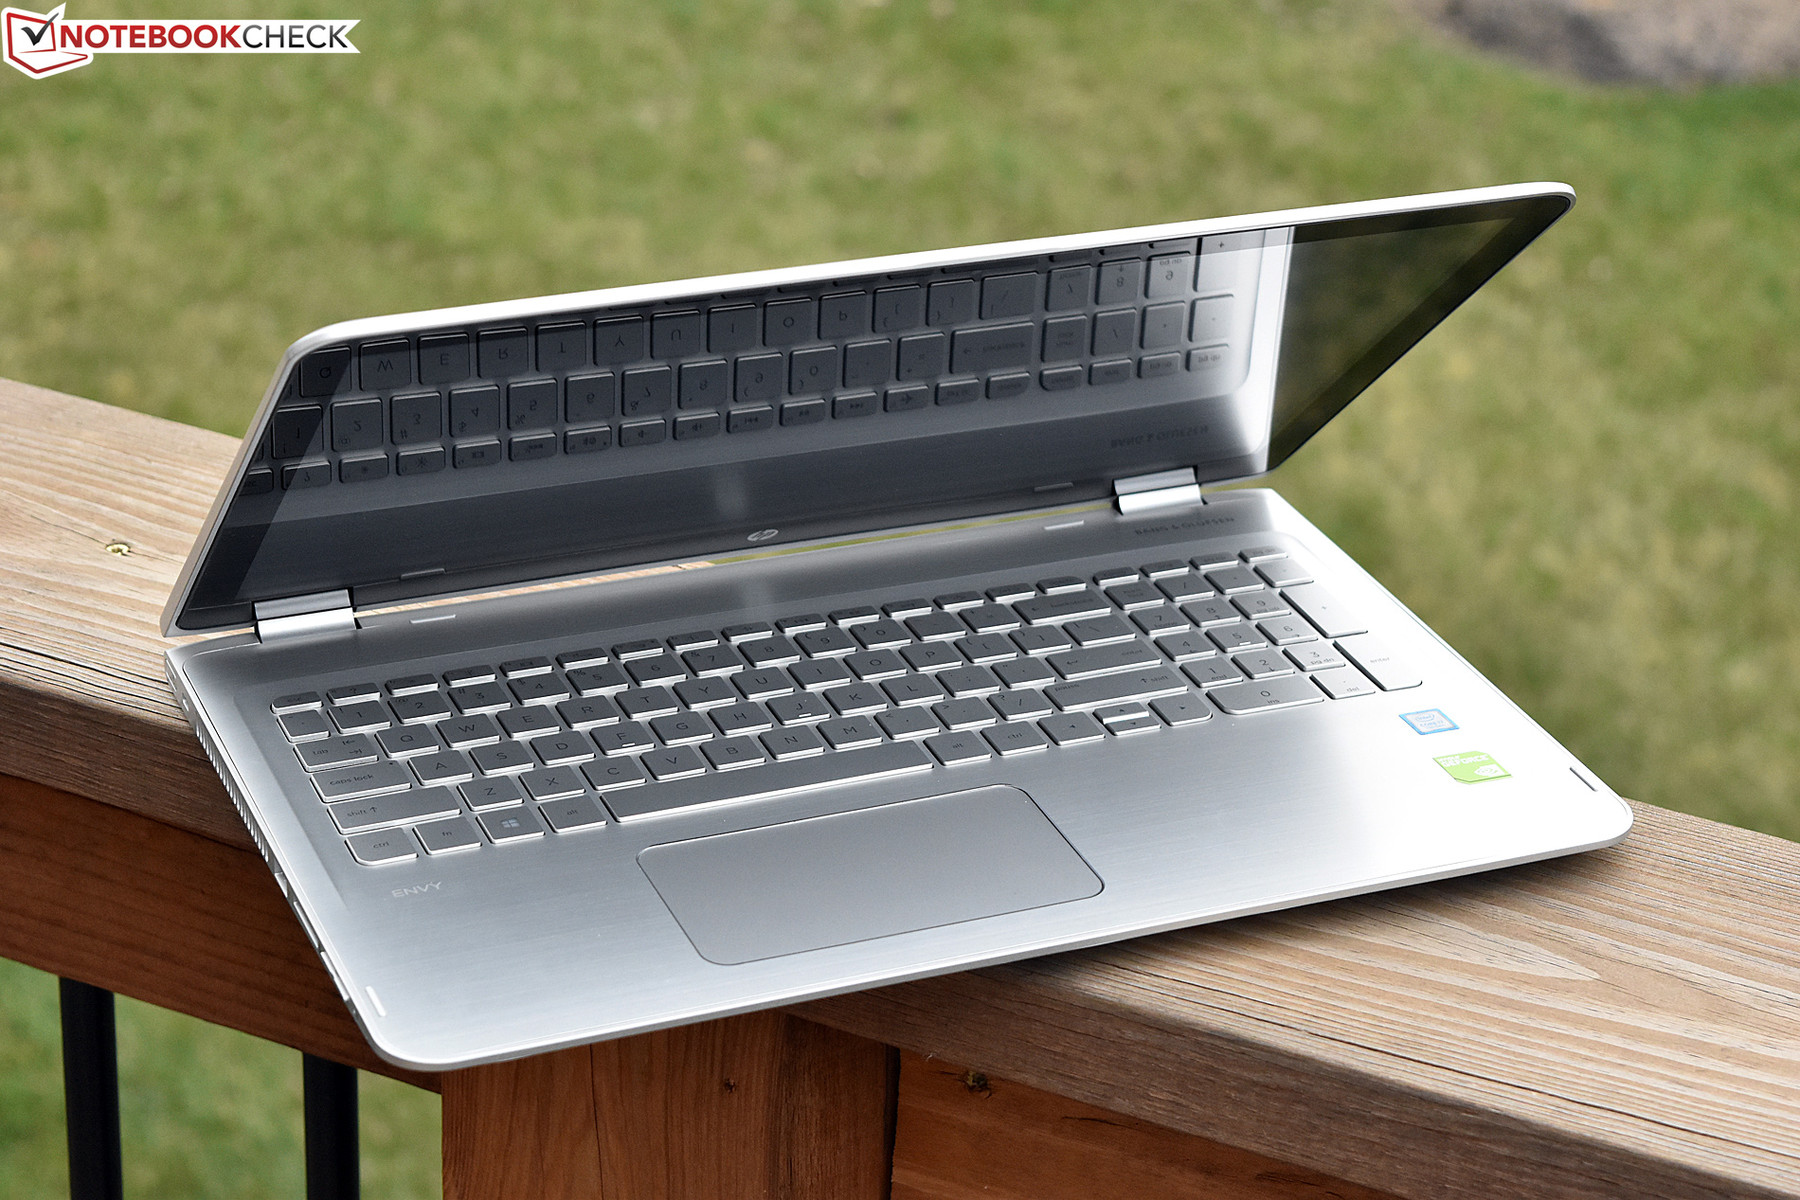

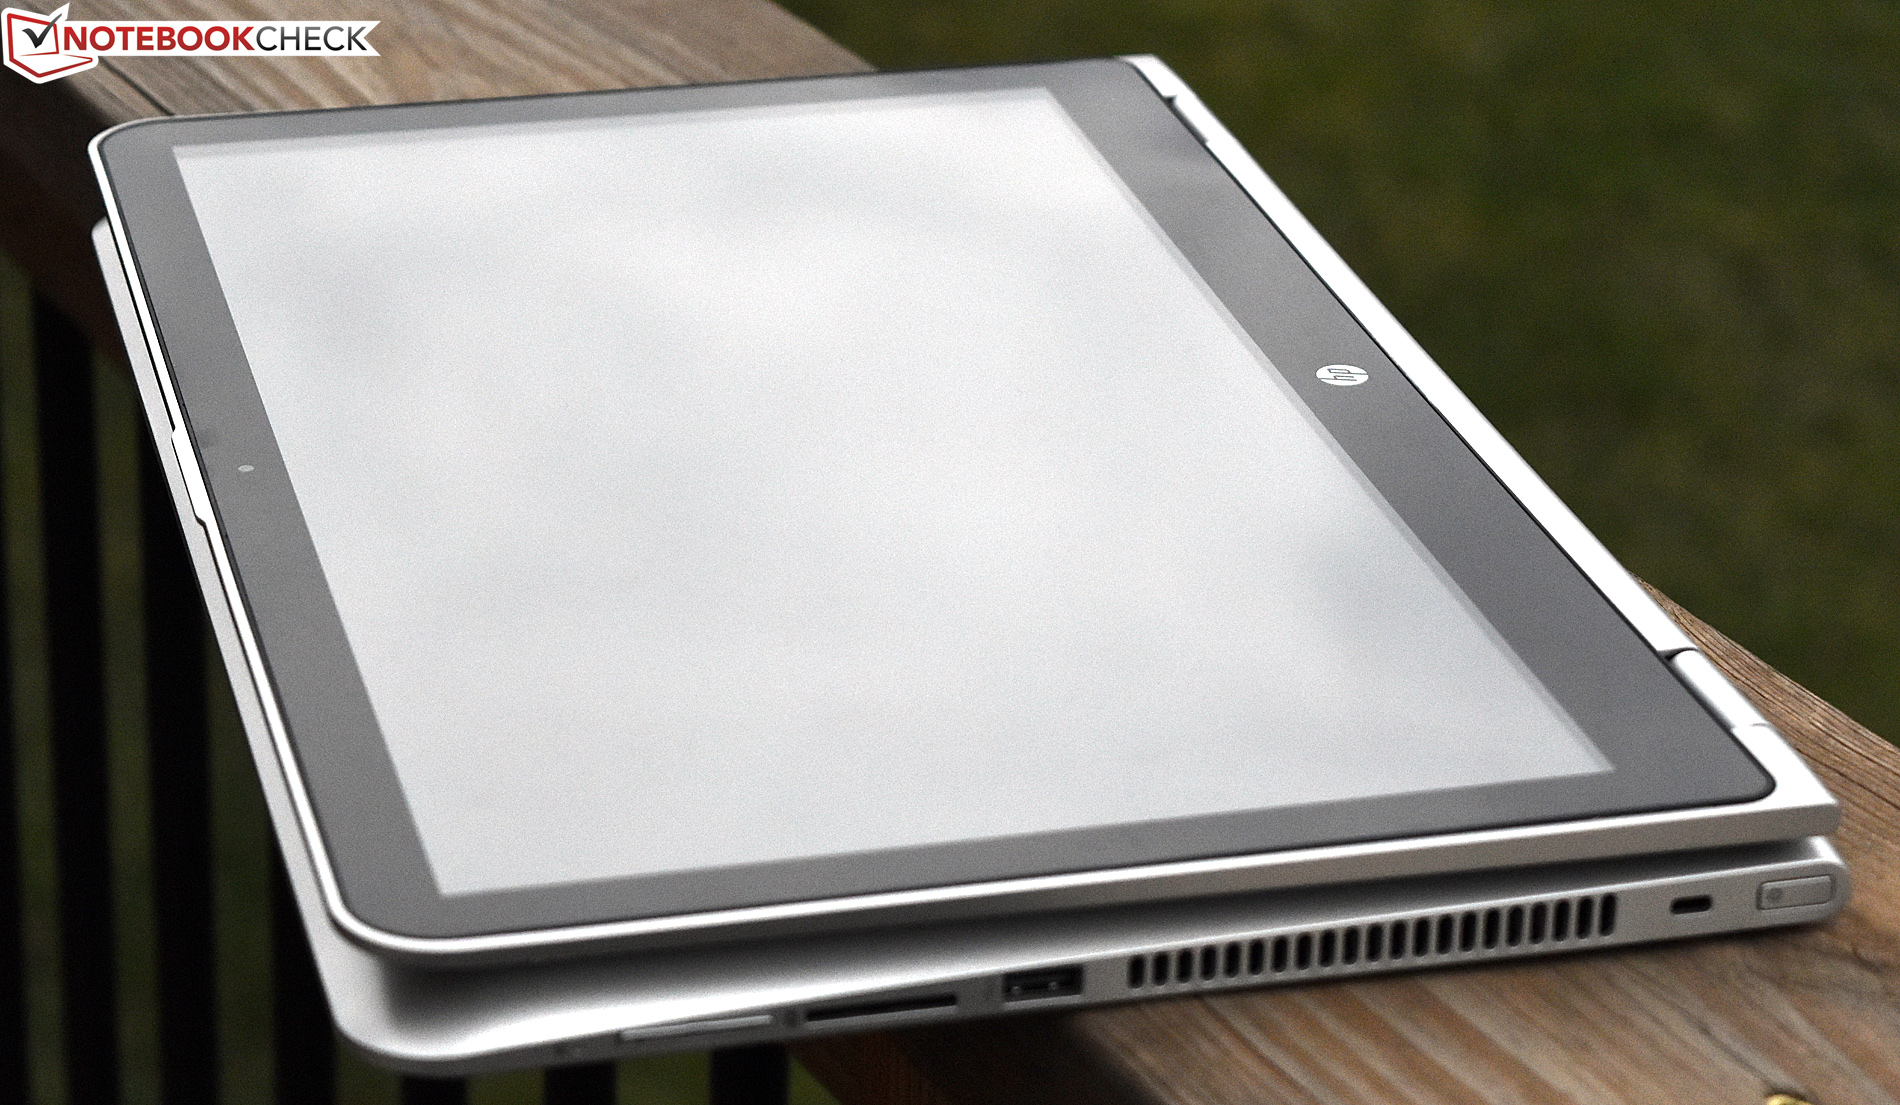
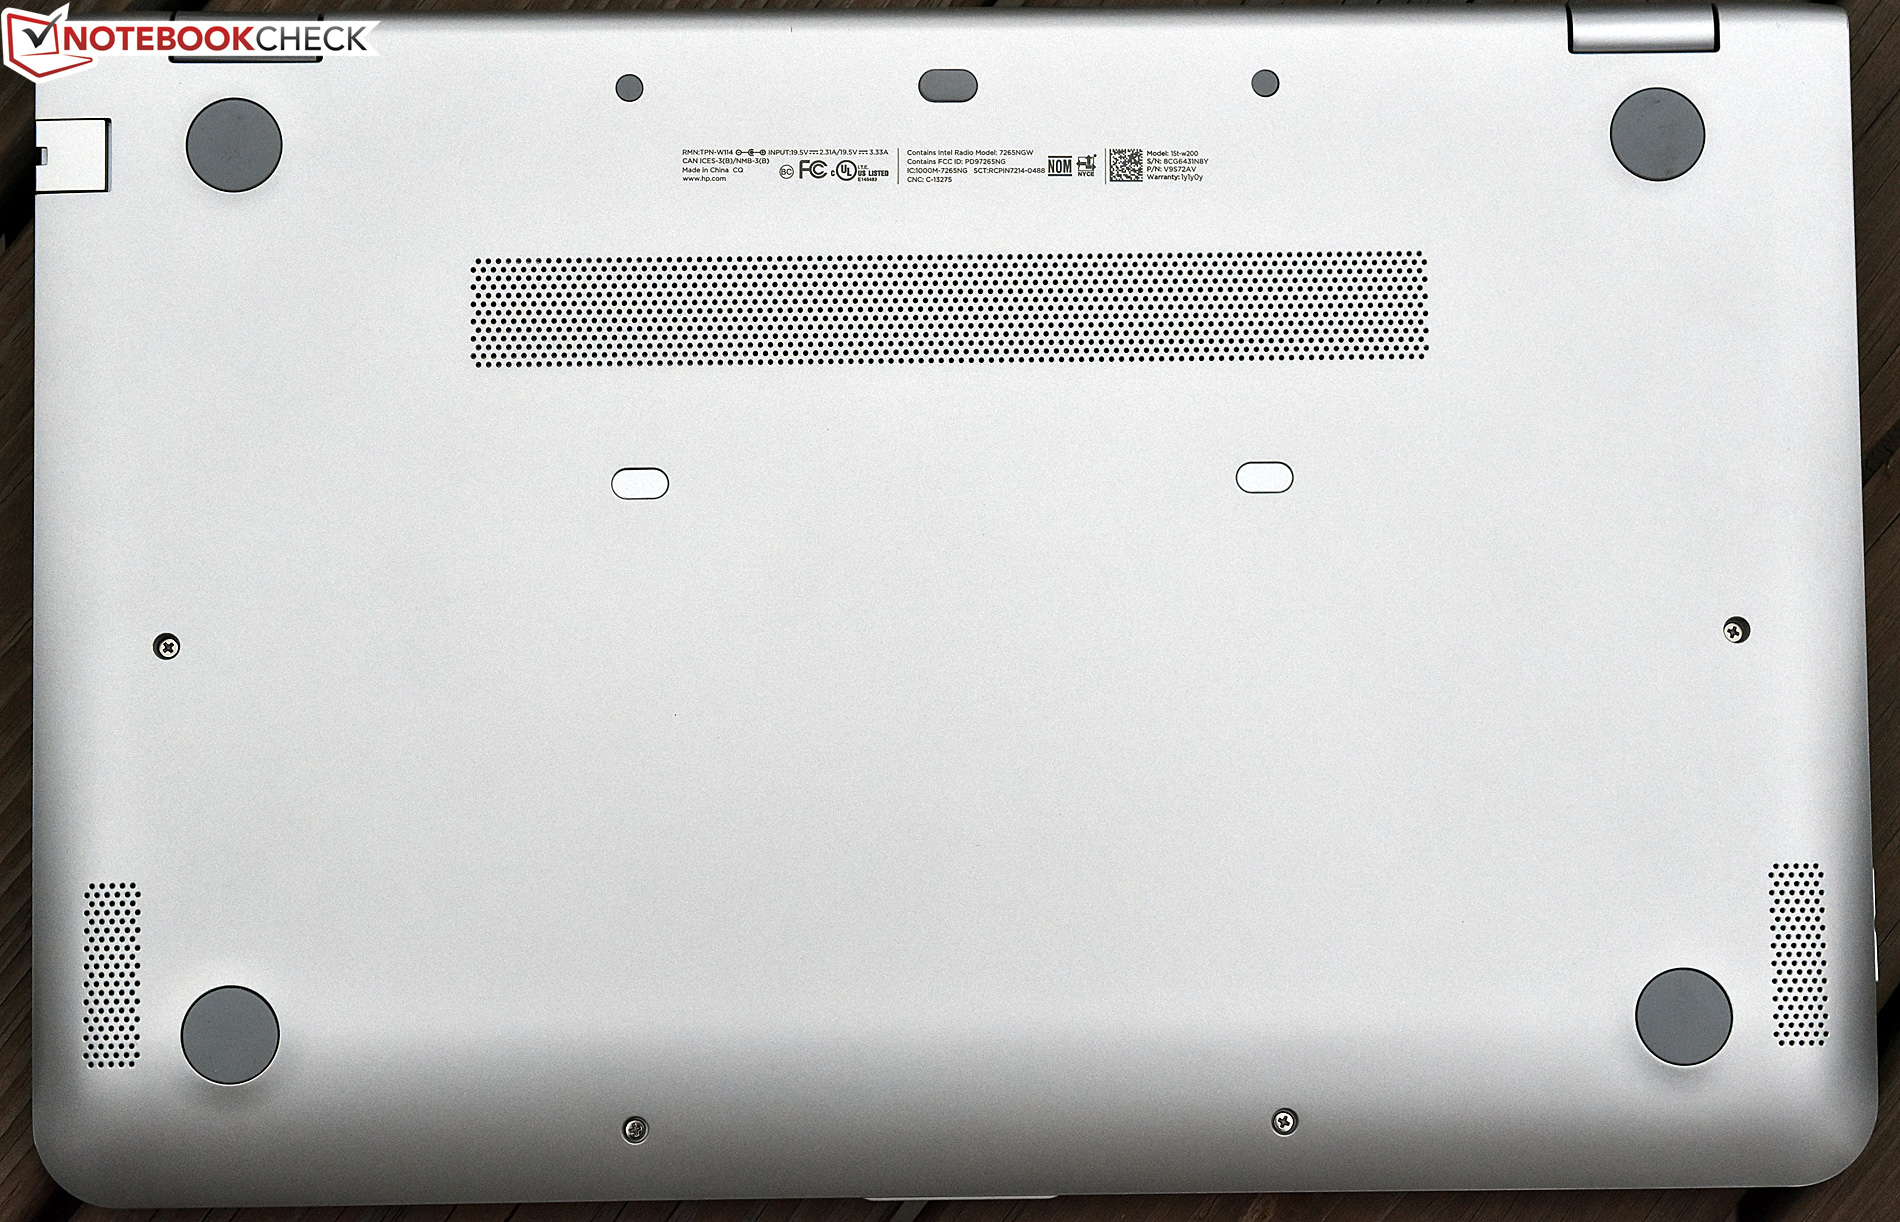
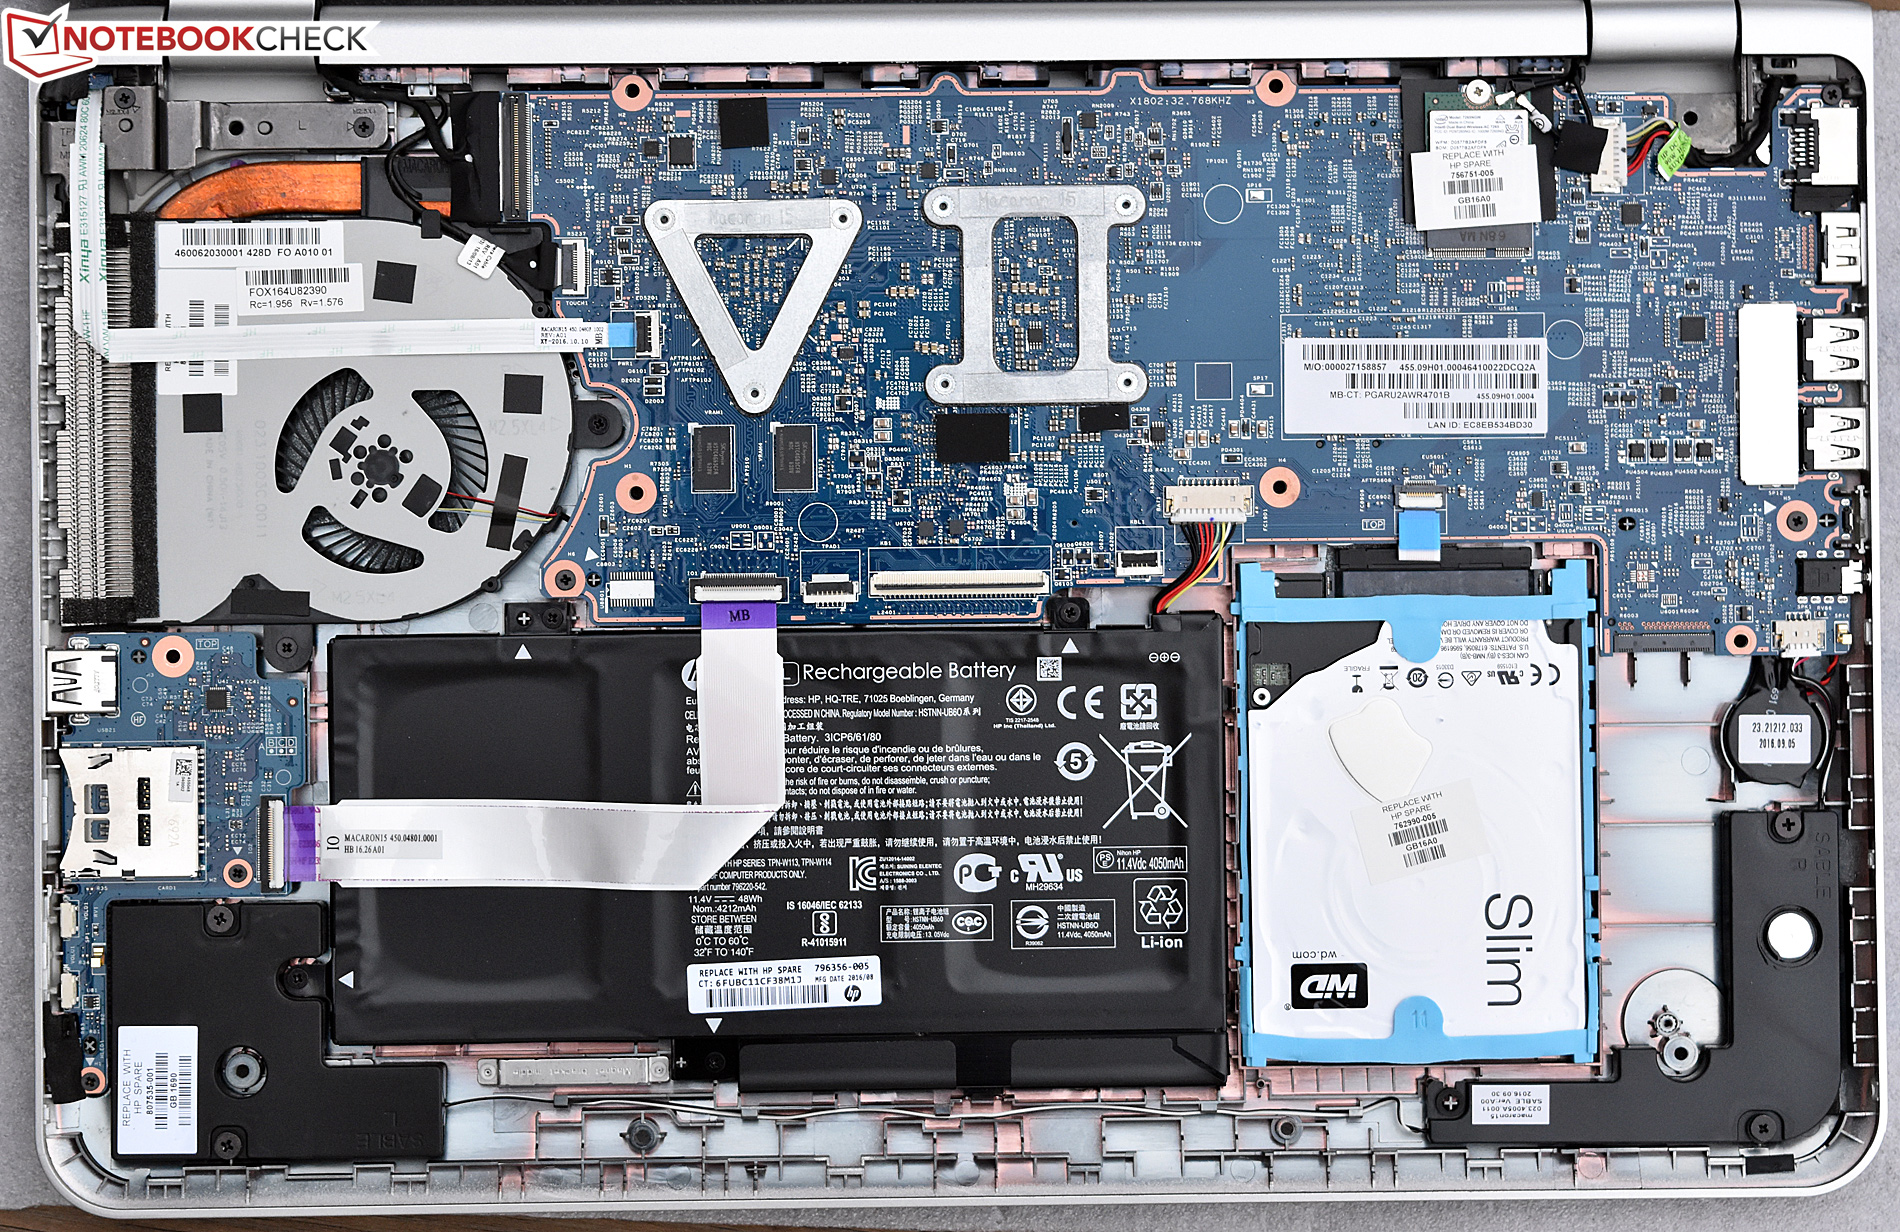
Tuttofare. L'HP Envy x360 15t-w200 sembra fermo al 2014; è così determinato a portare avanti il concetto di convertibile che sembra non vedere il fatto che è una macchina da 15.6" così pesante e con una autonomia di nemmeno 5 ore. Il touchscreen è LCD è lucido e scuro e quindi i riflessi sono un problema. L'hard disk da 5400 RPM è lento e non regge il confronto con gli SSD. Nemmeno gli upgrades sono facili da fare e richiedono uno smontaggio fastidioso.
Un tuttofare che non eccelle; l'HP Envy x360 15t-w200 sembra fermo al 2014.
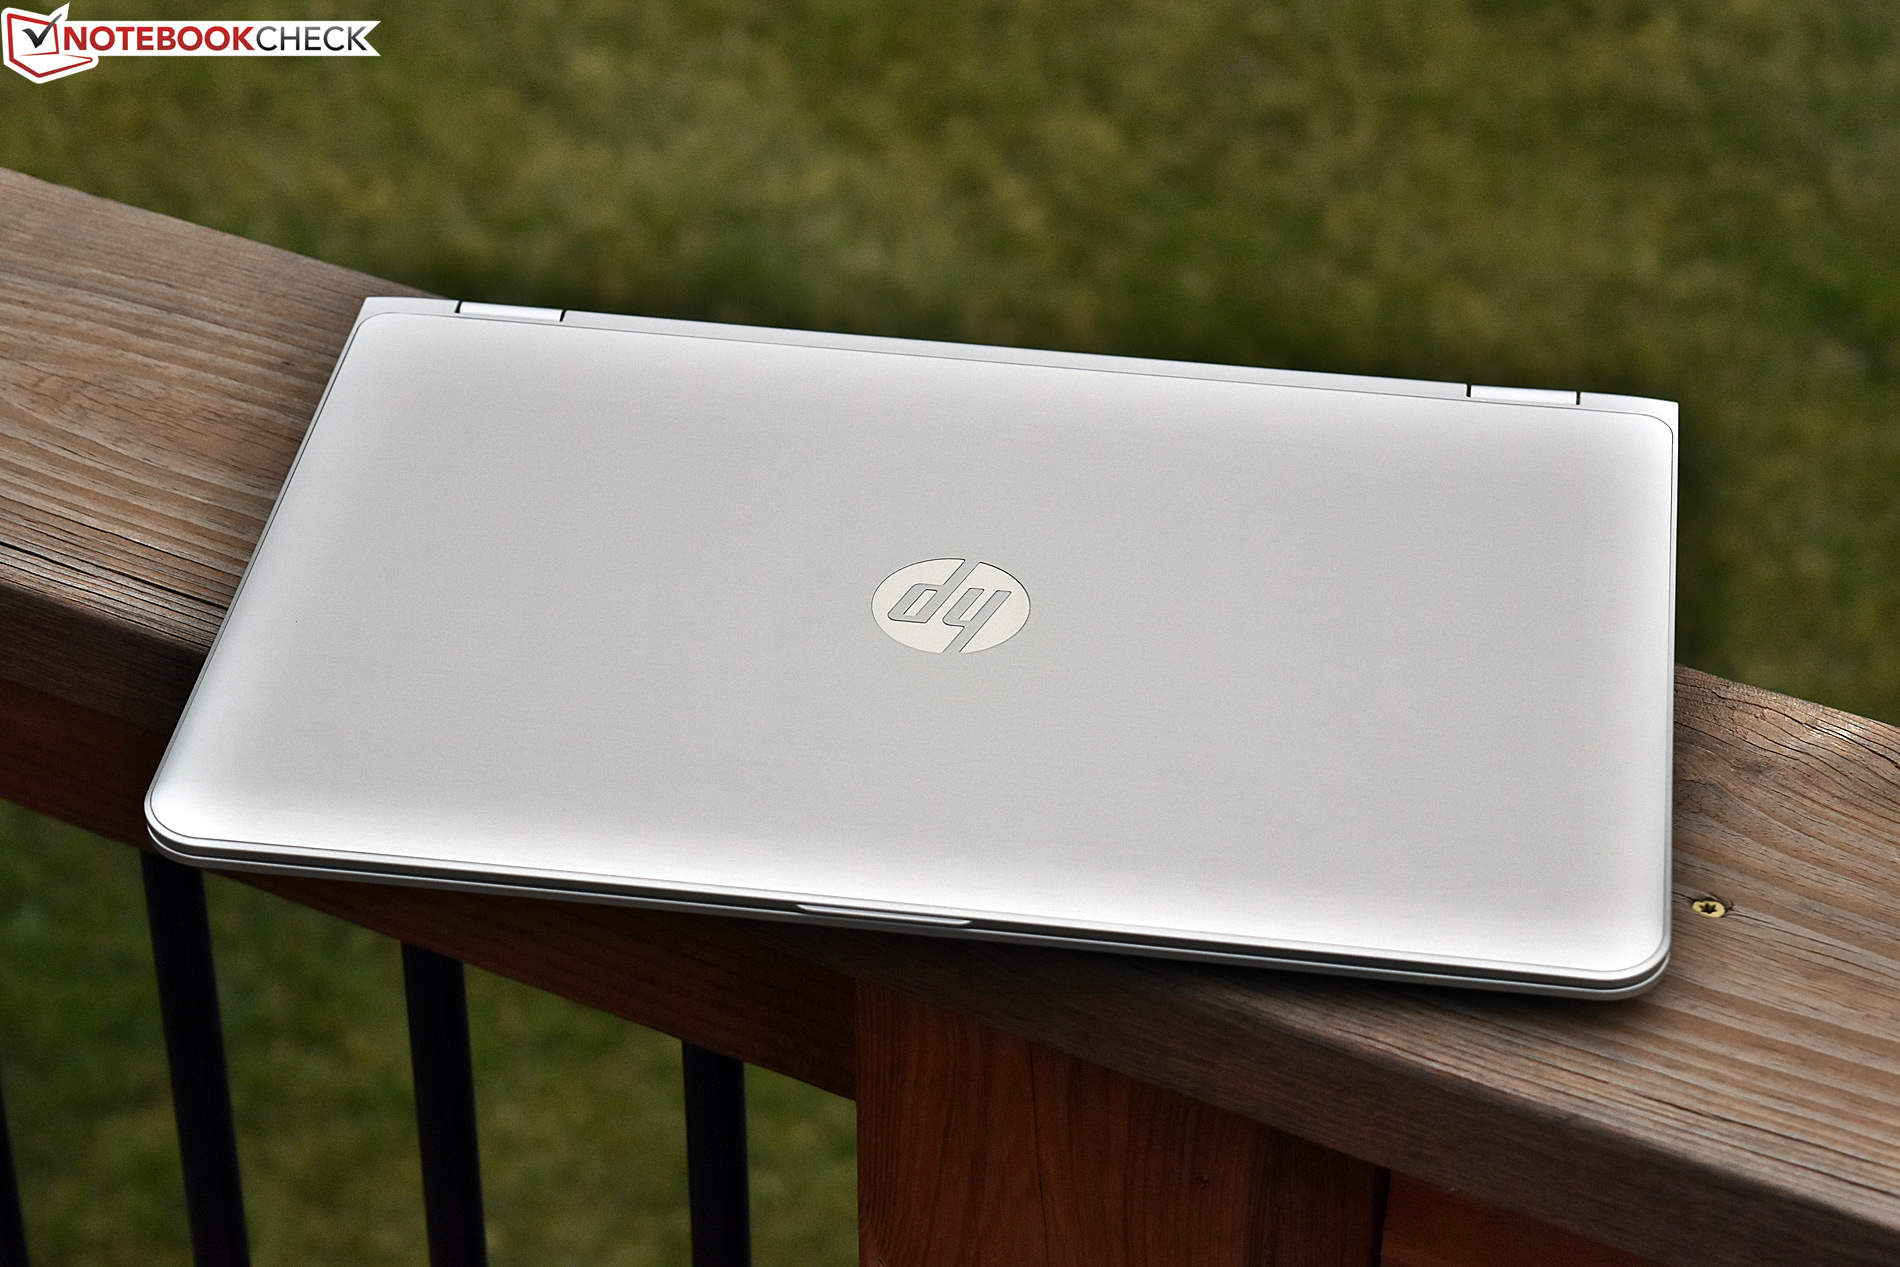
Di positivo è una macchina che resta fresca e silenziosa (grazie anche al limite del TDP), e il case è attraente e solido, nonostante la costruzione ibrida in plastica e metallo. Anche le prestazioni GPU sono stabili anche con carico di lavoro. Nonostante questi aspetti positivi, ci sono molti altri aspetti negativi.
Gli utenti interessanti in un eccellente convertibile dovrebbero considerare un HP Spectre x360.
Nota: si tratta di una recensione breve, con alcune sezioni non tradotte, per la versione integrale in inglese guardate qui.
HP Envy x360 15t-w200
-
12/16/2016 v6(old)
Steve Schardein
Pricecompare
