 Deutsch
 English
 Español
 Français
 Italiano
 Nederlands
 Polski
 Português
 Русский
 Türkçe
 Svenska
 Chinese
 Magyar
Recensione breve del Convertibile Asus Transformer 3 Pro T303UA-GN050T


| |||||||||||||||||||||||||
Distribuzione della luminosità: 91 %
Al centro con la batteria: 316 cd/m²
Contrasto: 1090:1 (Nero: 0.29 cd/m²)
ΔE Color 3.91 | 0.5-29.43 Ø5
ΔE Greyscale 5.37 | 0.57-98 Ø5.3
98% sRGB (Argyll 1.6.3 3D)
72% AdobeRGB 1998 (Argyll 1.6.3 3D)
82.2% AdobeRGB 1998 (Argyll 2.2.0 3D)
98.3% sRGB (Argyll 2.2.0 3D)
81.8% Display P3 (Argyll 2.2.0 3D)
Gamma: 2.36
| Asus Transformer 3 Pro T303UA-GN050T BOE BOE06AC (NV126A1M-N51), , 2880x1920, 12.60 | Microsoft Surface Pro 4, Core m3 Samsung SDC3853, , 2736x1824, 12.30 | Lenovo ThinkPad X1 Yoga-20FRS1VS00 Samsung ATNA40JU01-0, , 2560x1440, 14.00 | HP Elite x2 1012 G1 LG Philips, , 1920x1280, 12.10 | Acer Aspire Switch Alpha 12 SA5-271-56HM Panasonic VVX12T041N00, , 2160x1440, 12.00 | |
|---|---|---|---|---|---|
| Display | -12% | -31% | -14% | ||
| Display P3 Coverage | 81.8 | 67.5 -17% | 53.8 -34% | 65.5 -20% | |
| sRGB Coverage | 98.3 | 96.6 -2% | 73.7 -25% | 96.1 -2% | |
| AdobeRGB 1998 Coverage | 82.2 | 69 -16% | 53.8 -35% | 66.9 -19% | |
| Response Times | -45% | 71% | 5% | 139% | |
| Response Time Grey 50% / Grey 80% * | 30 ? | 46 ? -53% | 1 ? 97% | 33.2 ? -11% | 20 ? 33% |
| Response Time Black / White * | 29 ? | 31 ? -7% | 1 ? 97% | 22.8 ? 21% | 34 ? -17% |
| PWM Frequency | 200 ? | 50 ? -75% | 240 ? 20% | 1000 ? 400% | |
| Screen | 13% | -3% | -22% | -21% | |
| Brightness middle | 316 | 389.2 23% | 279 -12% | 322 2% | 345 9% |
| Brightness | 307 | 392 28% | 277 -10% | 319 4% | 328 7% |
| Brightness Distribution | 91 | 92 1% | 91 0% | 97 7% | 91 0% |
| Black Level * | 0.29 | 0.27 7% | 0.42 -45% | 0.38 -31% | |
| Contrast | 1090 | 1441 32% | 767 -30% | 908 -17% | |
| Colorchecker dE 2000 * | 3.91 | 3.61 8% | 5.15 -32% | 6.02 -54% | 8.4 -115% |
| Colorchecker dE 2000 max. * | 7.9 | 8.28 -5% | 10.06 -27% | 11.9 -51% | |
| Greyscale dE 2000 * | 5.37 | 3.8 29% | 5.44 -1% | 6.29 -17% | 4.3 20% |
| Gamma | 2.36 93% | 2.16 102% | 2.28 96% | 2.4 92% | 2.63 84% |
| CCT | 7812 83% | 5969 109% | 5686 114% | 7712 84% | 7368 88% |
| Color Space (Percent of AdobeRGB 1998) | 72 | 63 -12% | 98 36% | 47.8 -34% | 62 -14% |
| Color Space (Percent of sRGB) | 98 | 97 -1% | 100 2% | 73.2 -25% | |
| Media totale (Programma / Settaggio) | -15% /
-4% | 34% /
17% | -16% /
-20% | 35% /
12% |
* ... Meglio usare valori piccoli
Tempi di risposta del Display
| ↔ Tempi di risposta dal Nero al Bianco | ||
|---|---|---|
| 29 ms ... aumenta ↗ e diminuisce ↘ combinato | ↗ 8 ms Incremento | 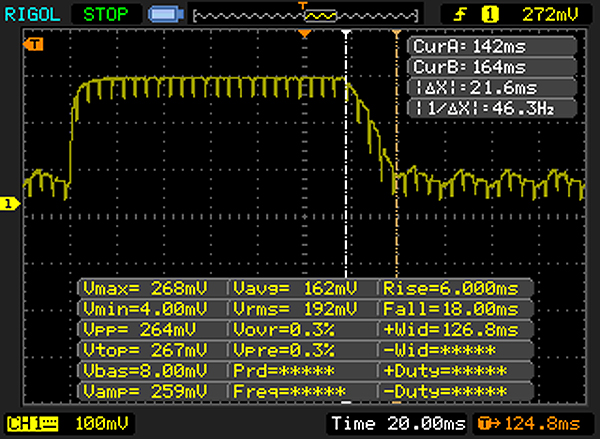 |
| ↘ 21 ms Calo | ||
| Lo schermo mostra tempi di risposta relativamente lenti nei nostri tests e potrebbe essere troppo lento per i gamers. In confronto, tutti i dispositivi di test variano da 0.1 (minimo) a 240 (massimo) ms. » 73 % di tutti i dispositivi è migliore. Questo significa che i tempi di risposta rilevati sono peggiori rispetto alla media di tutti i dispositivi testati (21.5 ms). | ||
| ↔ Tempo di risposta dal 50% Grigio all'80% Grigio | ||
| 30 ms ... aumenta ↗ e diminuisce ↘ combinato | ↗ 14 ms Incremento | 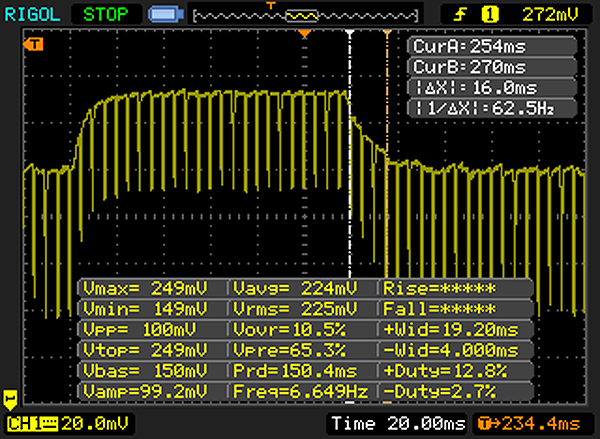 |
| ↘ 16 ms Calo | ||
| Lo schermo mostra tempi di risposta lenti nei nostri tests e sarà insoddisfacente per i gamers. In confronto, tutti i dispositivi di test variano da 0.2 (minimo) a 636 (massimo) ms. » 34 % di tutti i dispositivi è migliore. Questo significa che i tempi di risposta rilevati sono migliori rispettto alla media di tutti i dispositivi testati (33.7 ms). | ||
Sfarfallio dello schermo / PWM (Pulse-Width Modulation)
| flickering dello schermo / PWM rilevato | 200 Hz | ≤ 90 % settaggio luminosita' | 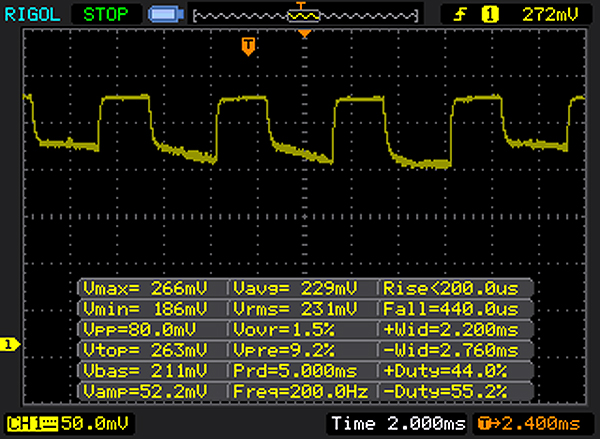 |
Il display sfarfalla a 200 Hz (Probabilmente a causa dell'uso di PWM) Flickering rilevato ad una luminosita' di 90 % o inferiore. Non dovrebbe verificarsi flickering o PWM sopra questo valore di luminosita'. La frequenza di 200 Hz è relativamente bassa, quindi gli utenti sensibili potrebbero notare il flickering ed accusare stanchezza agli occhi a questo livello di luminosità e a livelli inferiori. In confronto: 53 % di tutti i dispositivi testati non utilizza PWM per ridurre la luminosita' del display. Se è rilevato PWM, una media di 17924 (minimo: 5 - massimo: 3846000) Hz è stata rilevata. | |||
| Cinebench R10 | |
| Rendering Single CPUs 64Bit | |
| Asus Transformer 3 Pro T303UA-GN050T | |
| Microsoft Surface Pro 4, Core m3 | |
| Rendering Multiple CPUs 64Bit | |
| Asus Transformer 3 Pro T303UA-GN050T | |
| Microsoft Surface Pro 4, Core m3 | |
| JetStream 1.1 - Total Score | |
| Asus Transformer 3 Pro T303UA-GN050T | |
| Lenovo ThinkPad X1 Yoga-20FRS1VS00 | |
| HP Elite x2 1012 G1 | |
| Acer Aspire Switch Alpha 12 SA5-271-56HM | |
| Octane V2 - Total Score | |
| Lenovo ThinkPad X1 Yoga-20FRS1VS00 | |
| Asus Transformer 3 Pro T303UA-GN050T | |
| HP Elite x2 1012 G1 | |
| Acer Aspire Switch Alpha 12 SA5-271-56HM | |
| Mozilla Kraken 1.1 - Total | |
| Microsoft Surface Pro 4, Core m3 | |
| Acer Aspire Switch Alpha 12 SA5-271-56HM | |
| HP Elite x2 1012 G1 | |
| Asus Transformer 3 Pro T303UA-GN050T | |
| Lenovo ThinkPad X1 Yoga-20FRS1VS00 | |
* ... Meglio usare valori piccoli
| PCMark 7 | |
| Score | |
| Asus Transformer 3 Pro T303UA-GN050T | |
| HP Elite x2 1012 G1 | |
| Microsoft Surface Pro 4, Core m3 | |
| Productivity | |
| HP Elite x2 1012 G1 | |
| Asus Transformer 3 Pro T303UA-GN050T | |
| PCMark Vantage Result | 13886 punti | |
| PCMark 7 Score | 5152 punti | |
| PCMark 8 Home Score Accelerated v2 | 2985 punti | |
| PCMark 8 Creative Score Accelerated v2 | 4043 punti | |
| PCMark 8 Work Score Accelerated v2 | 3830 punti | |
Aiuto | ||
| Asus Transformer 3 Pro T303UA-GN050T SK Hynix Canvas SC300 512GB M.2 (HFS512G39MND) | Microsoft Surface Pro 4, Core m3 Samsung MZFLV128 NVMe | Lenovo ThinkPad X1 Yoga-20FRS1VS00 Samsung SSD PM961 1TB M.2 PCIe 3.0 x4 NVMe (MZSLW1T0) | HP Elite x2 1012 G1 Liteon L8H-256V2G | Acer Aspire Switch Alpha 12 SA5-271-56HM Kingston RBU-SNS8152S3256GG2 | |
|---|---|---|---|---|---|
| CrystalDiskMark 3.0 | -7% | 121% | 12% | 0% | |
| Read Seq | 398.9 | 663 66% | 1510 279% | 501 26% | 518 30% |
| Write Seq | 402 | 158.2 -61% | 1193 197% | 297.2 -26% | 199.9 -50% |
| Read 512 | 303.1 | 313.1 3% | 351.7 16% | 374.9 24% | |
| Write 512 | 320.3 | 158.2 -51% | 295.7 -8% | 201 -37% | |
| Read 4k | 26.11 | 30.14 15% | 37 42% | 28.31 8% | 29.3 12% |
| Write 4k | 57.7 | 68 18% | 126 118% | 90.3 56% | 76.8 33% |
| Read 4k QD32 | 245.8 | 243.7 -1% | 404 64% | 285 16% | 272 11% |
| Write 4k QD32 | 253.8 | 149.2 -41% | 319 26% | 268.4 6% | 197.1 -22% |

| 3DMark | |
| 1280x720 Cloud Gate Standard Graphics | |
| Lenovo ThinkPad X1 Yoga-20FRS1VS00 | |
| Acer Aspire Switch Alpha 12 SA5-271-56HM | |
| Microsoft Surface Pro 4, Core m3 | |
| HP Elite x2 1012 G1 | |
| Asus Transformer 3 Pro T303UA-GN050T | |
| 1920x1080 Fire Strike Graphics | |
| Lenovo ThinkPad X1 Yoga-20FRS1VS00 | |
| Microsoft Surface Pro 4, Core m3 | |
| HP Elite x2 1012 G1 | |
| Asus Transformer 3 Pro T303UA-GN050T | |
| 1280x720 Ice Storm Standard Score | |
| HP Elite x2 1012 G1 | |
| Microsoft Surface Pro 4, Core m3 | |
| Asus Transformer 3 Pro T303UA-GN050T | |
| 3DMark 06 - 1280x1024 Standard Score AA:0x AF:0x | |
| HP Elite x2 1012 G1 | |
| Microsoft Surface Pro 4, Core m3 | |
| Asus Transformer 3 Pro T303UA-GN050T | |
| 3DMark 03 Standard | 20325 punti | |
| 3DMark 05 Standard | 9082 punti | |
| 3DMark 06 Standard Score | 7464 punti | |
| 3DMark Vantage P Result | 4650 punti | |
| 3DMark 11 Performance | 1381 punti | |
| 3DMark Ice Storm Standard Score | 35293 punti | |
| 3DMark Cloud Gate Standard Score | 4401 punti | |
| 3DMark Fire Strike Score | 676 punti | |
| 3DMark Fire Strike Extreme Score | 309 punti | |
| 3DMark Time Spy Score | 297 punti | |
Aiuto | ||
| basso | medio | alto | ultra | |
| BioShock Infinite (2013) | 45.2 | 26.9 | 22.5 | 6.6 |
| Battlefield 4 (2013) | 31.3 | 23.2 | 15.9 | |
| Rise of the Tomb Raider (2016) | 20 | 11 | 9 |
| Asus Transformer 3 Pro T303UA-GN050T HD Graphics 520, 6500U, SK Hynix Canvas SC300 512GB M.2 (HFS512G39MND) | Microsoft Surface Pro 4 Core i7 Iris Graphics 540, 6650U, Samsung MZFLV256 NVMe | Lenovo ThinkPad X1 Yoga-20FRS1VS00 HD Graphics 520, 6600U, Samsung SSD PM961 1TB M.2 PCIe 3.0 x4 NVMe (MZSLW1T0) | Apple MacBook Pro 13 2016 (2.9 GHz) Iris Graphics 550, 6267U, Apple SSD AP0256 | Dell XPS 13 9360 QHD+ i5 HD Graphics 620, i5-7200U, Toshiba NVMe THNSN5256GPUK | |
|---|---|---|---|---|---|
| Noise | -0% | 4% | 4% | 1% | |
| off /ambiente * | 30.7 | 28.9 6% | 30.2 2% | 30.3 1% | |
| Idle Minimum * | 30.7 | 28.4 7% | 28.9 6% | 30.2 2% | 30.6 -0% |
| Idle Average * | 30.7 | 28.6 7% | 28.9 6% | 30.2 2% | 30.6 -0% |
| Idle Maximum * | 30.7 | 28.7 7% | 28.9 6% | 30.2 2% | 32.2 -5% |
| Load Average * | 37 | 40.8 -10% | 35.3 5% | 33 11% | 32.2 13% |
| Load Maximum * | 37.1 | 41.4 -12% | 38.9 -5% | 36.2 2% | 38.5 -4% |
* ... Meglio usare valori piccoli
Rumorosità
| Idle |
| 30.7 / 30.7 / 30.7 dB(A) |
| Sotto carico |
| 37 / 37.1 dB(A) |
 | ||
30 dB silenzioso 40 dB(A) udibile 50 dB(A) rumoroso |
||
min: | ||
| Asus Transformer 3 Pro T303UA-GN050T HD Graphics 520, 6500U, SK Hynix Canvas SC300 512GB M.2 (HFS512G39MND) | Microsoft Surface Pro 4, Core m3 HD Graphics 515, 6Y30, Samsung MZFLV128 NVMe | Lenovo ThinkPad X1 Yoga-20FRS1VS00 HD Graphics 520, 6600U, Samsung SSD PM961 1TB M.2 PCIe 3.0 x4 NVMe (MZSLW1T0) | HP Elite x2 1012 G1 HD Graphics 515, 6Y54, Liteon L8H-256V2G | Acer Aspire Switch Alpha 12 SA5-271-56HM HD Graphics 520, 6200U, Kingston RBU-SNS8152S3256GG2 | |
|---|---|---|---|---|---|
| Heat | -8% | -12% | 1% | -11% | |
| Maximum Upper Side * | 34.9 | 43.6 -25% | 45.5 -30% | 39 -12% | 46.7 -34% |
| Maximum Bottom * | 36.7 | 45.2 -23% | 47.1 -28% | 41.2 -12% | 51 -39% |
| Idle Upper Side * | 35.8 | 32.4 9% | 31.1 13% | 29.5 18% | 29.5 18% |
| Idle Bottom * | 32.4 | 29.6 9% | 33.1 -2% | 29.8 8% | 28.6 12% |
* ... Meglio usare valori piccoli
(+) La temperatura massima sul lato superiore è di 34.9 °C / 95 F, rispetto alla media di 35.3 °C / 96 F, che varia da 19.6 a 55.7 °C per questa classe Convertible.
(+) Il lato inferiore si riscalda fino ad un massimo di 36.7 °C / 98 F, rispetto alla media di 36.8 °C / 98 F
(±) In idle, la temperatura media del lato superiore è di 32 °C / 90 F, rispetto alla media deld ispositivo di 30.2 °C / 86 F.
(+) I poggiapolsi e il touchpad raggiungono la temperatura massima della pelle (35.8 °C / 96.4 F) e quindi non sono caldi.
(-) La temperatura media della zona del palmo della mano di dispositivi simili e'stata di 28.1 °C / 82.6 F (-7.7 °C / -13.8 F).

Asus Transformer 3 Pro T303UA-GN050T analisi audio
(±) | potenza degli altiparlanti media ma buona (73 dB)
Bassi 100 - 315 Hz
(±) | bassi ridotti - in media 11.2% inferiori alla media
(±) | la linearità dei bassi è media (8.2% delta rispetto alla precedente frequenza)
Medi 400 - 2000 Hz
(+) | medi bilanciati - solo only 1.8% rispetto alla media
(+) | medi lineari (6.7% delta rispetto alla precedente frequenza)
Alti 2 - 16 kHz
(±) | alti elevati - circa 9% superiori alla media
(+) | alti lineari (5.7% delta rispetto alla precedente frequenza)
Nel complesso 100 - 16.000 Hz
(±) | la linearità complessiva del suono è media (19% di differenza rispetto alla media
Rispetto alla stessa classe
» 39% di tutti i dispositivi testati in questa classe è stato migliore, 8% simile, 53% peggiore
» Il migliore ha avuto un delta di 6%, medio di 21%, peggiore di 57%
Rispetto a tutti i dispositivi testati
» 39% di tutti i dispositivi testati in questa classe è stato migliore, 8% similare, 53% peggiore
» Il migliore ha avuto un delta di 4%, medio di 25%, peggiore di 134%
Apple MacBook 12 (Early 2016) 1.1 GHz analisi audio
(+) | gli altoparlanti sono relativamente potenti (83.6 dB)
Bassi 100 - 315 Hz
(±) | bassi ridotti - in media 11.3% inferiori alla media
(±) | la linearità dei bassi è media (14.2% delta rispetto alla precedente frequenza)
Medi 400 - 2000 Hz
(+) | medi bilanciati - solo only 2.4% rispetto alla media
(+) | medi lineari (5.5% delta rispetto alla precedente frequenza)
Alti 2 - 16 kHz
(+) | Alti bilanciati - appena 2% dalla media
(+) | alti lineari (4.5% delta rispetto alla precedente frequenza)
Nel complesso 100 - 16.000 Hz
(+) | suono nel complesso lineare (10.2% differenza dalla media)
Rispetto alla stessa classe
» 5% di tutti i dispositivi testati in questa classe è stato migliore, 2% simile, 93% peggiore
» Il migliore ha avuto un delta di 5%, medio di 19%, peggiore di 53%
Rispetto a tutti i dispositivi testati
» 3% di tutti i dispositivi testati in questa classe è stato migliore, 1% similare, 96% peggiore
» Il migliore ha avuto un delta di 4%, medio di 25%, peggiore di 134%
| Off / Standby | |
| Idle | |
| Sotto carico |
|
Leggenda:
min: Attualmente utilizziamo il Metrahit Energy, un multimetro digitale professionale per la misurazione della qualità della potenza e dell'energia monofase, per le nostre misurazioni. | |
| Asus Transformer 3 Pro T303UA-GN050T 6500U, HD Graphics 520, SK Hynix Canvas SC300 512GB M.2 (HFS512G39MND), IPS, 2880x1920, 12.60 | Lenovo ThinkPad X1 Yoga-20FRS1VS00 6600U, HD Graphics 520, Samsung SSD PM961 1TB M.2 PCIe 3.0 x4 NVMe (MZSLW1T0), OLED, 2560x1440, 14.00 | HP Elite x2 1012 G1 6Y54, HD Graphics 515, Liteon L8H-256V2G, IPS, 1920x1280, 12.10 | Acer Aspire Switch Alpha 12 SA5-271-56HM 6200U, HD Graphics 520, Kingston RBU-SNS8152S3256GG2, IPS, 2160x1440, 12.00 | Apple MacBook Pro 13 2016 (2.9 GHz) 6267U, Iris Graphics 550, Apple SSD AP0256, , 2560x1600, 13.30 | Dell XPS 13 9360 QHD+ i5 i5-7200U, HD Graphics 620, Toshiba NVMe THNSN5256GPUK, , 3200x1800, 13.30 | |
|---|---|---|---|---|---|---|
| Power Consumption | -6% | 23% | 4% | -18% | 22% | |
| Idle Minimum * | 6.7 | 4.7 30% | 3.7 45% | 7.3 -9% | 2.1 69% | 3.7 45% |
| Idle Average * | 10.3 | 8.6 17% | 6.8 34% | 10 3% | 7.6 26% | 6.1 41% |
| Idle Maximum * | 13.5 | 12.2 10% | 7.6 44% | 10.15 25% | 8.2 39% | 6.5 52% |
| Load Average * | 26 | 29.7 -14% | 22.5 13% | 25.2 3% | 56.4 -117% | 29.5 -13% |
| Load Maximum * | 28.8 | 50.5 -75% | 34.5 -20% | 29.3 -2% | 59.8 -108% | 33 -15% |
* ... Meglio usare valori piccoli
| Asus Transformer 3 Pro T303UA-GN050T 6500U, HD Graphics 520, 39 Wh | Microsoft Surface Pro 4, Core m3 6Y30, HD Graphics 515, 38 Wh | Lenovo ThinkPad X1 Yoga-20FRS1VS00 6600U, HD Graphics 520, 56 Wh | HP Elite x2 1012 G1 6Y54, HD Graphics 515, 37 Wh | Acer Aspire Switch Alpha 12 SA5-271-56HM 6200U, HD Graphics 520, 37 Wh | |
|---|---|---|---|---|---|
| Autonomia della batteria | 80% | 79% | 77% | 58% | |
| Reader / Idle | 426 | 791 86% | 824 93% | 732 72% | 640 50% |
| H.264 | 206 | 520 152% | 432 110% | 468 127% | |
| WiFi v1.3 | 223 | 488 119% | 315 41% | 443 99% | 321 44% |
| Load | 102 | 138 35% | 132 29% | 130 27% | 112 10% |
Pro
Contro
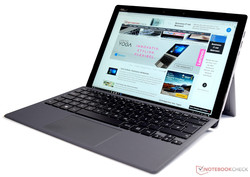
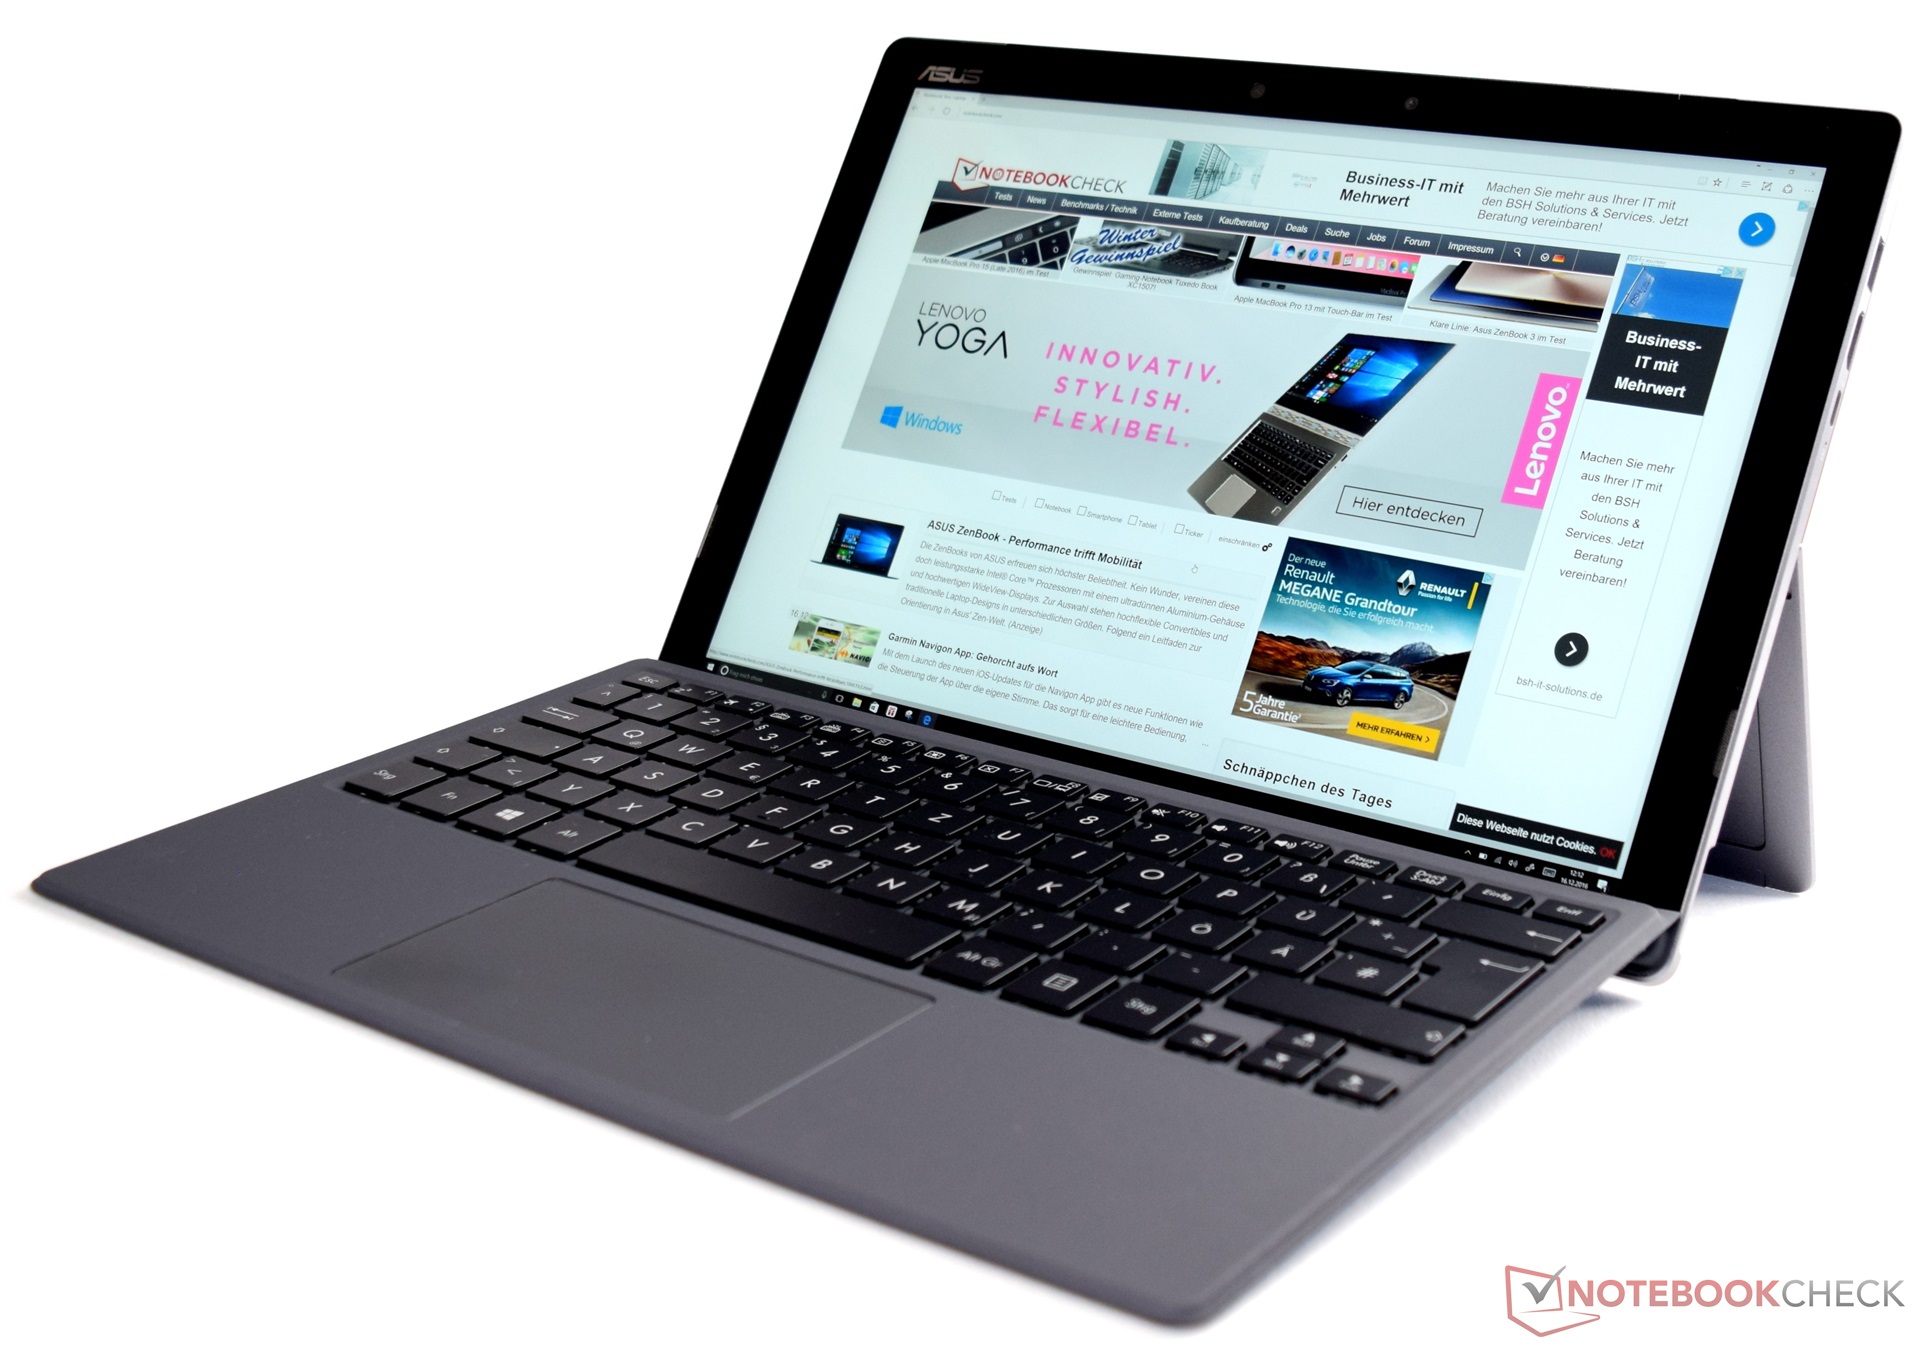
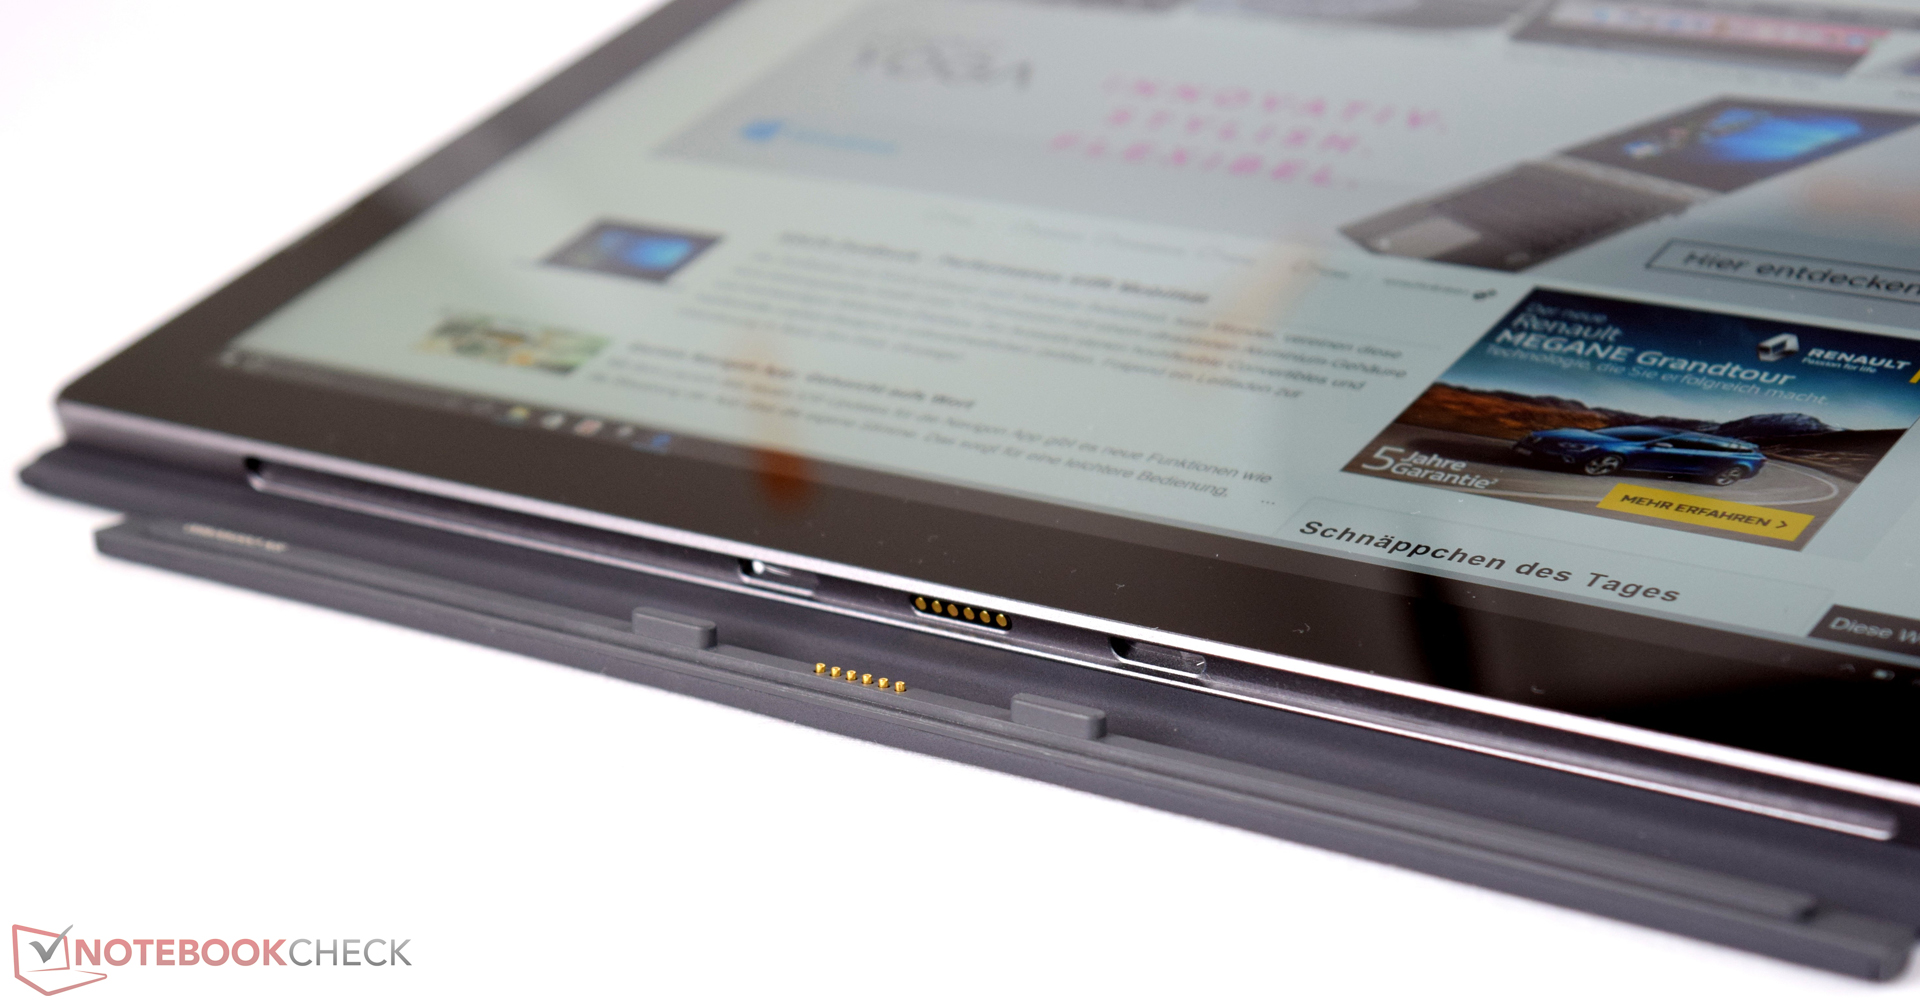
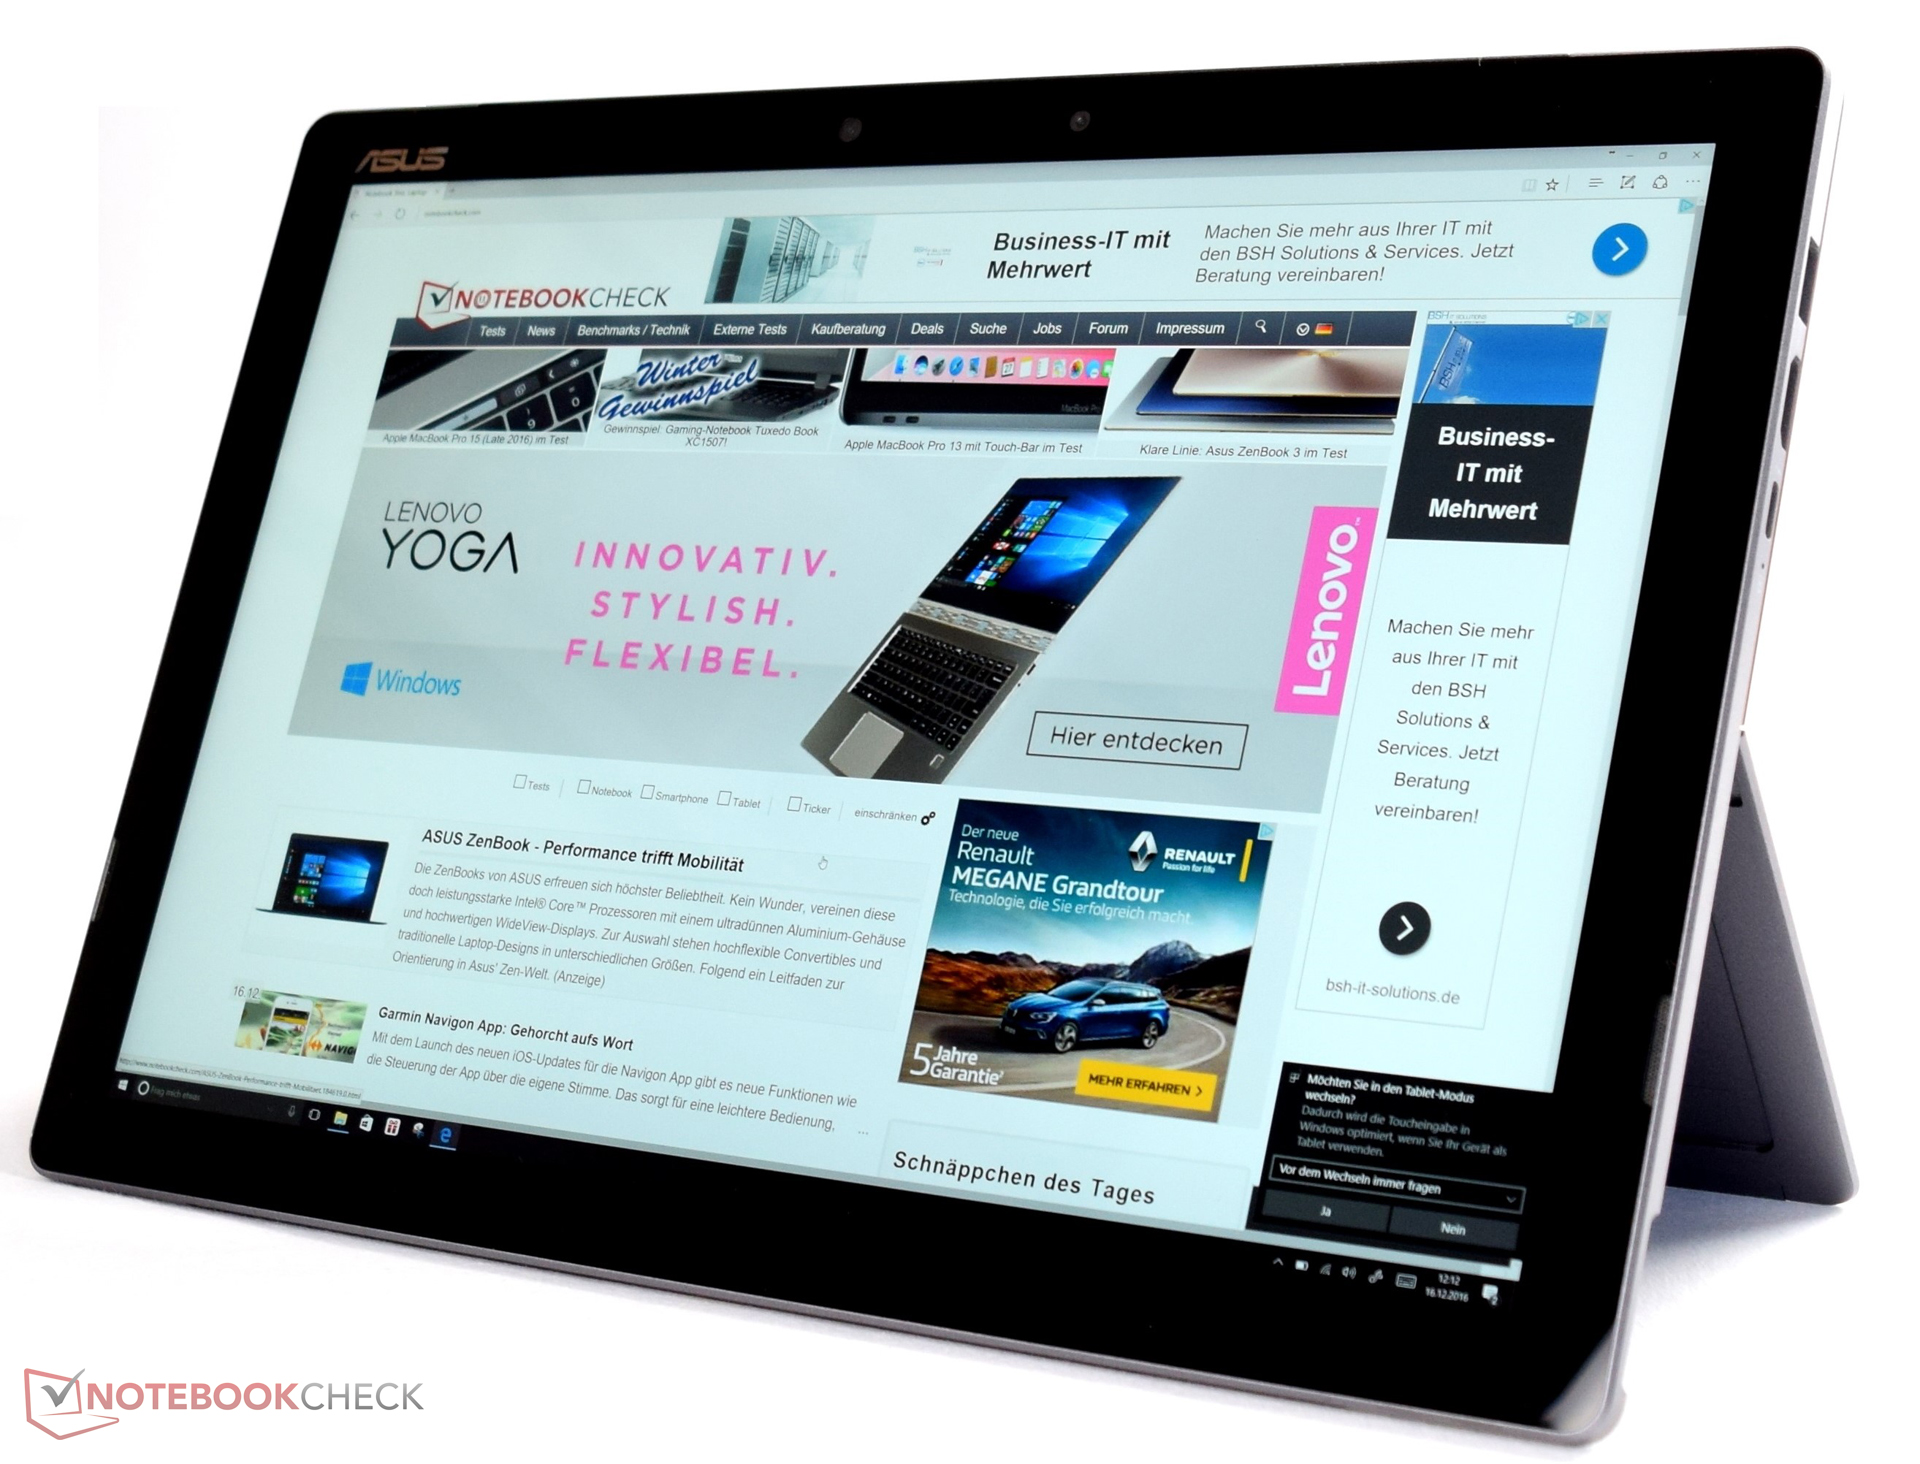
Asus ha deciso di fare molto per competere con il Microsoft Surface. L'Asus Transformer 3 Pro è un passo avanti: un processore più veloce, molta RAM ed un grande SSD in un convertibile. La keyboard dock trasforma questo pacchetto in un portatile completo. Al momento del testing, il convertibile costava 1.599 Euro. Per questo prezzo avrete un dispositivo affidabile con prestazioni sufficienti per le applicazioni quotidiane. Purtroppo, il modello testato non è mai stato in grado di sfruttare tutta la sua potenza. Ecco perché non possiamo considerarlo come un serio concorrente del Microsoft Surface Pro 4.
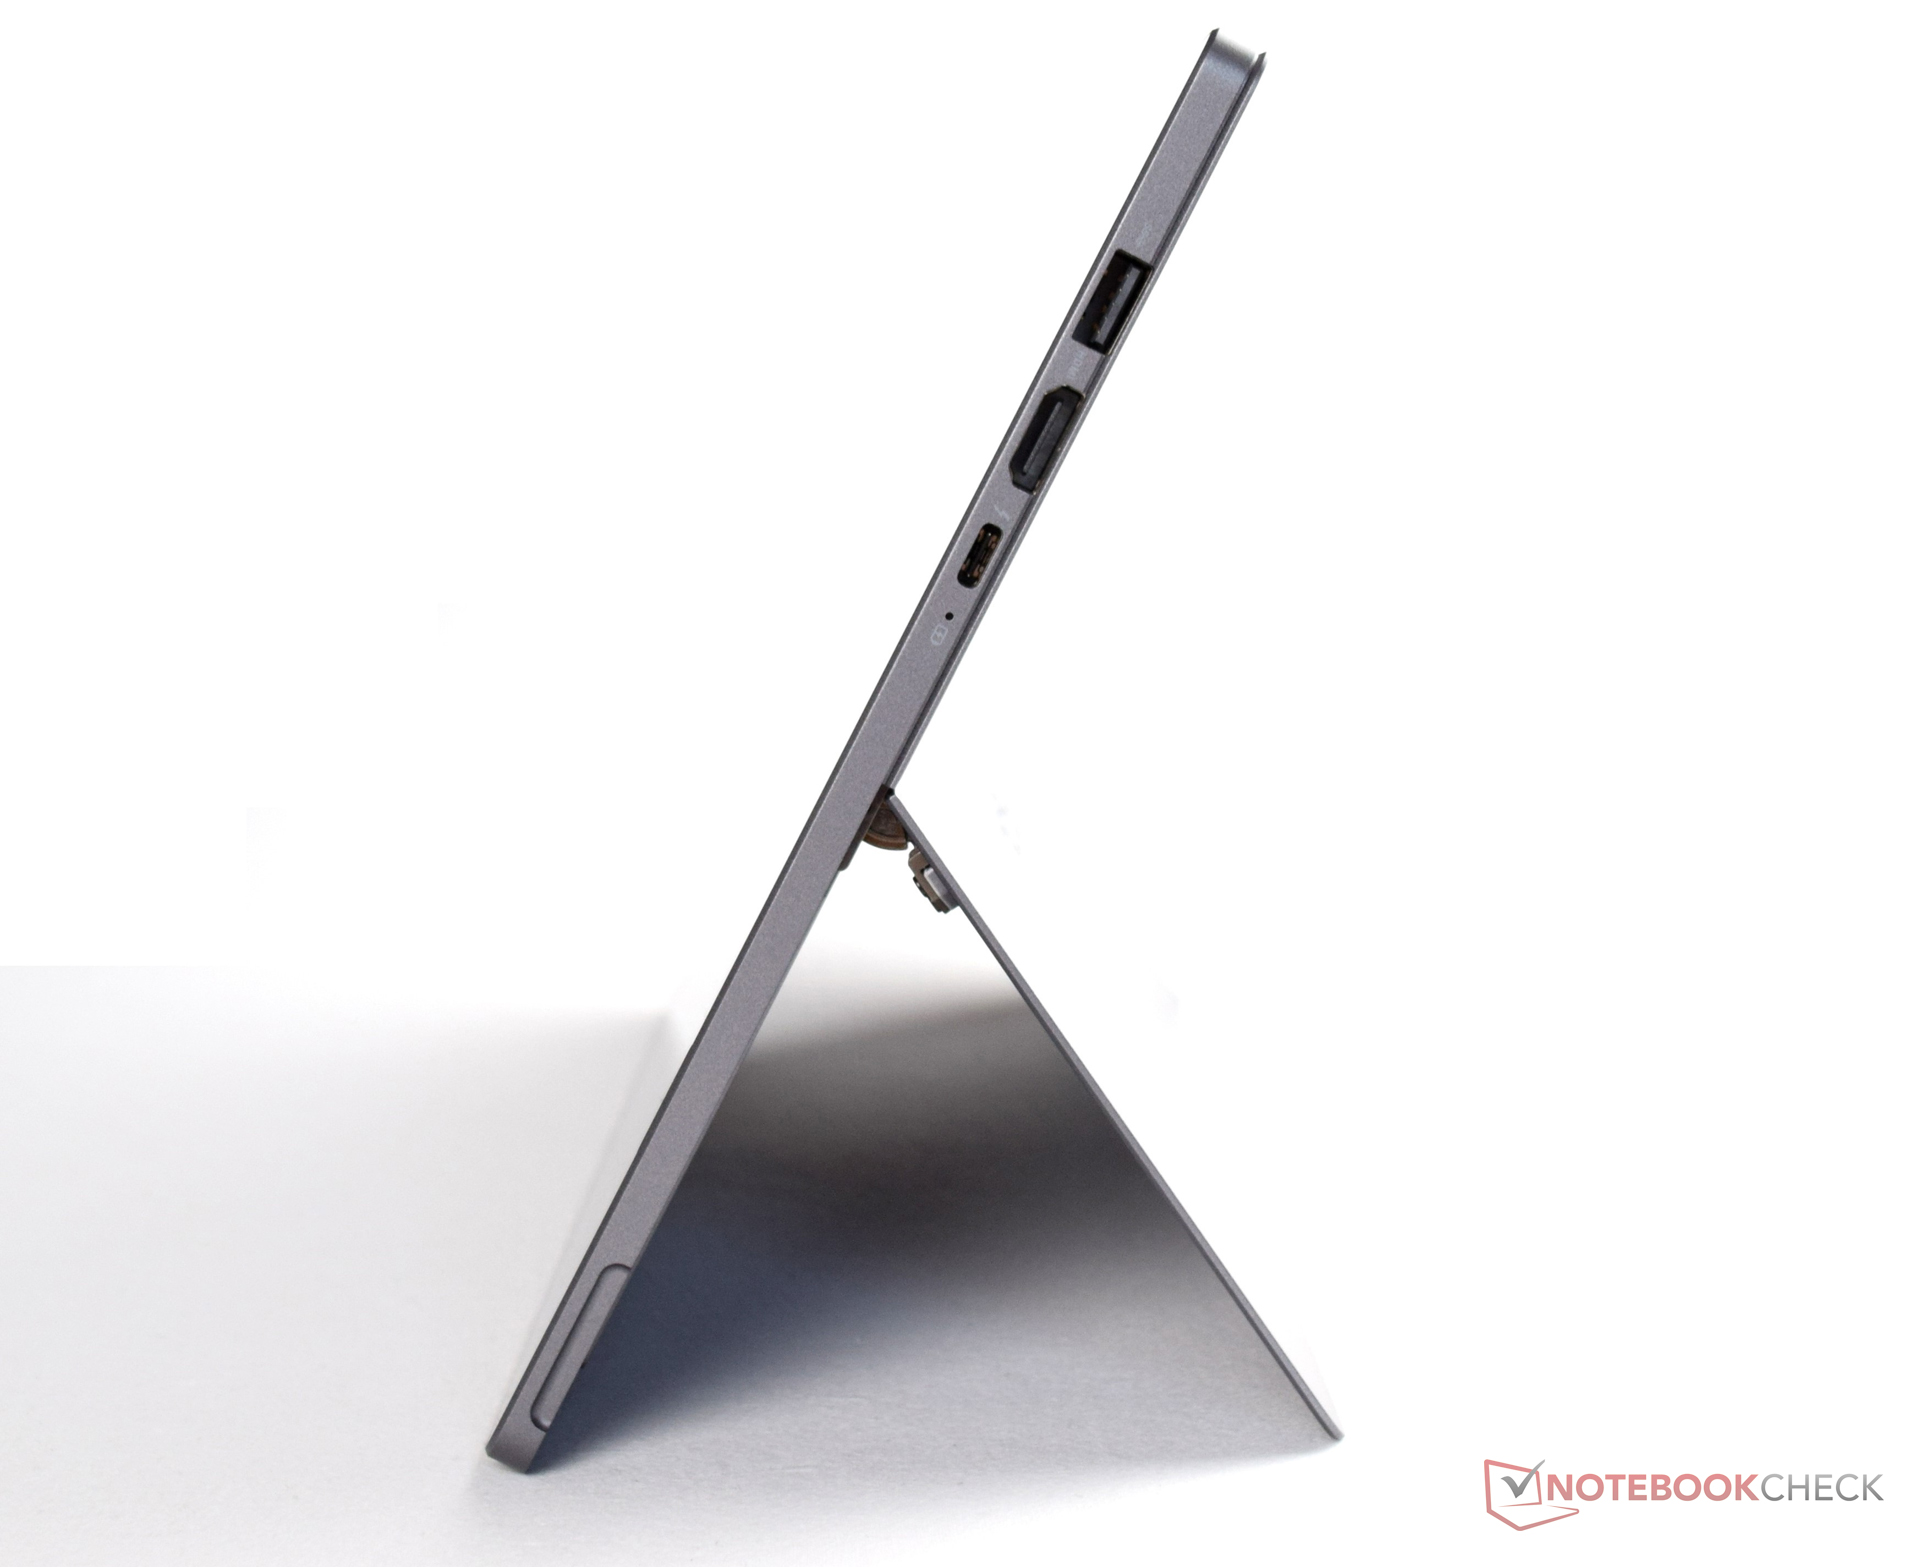
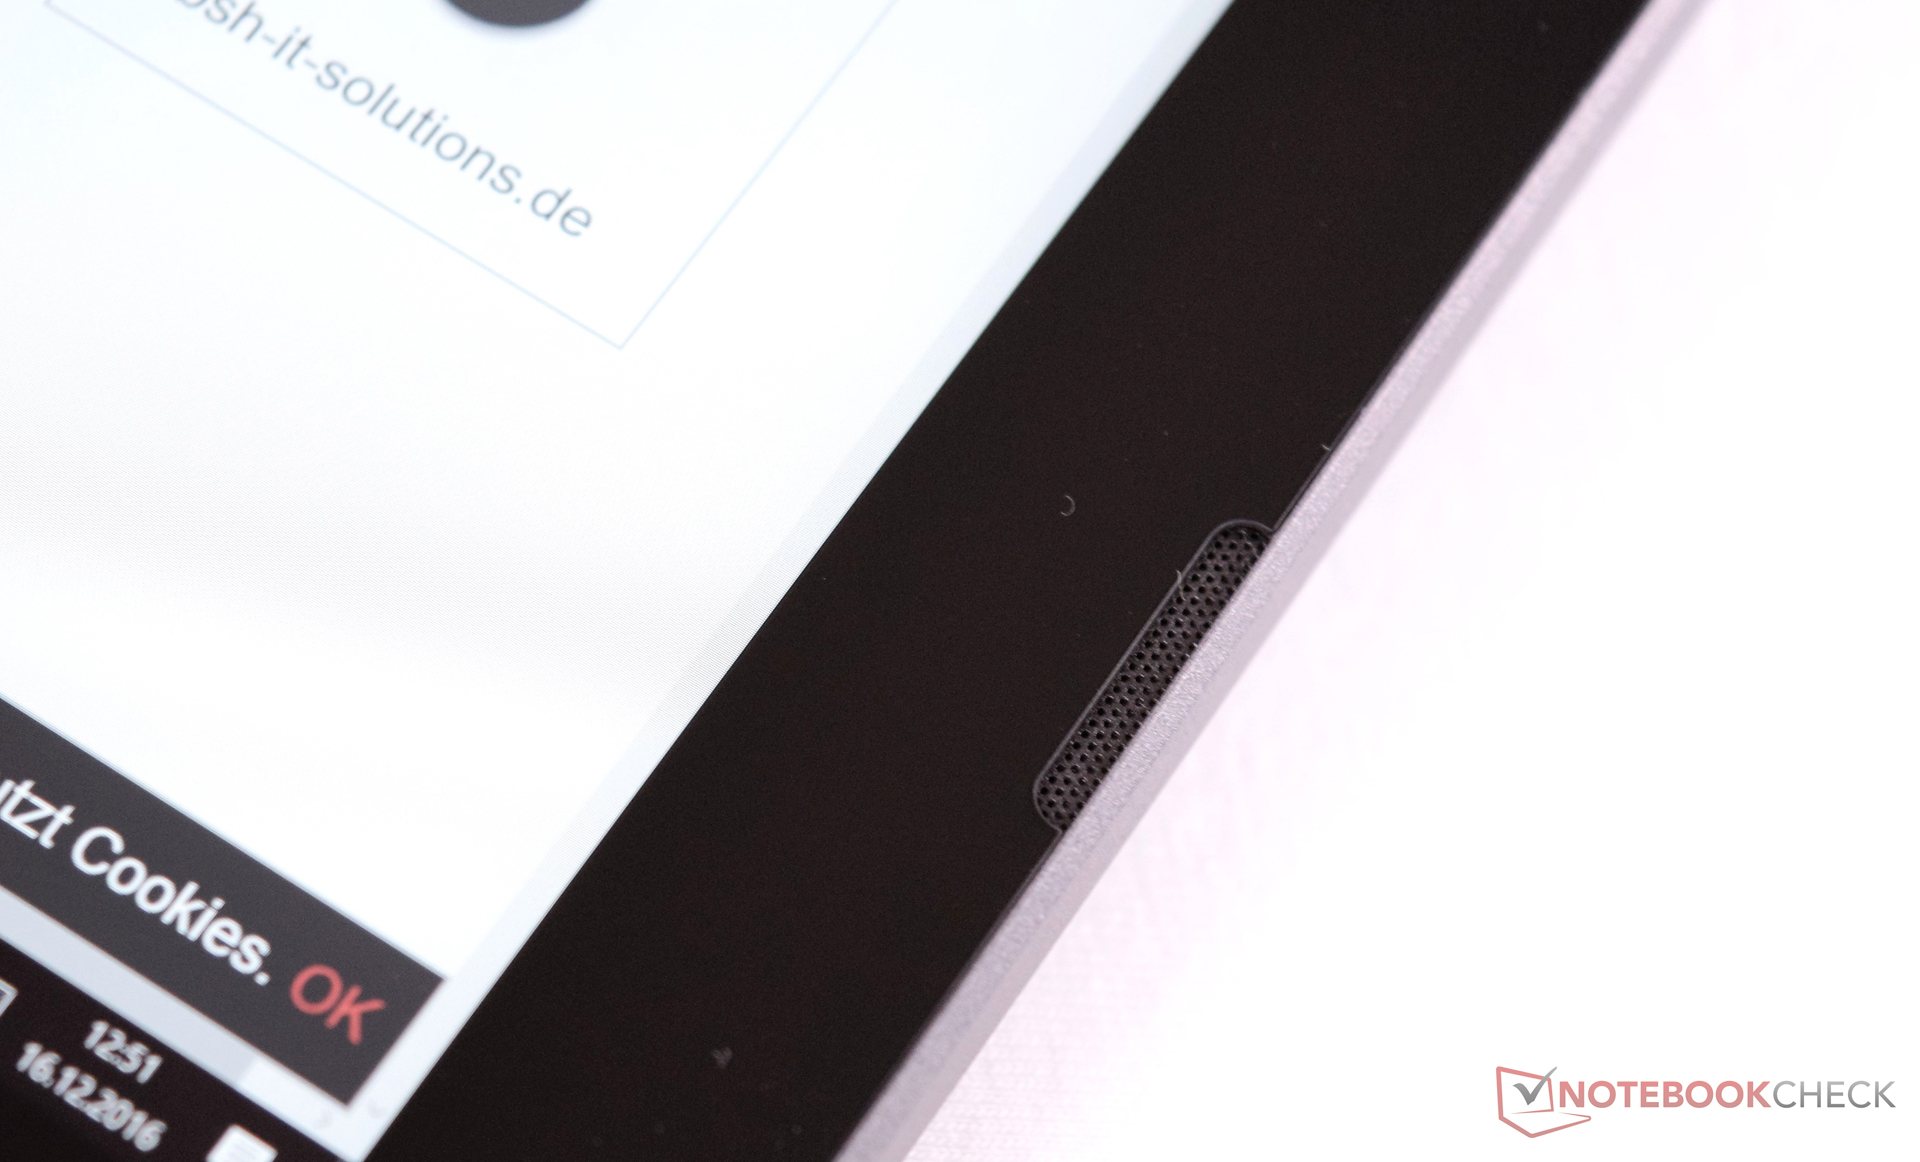
Il gap tra le prestazioni potenziali e quelle reali possono spaventare molti potenziali acquirenti. Tuttavia, l'Asus Transformer 3 Pro è un convertibile stiloso con una costruzione perfetta. L'eccellente display offre una ampia copertura della gamma di colore ed è adatto ad un utilizzo professionale.
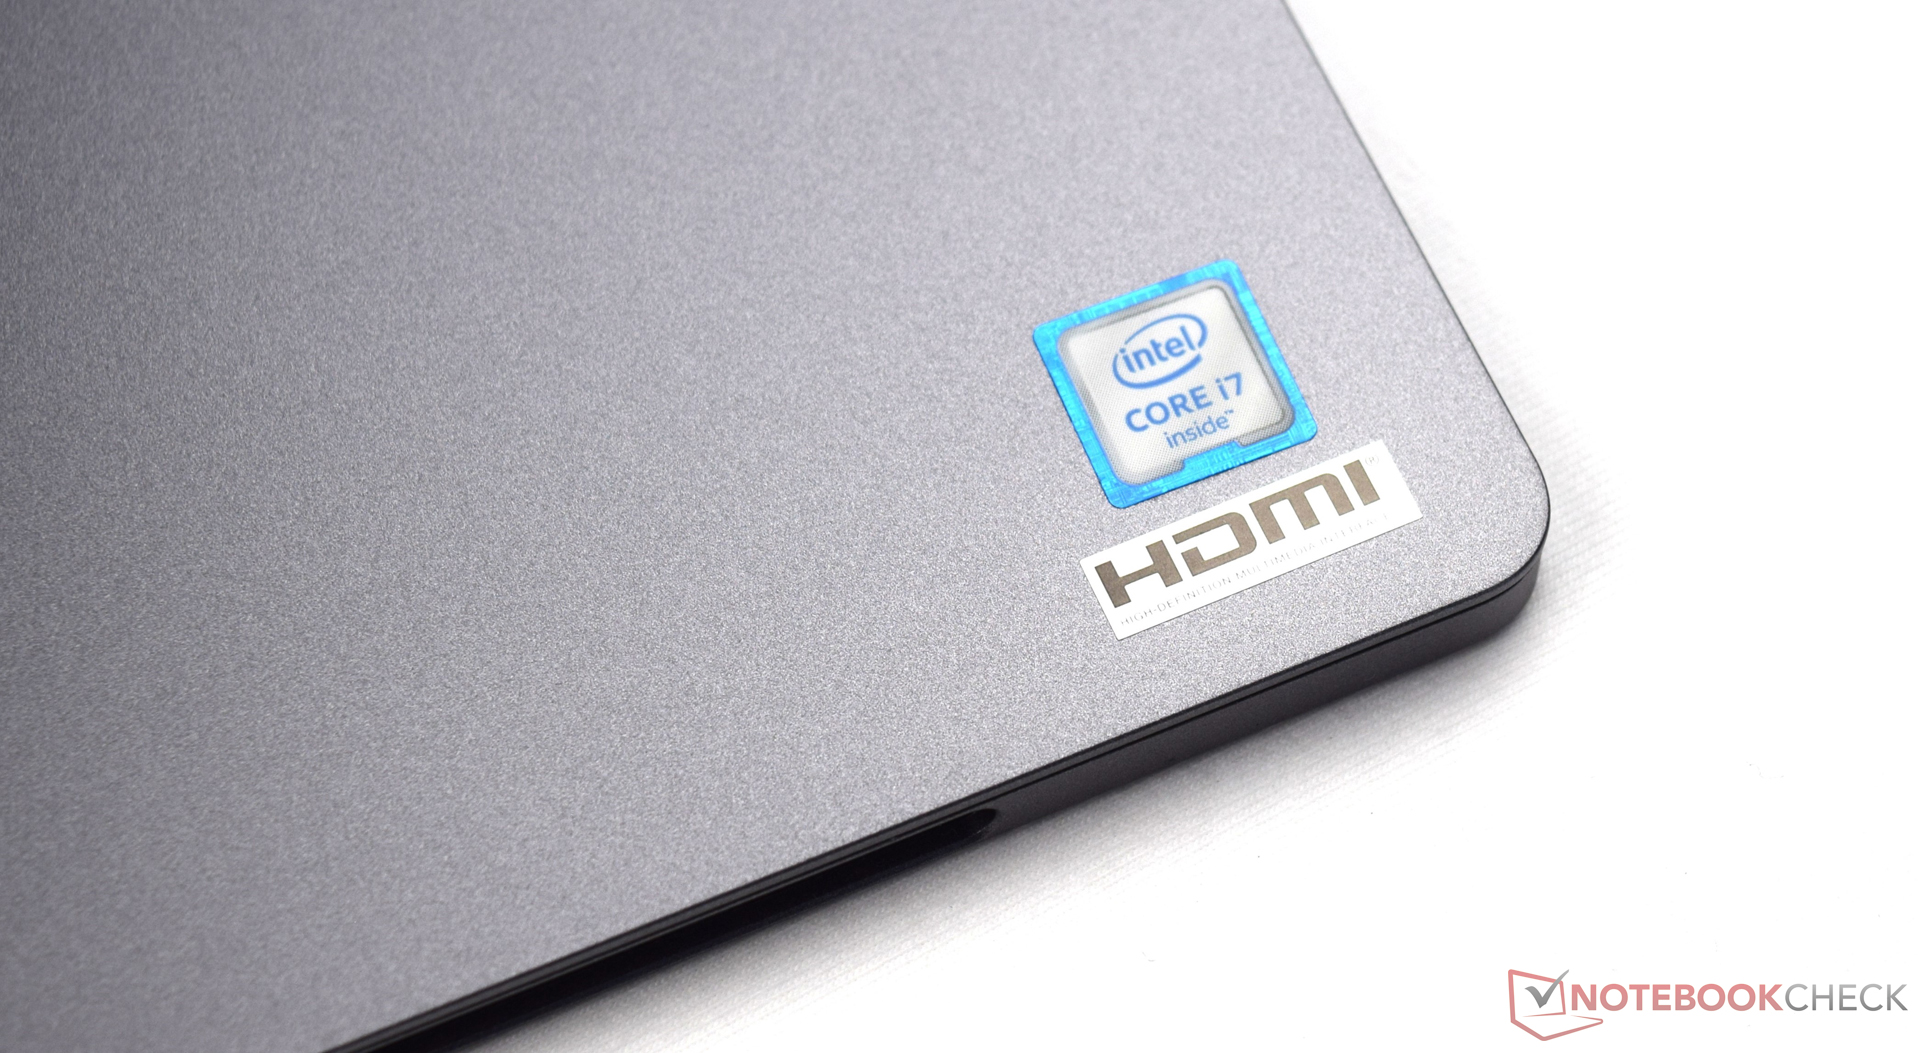
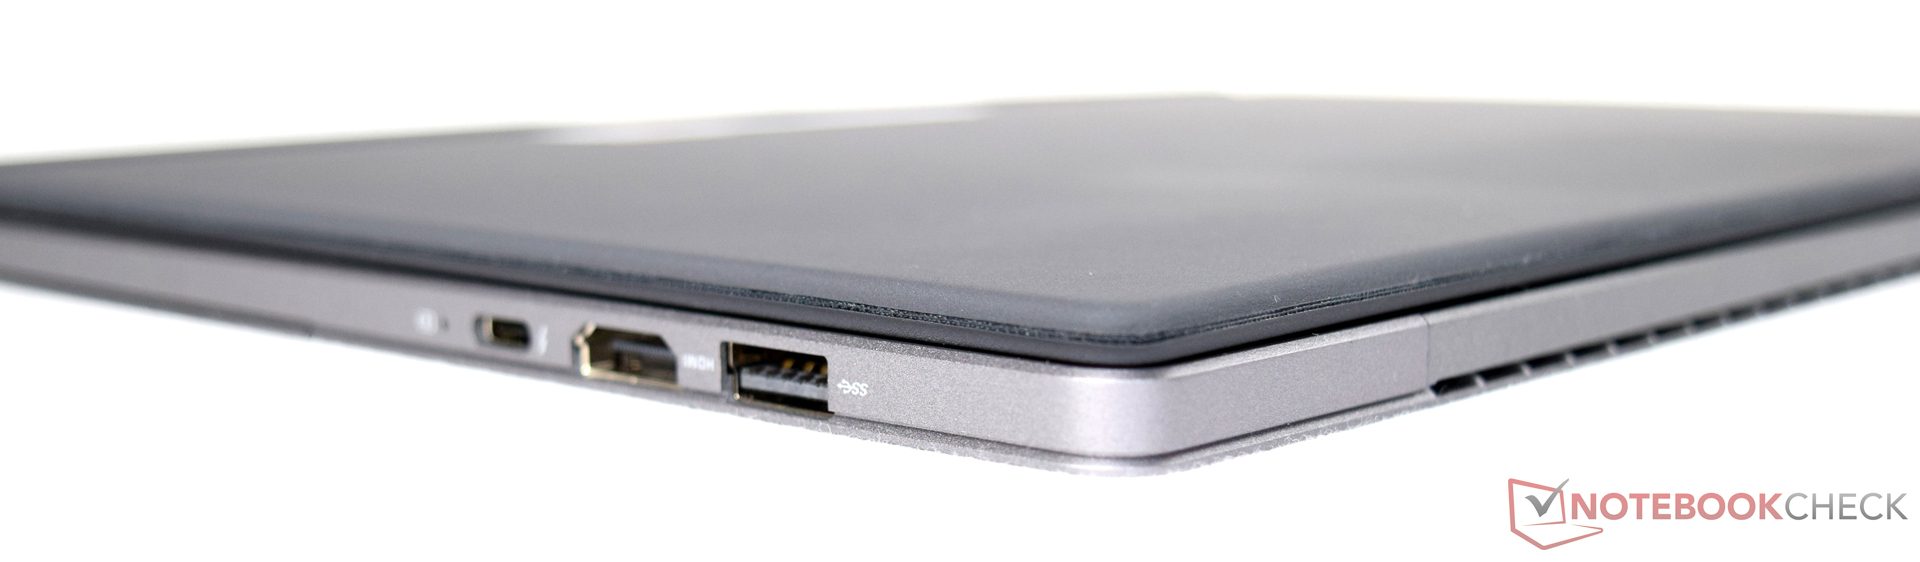
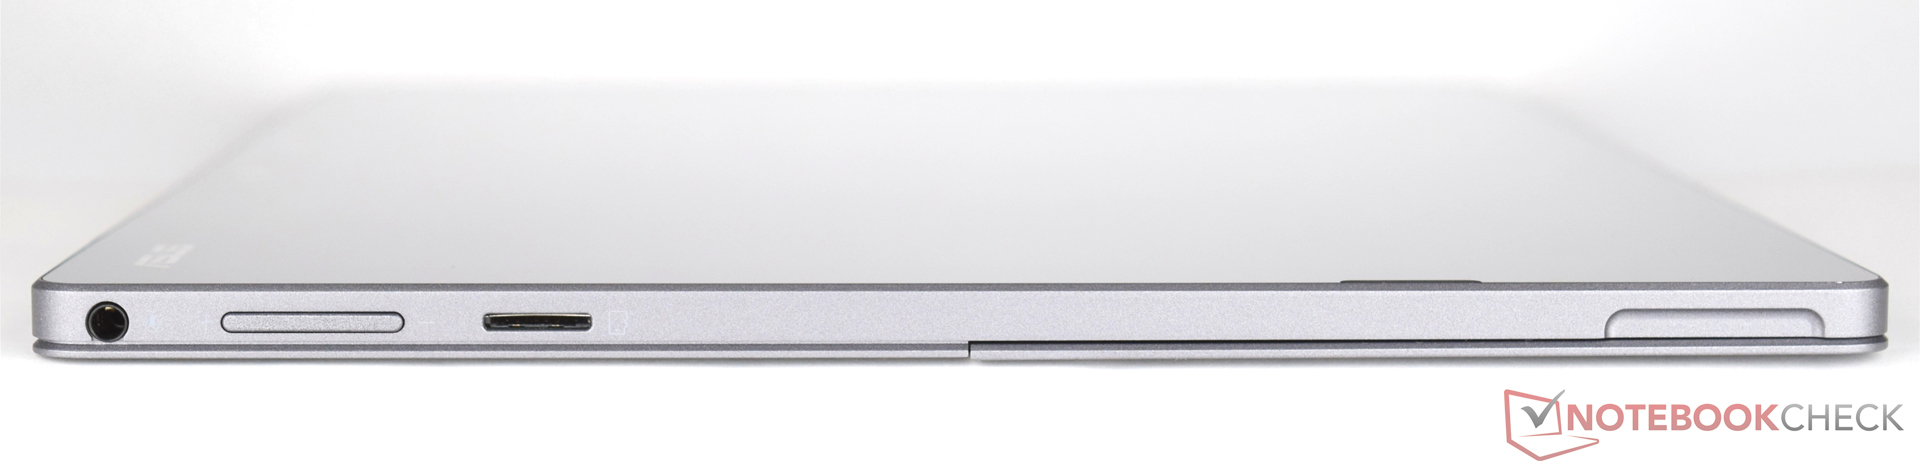
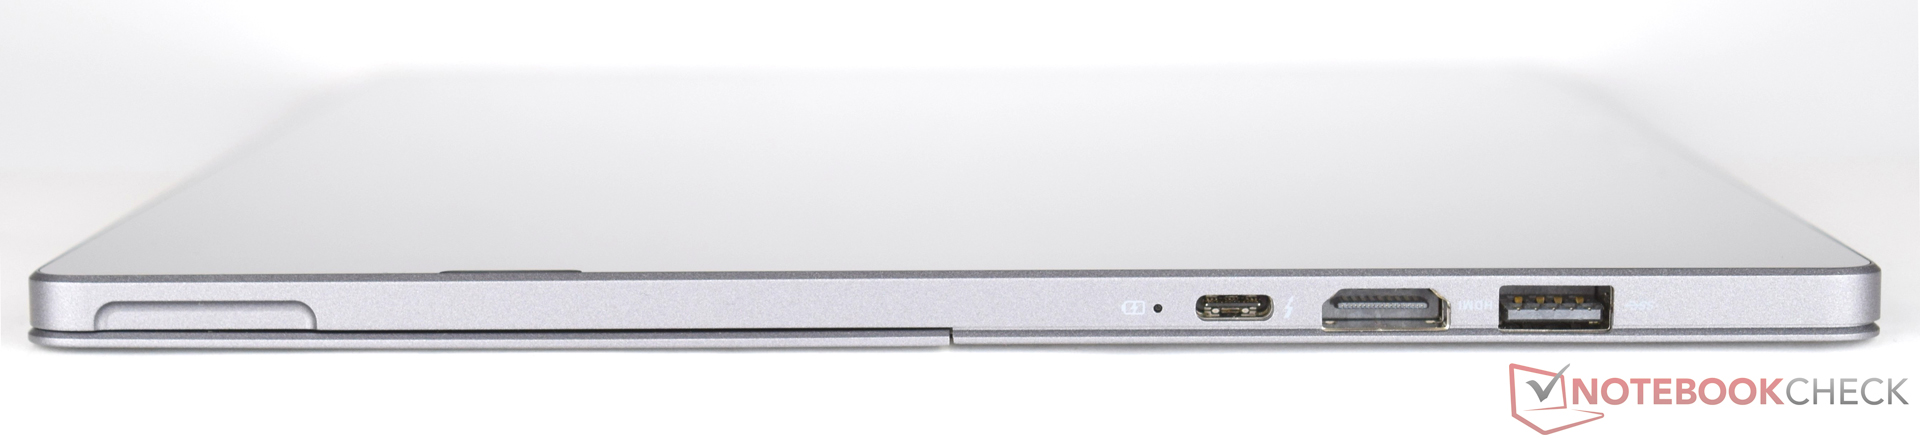
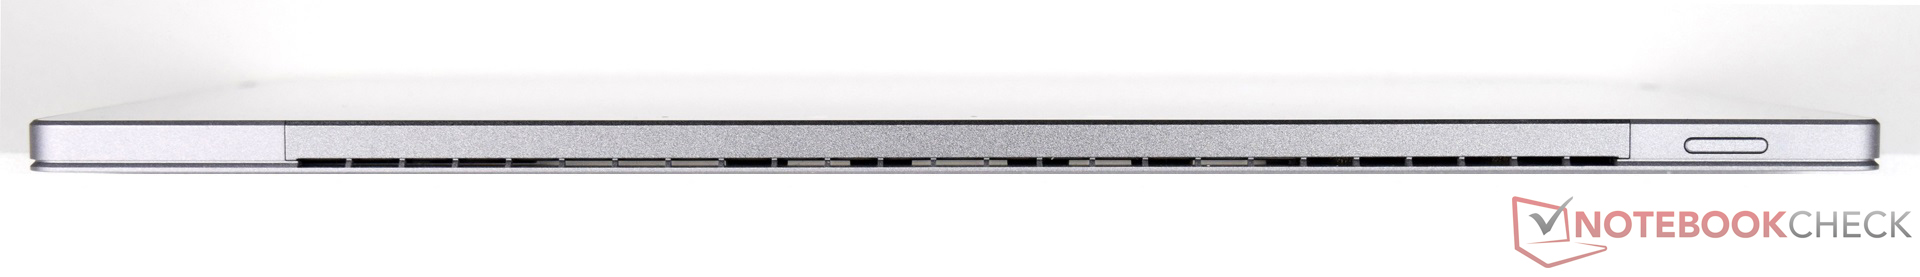
Un processore più veloce fa sempre piacere. Ma come la mettiamo con le prestazioni dal punto di vista concreto? Un Intel Core i5 7Y54 può essere raffreddato passivamente, ed offre prestazioni simili all'Intel Core i7-6500U del nostro modello di test. La connettività di questo modello Asus sono classiche, ma vorremmo vedere due porte USB 3.1 (entrambe con supporto Thunderbolt 3) in futuro in modo da poterne usare una per la ricarica e l'altra per gli adattatori per la connettività.
Nota: si tratta di una recensione breve, con alcune sezioni non tradotte, per la versione integrale in inglese guardate qui.
Asus Transformer 3 Pro T303UA-GN050T
-
12/21/2016 v6(old)
Sebastian Bade