 Deutsch
 English
 Español
 Français
 Italiano
 Nederlands
 Polski
 Português
 Русский
 Türkçe
 Svenska
 Chinese
 Magyar
Recensione Breve del portatile Lenovo ThinkPad X260 (Core i5, WXGA)
| |||||||||||||||||||||||||
Distribuzione della luminosità: 88 %
Al centro con la batteria: 264 cd/m²
Contrasto: 1008:1 (Nero: 0.26 cd/m²)
ΔE Color 3.55 | 0.5-29.43 Ø5
ΔE Greyscale 3.36 | 0.57-98 Ø5.3
72.4% sRGB (Calman 2D)
45.9% AdobeRGB 1998 (Argyll 1.6.3 3D)
49.79% AdobeRGB 1998 (Argyll 2.2.0 3D)
72.6% sRGB (Argyll 2.2.0 3D)
48.19% Display P3 (Argyll 2.2.0 3D)
Gamma: 2.39
| Lenovo ThinkPad X260-20F60041GE HD Graphics 520, 6200U, Seagate ST500LM000 Solid State Hybrid Drive | Dell Latitude 12 E7250 HD Graphics 5500, 5300U, Samsung PM851 Series MZMTE256HMHP | HP Elitebook 820 G2-J8R58EA HD Graphics 5500, 5500U, Samsung SSD PM851 256 GB MZ7TE256HMHP | Lenovo ThinkPad X250-20CLS06D00 HD Graphics 5500, 5600U, Intel SSD Pro 2500 Series SSDSC2BF360A5L | |
|---|---|---|---|---|
| Display | -8% | -9% | -8% | |
| Display P3 Coverage | 48.19 | 44.48 -8% | 43.72 -9% | 44.14 -8% |
| sRGB Coverage | 72.6 | 66.2 -9% | 65.3 -10% | 65.8 -9% |
| AdobeRGB 1998 Coverage | 49.79 | 45.96 -8% | 45.24 -9% | 45.71 -8% |
| Response Times | ||||
| Response Time Grey 50% / Grey 80% * | 42.8 ? | |||
| Response Time Black / White * | 27.2 ? | |||
| PWM Frequency | 220 ? | |||
| Screen | -20% | 1% | -2% | |
| Brightness middle | 262 | 360 37% | 300 15% | 397 52% |
| Brightness | 251 | 330 31% | 298 19% | 357 42% |
| Brightness Distribution | 88 | 81 -8% | 83 -6% | 81 -8% |
| Black Level * | 0.26 | 0.53 -104% | 0.33 -27% | 0.44 -69% |
| Contrast | 1008 | 679 -33% | 909 -10% | 902 -11% |
| Colorchecker dE 2000 * | 3.55 | 5.58 -57% | 3.68 -4% | 4.2 -18% |
| Colorchecker dE 2000 max. * | 5.85 | |||
| Greyscale dE 2000 * | 3.36 | 3.98 -18% | 2.47 26% | 3.1 8% |
| Gamma | 2.39 92% | 2.21 100% | 2.4 92% | 2.6 85% |
| CCT | 5985 109% | 6192 105% | 6310 103% | 6246 104% |
| Color Space (Percent of AdobeRGB 1998) | 45.9 | 42.2 -8% | 41.6 -9% | 42 -8% |
| Color Space (Percent of sRGB) | 64.9 | 65.5 | ||
| Media totale (Programma / Settaggio) | -14% /
-17% | -4% /
-2% | -5% /
-3% |
* ... Meglio usare valori piccoli
Tempi di risposta del Display
| ↔ Tempi di risposta dal Nero al Bianco | ||
|---|---|---|
| 27.2 ms ... aumenta ↗ e diminuisce ↘ combinato | ↗ 12.4 ms Incremento | 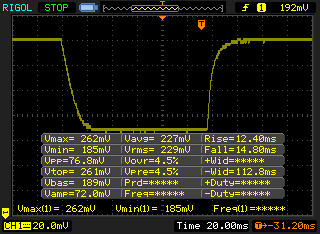 |
| ↘ 14.8 ms Calo | ||
| Lo schermo mostra tempi di risposta relativamente lenti nei nostri tests e potrebbe essere troppo lento per i gamers. In confronto, tutti i dispositivi di test variano da 0.1 (minimo) a 240 (massimo) ms. » 65 % di tutti i dispositivi è migliore. Questo significa che i tempi di risposta rilevati sono peggiori rispetto alla media di tutti i dispositivi testati (21.5 ms). | ||
| ↔ Tempo di risposta dal 50% Grigio all'80% Grigio | ||
| 42.8 ms ... aumenta ↗ e diminuisce ↘ combinato | ↗ 18.8 ms Incremento | 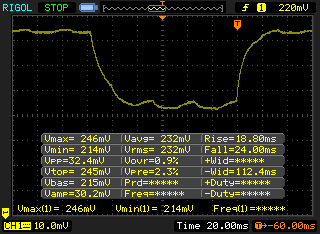 |
| ↘ 24 ms Calo | ||
| Lo schermo mostra tempi di risposta lenti nei nostri tests e sarà insoddisfacente per i gamers. In confronto, tutti i dispositivi di test variano da 0.2 (minimo) a 636 (massimo) ms. » 66 % di tutti i dispositivi è migliore. Questo significa che i tempi di risposta rilevati sono peggiori rispetto alla media di tutti i dispositivi testati (33.7 ms). | ||
Sfarfallio dello schermo / PWM (Pulse-Width Modulation)
| flickering dello schermo / PWM rilevato | 220 Hz | ≤ 90 % settaggio luminosita' | 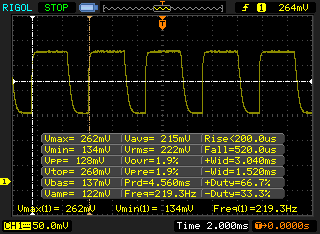 |
Il display sfarfalla a 220 Hz (Probabilmente a causa dell'uso di PWM) Flickering rilevato ad una luminosita' di 90 % o inferiore. Non dovrebbe verificarsi flickering o PWM sopra questo valore di luminosita'. La frequenza di 220 Hz è relativamente bassa, quindi gli utenti sensibili potrebbero notare il flickering ed accusare stanchezza agli occhi a questo livello di luminosità e a livelli inferiori. In confronto: 53 % di tutti i dispositivi testati non utilizza PWM per ridurre la luminosita' del display. Se è rilevato PWM, una media di 17924 (minimo: 5 - massimo: 3846000) Hz è stata rilevata. | |||
| Lenovo ThinkPad X260-20F60041GE HD Graphics 520, 6200U, Seagate ST500LM000 Solid State Hybrid Drive | Dell Latitude 12 E7250 HD Graphics 5500, 5300U, Samsung PM851 Series MZMTE256HMHP | HP Elitebook 820 G2-J8R58EA HD Graphics 5500, 5500U, Samsung SSD PM851 256 GB MZ7TE256HMHP | Lenovo ThinkPad X250-20CLS06D00 HD Graphics 5500, 5600U, Intel SSD Pro 2500 Series SSDSC2BF360A5L | |
|---|---|---|---|---|
| PCMark 7 | ||||
| Score | 3777 | 4662 23% | 4414 17% | 4609 22% |
| PCMark 8 | -17% | -8% | -3% | |
| Home Score Accelerated v2 | 3262 | 2772 -15% | 2987 -8% | 3148 -3% |
| Creative Score Accelerated v2 | 3735 | 3052 -18% | 3306 -11% | 3458 -7% |
| Work Score Accelerated v2 | 4335 | 4133 -5% | 4345 0% | |
| Media totale (Programma / Settaggio) | 3% /
-3% | 5% /
-2% | 10% /
3% |
| PCMark 7 Score | 3777 punti | |
| PCMark 8 Home Score Accelerated v2 | 3262 punti | |
| PCMark 8 Creative Score Accelerated v2 | 3735 punti | |
| PCMark 8 Work Score Accelerated v2 | 4335 punti | |
Aiuto | ||
| Lenovo ThinkPad X260-20F60041GE HD Graphics 520, 6200U, Seagate ST500LM000 Solid State Hybrid Drive | Dell Latitude 12 E7250 HD Graphics 5500, 5300U, Samsung PM851 Series MZMTE256HMHP | HP Elitebook 820 G2-J8R58EA HD Graphics 5500, 5500U, Samsung SSD PM851 256 GB MZ7TE256HMHP | Lenovo ThinkPad X250-20CLS06D00 HD Graphics 5500, 5600U, Intel SSD Pro 2500 Series SSDSC2BF360A5L | |
|---|---|---|---|---|
| CrystalDiskMark 3.0 | 6400% | 9973% | 3648% | |
| Read Seq | 107.9 | 509 372% | 523 385% | 419.8 289% |
| Write Seq | 110.2 | 244 121% | 268.3 143% | 228.6 107% |
| Read 512 | 36.26 | 428 1080% | 445.6 1129% | 355.2 880% |
| Write 512 | 77.1 | 244 216% | 268.1 248% | 203.3 164% |
| Read 4k | 0.497 | 29 5735% | 29.14 5763% | 27.86 5506% |
| Write 4k | 3.136 | 61 1845% | 136.4 4249% | 15.3 388% |
| Read 4k QD32 | 1.155 | 214 18428% | 384.3 33173% | 163.9 14090% |
| Write 4k QD32 | 0.766 | 180 23399% | 266.5 34691% | 60.2 7759% |

| 3DMark 11 - 1280x720 Performance | |
| Dell XPS 13-9350 | |
| Acer Aspire R13 R7-372T | |
| Asus Zenbook UX303UA-FN121T | |
| Lenovo ThinkPad X260-20F60041GE | |
| HP ProBook 440 G3 PL | |
| Lenovo ThinkPad X250-20CLS06D00 | |
| HP Elitebook 820 G2-J8R58EA | |
| Dell Latitude 12 E7250 | |
| 3DMark 11 Performance | 1332 punti | |
| 3DMark Ice Storm Standard Score | 45479 punti | |
| 3DMark Cloud Gate Standard Score | 4938 punti | |
| 3DMark Fire Strike Score | 688 punti | |
Aiuto | ||
| Tomb Raider | |
| 1366x768 Normal Preset AA:FX AF:4x | |
| HP Envy 13-d000ng | |
| HP ProBook 430 G3 P5T00ES | |
| Acer Aspire R13 R7-372T | |
| Asus Zenbook UX303UA-FN121T | |
| HP ProBook 440 G3 | |
| Lenovo ThinkPad X260-20F60041GE | |
| Lenovo ThinkPad X250-20CLS06D00 | |
| HP Elitebook 820 G2-J8R58EA | |
| Dell Latitude 12 E7250 | |
| 1366x768 High Preset AA:FX AF:8x | |
| HP ProBook 430 G3 P5T00ES | |
| HP Envy 13-d000ng | |
| Acer Aspire R13 R7-372T | |
| Asus Zenbook UX303UA-FN121T | |
| Lenovo ThinkPad X260-20F60041GE | |
| Dell Latitude 12 E7250 | |
| Lenovo ThinkPad X250-20CLS06D00 | |
| HP ProBook 440 G3 | |
| HP Elitebook 820 G2-J8R58EA | |
| 1024x768 Low Preset | |
| HP Envy 13-d000ng | |
| HP ProBook 430 G3 P5T00ES | |
| Acer Aspire R13 R7-372T | |
| Asus Zenbook UX303UA-FN121T | |
| HP ProBook 440 G3 | |
| Lenovo ThinkPad X260-20F60041GE | |
| Lenovo ThinkPad X250-20CLS06D00 | |
| HP Elitebook 820 G2-J8R58EA | |
| Dell Latitude 12 E7250 | |
| basso | medio | alto | ultra | |
| Tomb Raider (2013) | 48.3 | 25.5 | 16.8 | 9.6 |
| BioShock Infinite (2013) | 33.13 | 20.1 | 16.74 | 5.1 |
| Battlefield 4 (2013) | 34.7 | 24.1 | 14 | 4.1 |
Rumorosità
| Idle |
| 29.4 / 29.4 / 29.4 dB(A) |
| HDD |
| 29.6 dB(A) |
| Sotto carico |
| 33.2 / 33.2 dB(A) |
 | ||
30 dB silenzioso 40 dB(A) udibile 50 dB(A) rumoroso |
||
min: | ||
(-) La temperatura massima sul lato superiore è di 45.3 °C / 114 F, rispetto alla media di 35.9 °C / 97 F, che varia da 21.4 a 59 °C per questa classe Subnotebook.
(-) Il lato inferiore si riscalda fino ad un massimo di 48.8 °C / 120 F, rispetto alla media di 39.4 °C / 103 F
(+) In idle, la temperatura media del lato superiore è di 26.7 °C / 80 F, rispetto alla media deld ispositivo di 30.7 °C / 87 F.
(+) I poggiapolsi e il touchpad sono piu' freddi della temperatura della pelle con un massimo di 27.9 °C / 82.2 F e sono quindi freddi al tatto.
(±) La temperatura media della zona del palmo della mano di dispositivi simili e'stata di 28.3 °C / 82.9 F (+0.4 °C / 0.7 F).
| Off / Standby | |
| Idle | |
| Sotto carico |
|
Leggenda:
min: Attualmente utilizziamo il Metrahit Energy, un multimetro digitale professionale per la misurazione della qualità della potenza e dell'energia monofase, per le nostre misurazioni. | |
| Battery Runtime - WiFi Websurfing | |
| Lenovo ThinkPad X260-20F60041GE | |
| HP Elitebook 820 G2-J8R58EA | |
| Lenovo ThinkPad X250-20CLS06D00 | |
Pro
Contro
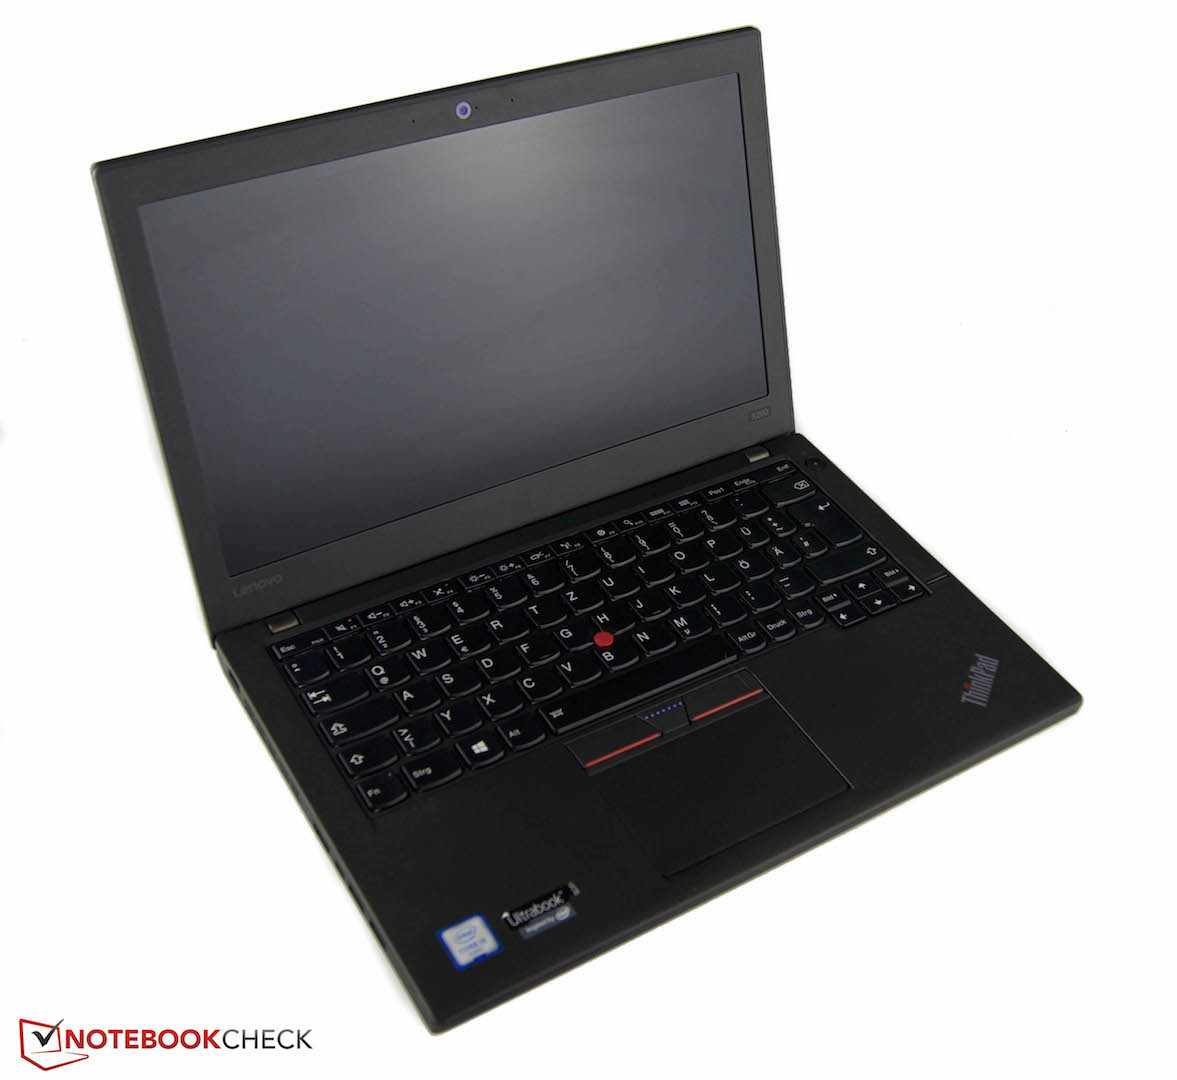
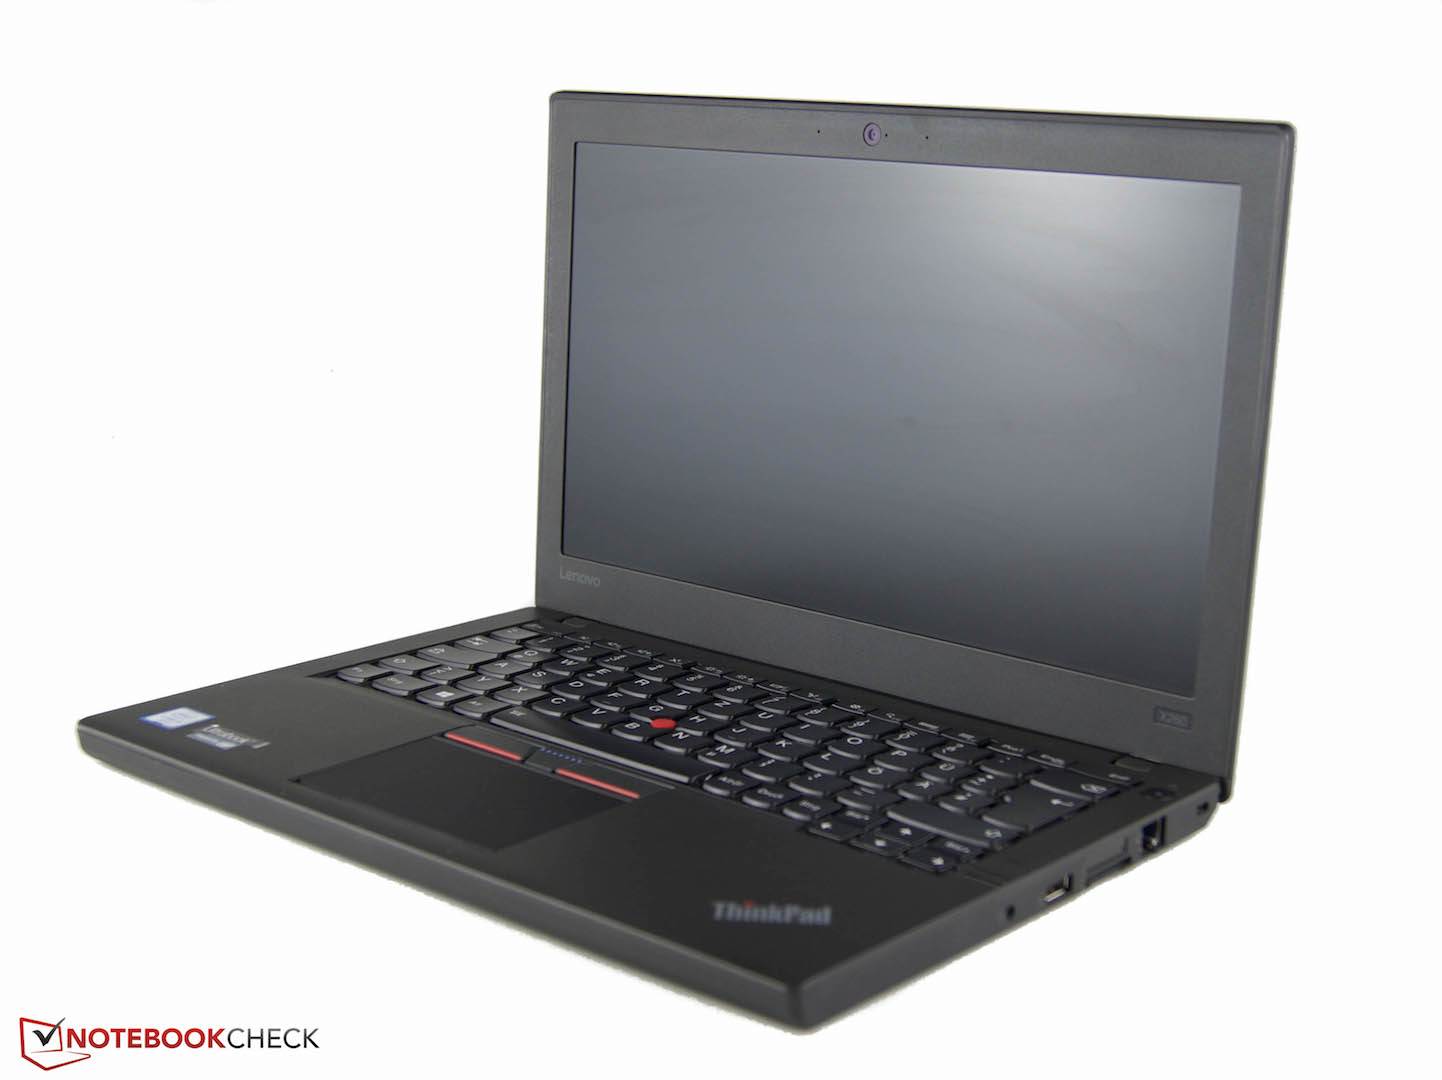
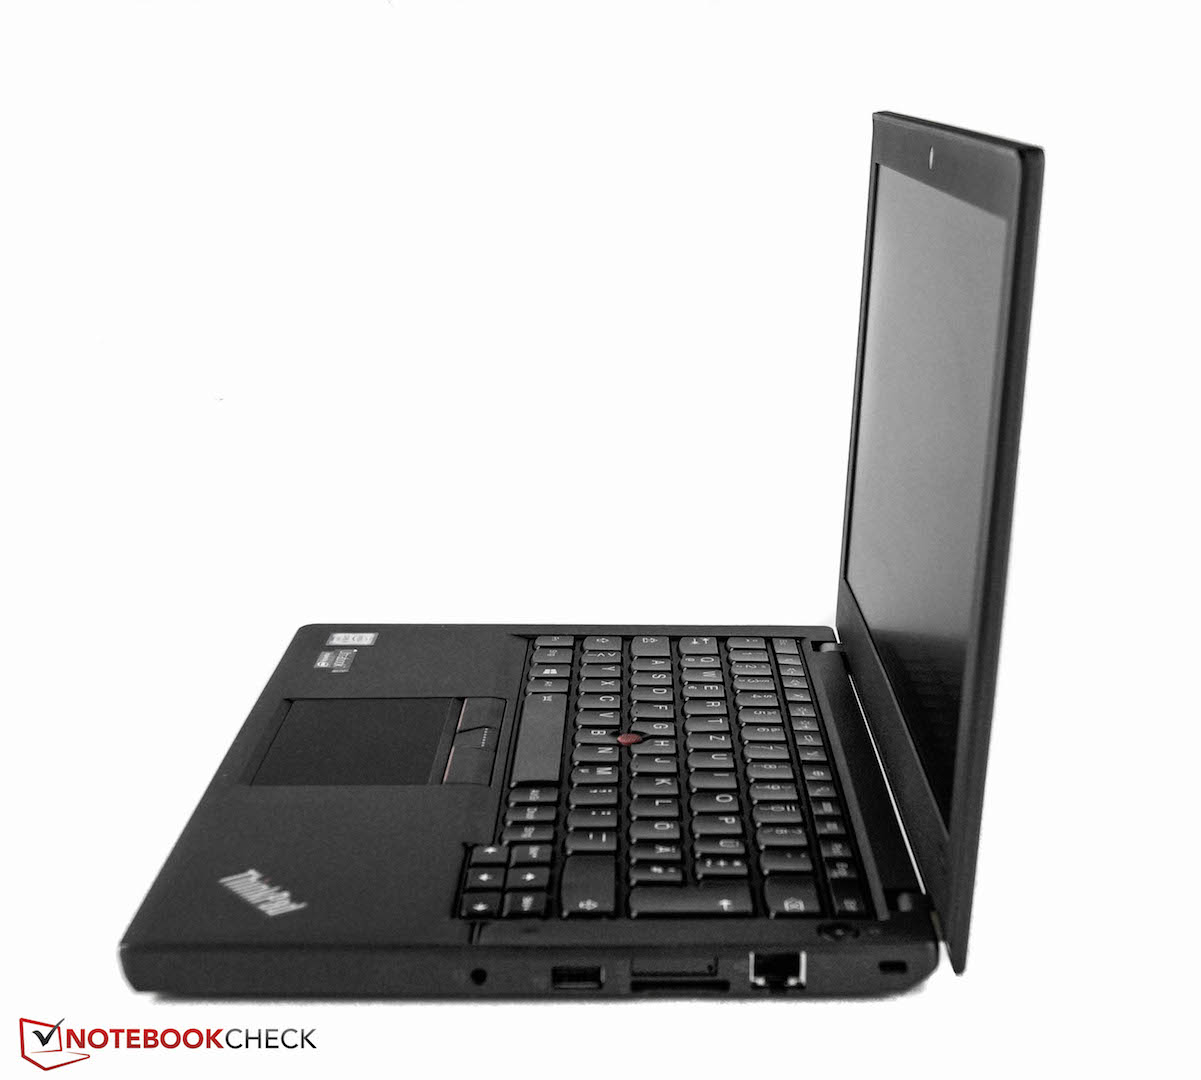
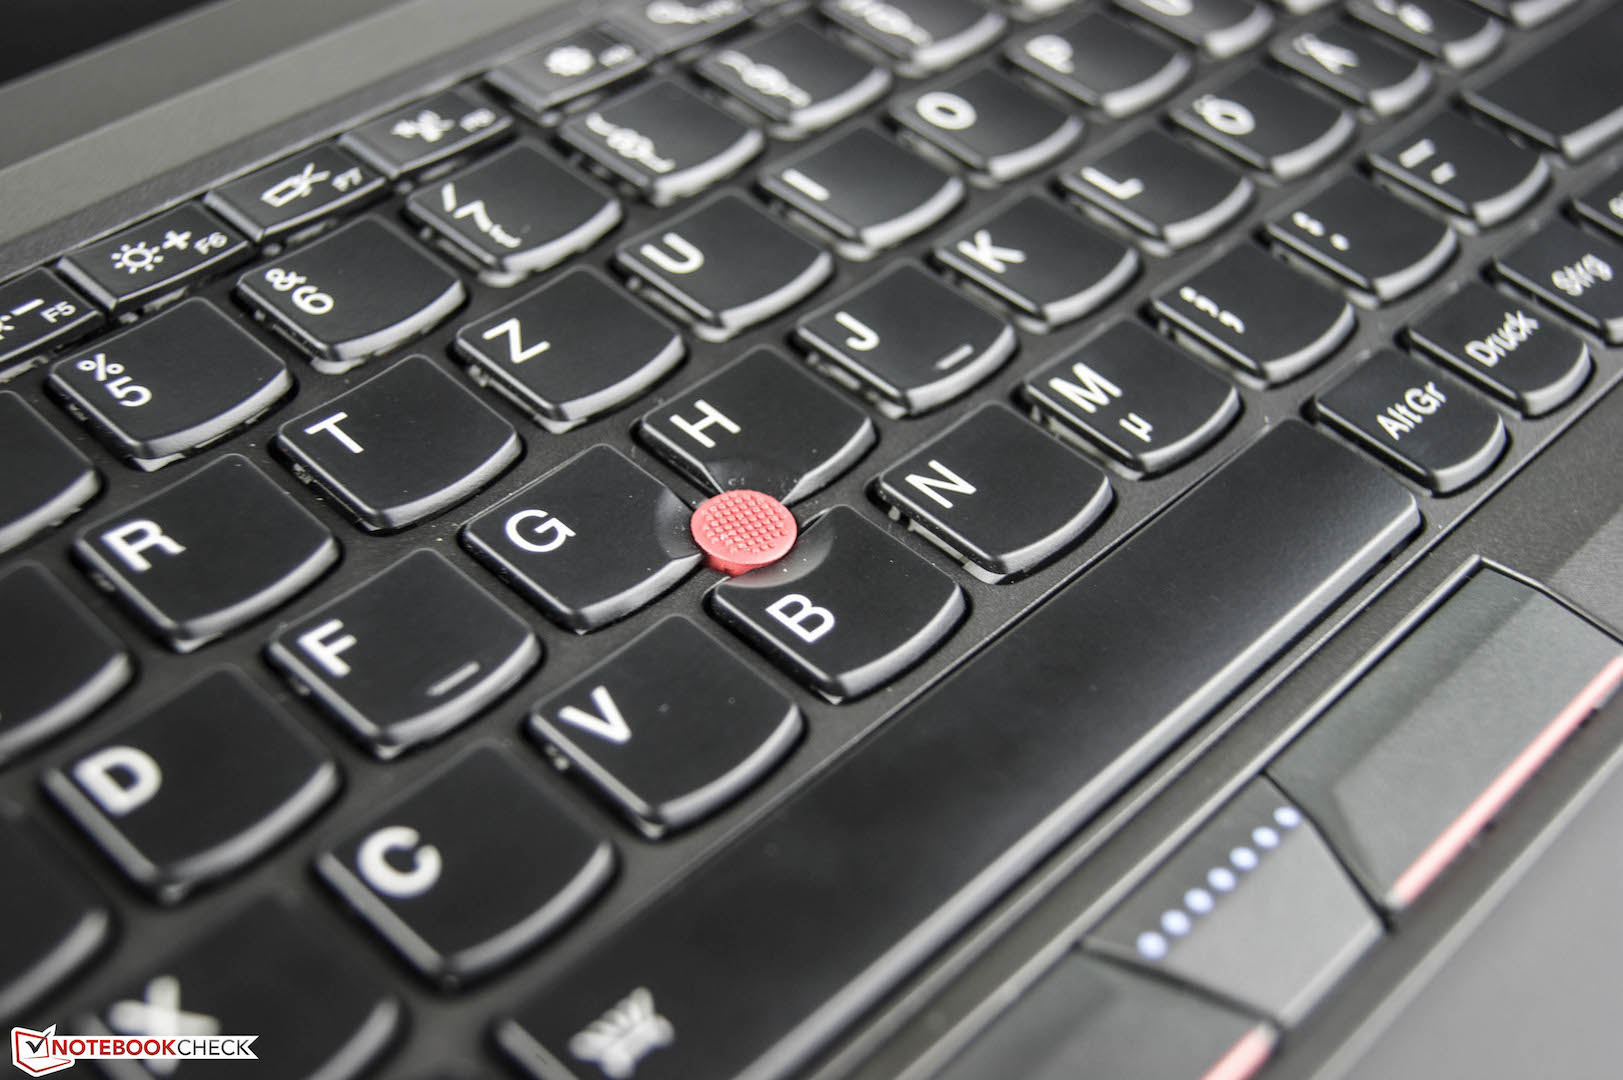
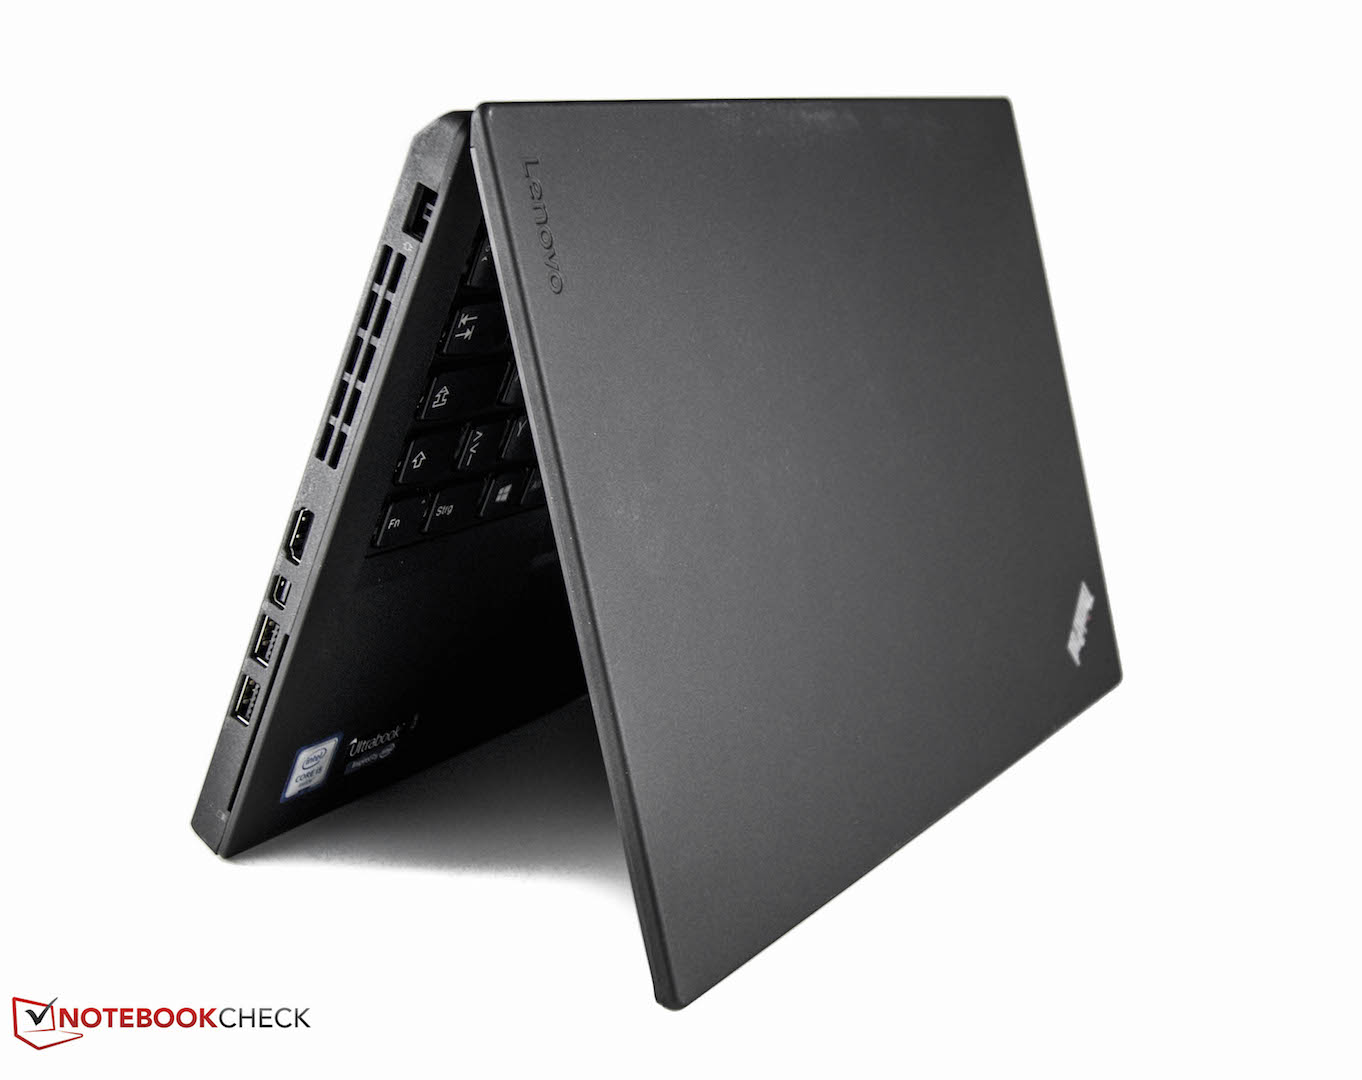
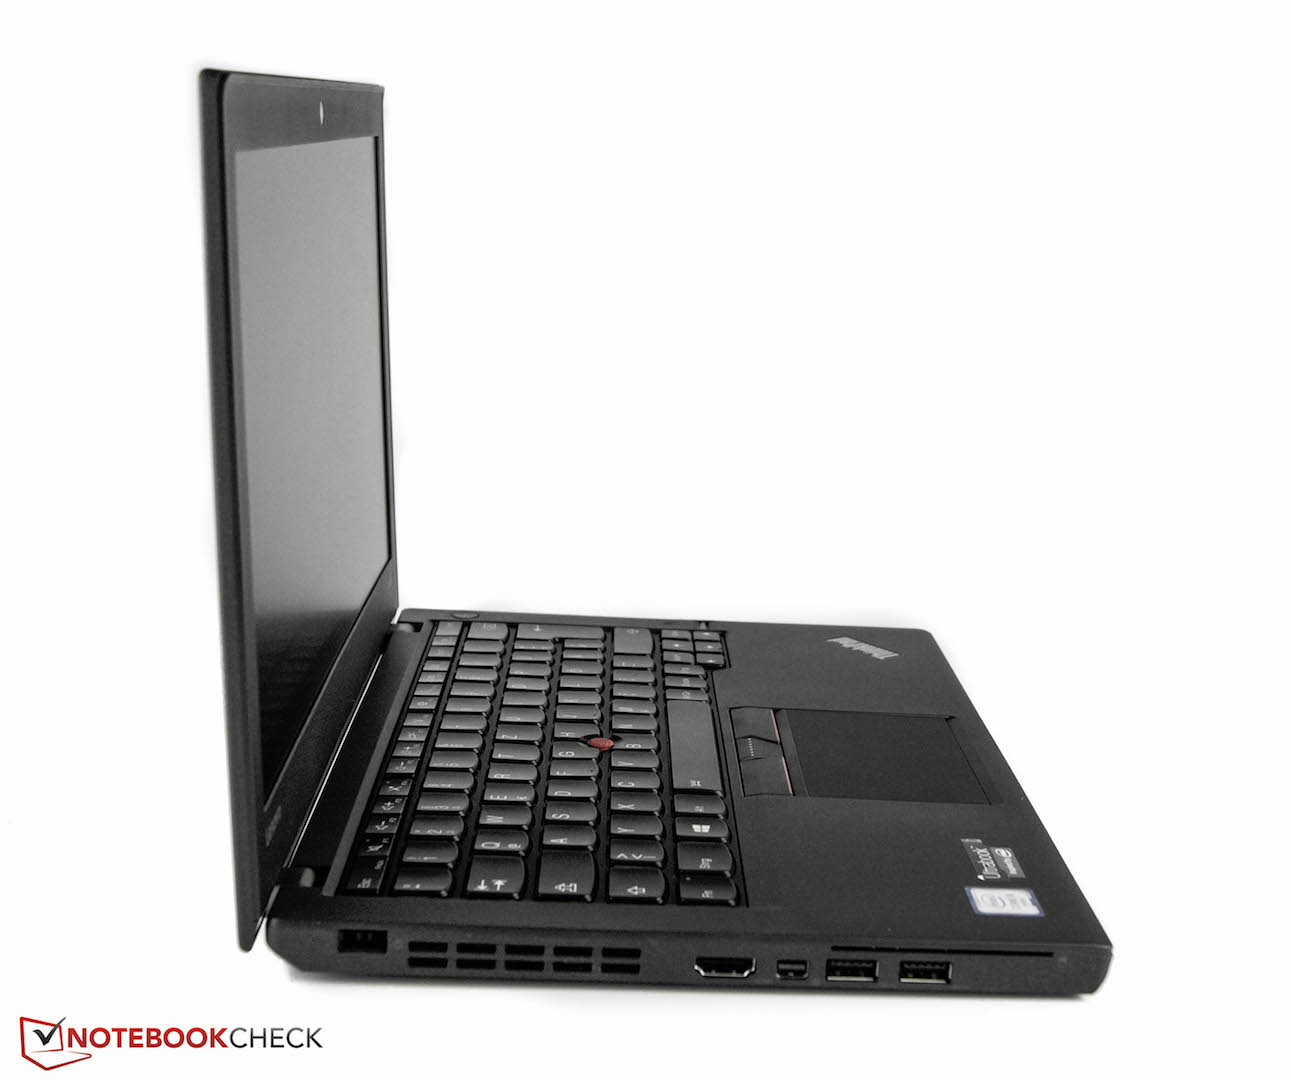
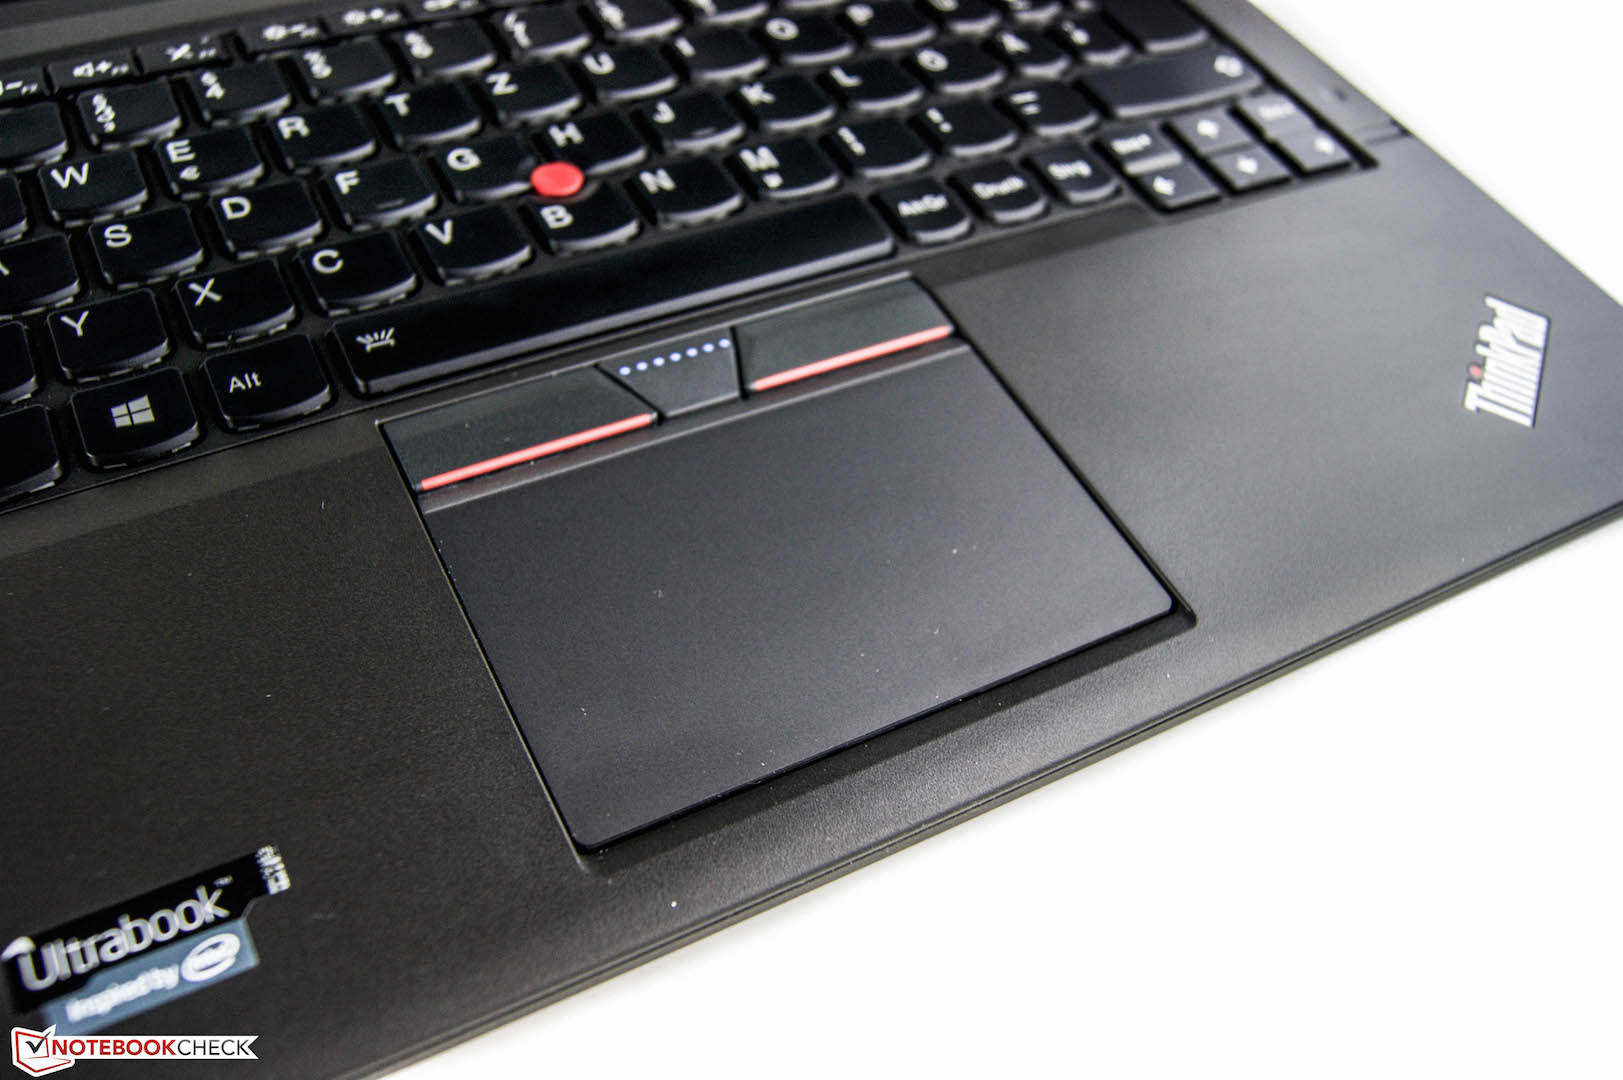
"Optimized for Business". Lenovo utilizza queste parole per descrivere il nuovo Lenovo ThinkPad X260. Possiamo confermarlo per vari aspetti. Si parte con lo chassis, ben costruito e robusto. Gli standars militari garantiscono una certa resistenza alle pressioni, il che è realistico in ambiente business. Possiamo trovare qualche piccola pecca nella qualità di costruzione, nonostante il prezzo elevato. I portatili di questa classe sono progettati innanzitutto per applicazioni da ufficio, e Lenovo alza l'asticella a questo riguardo. Ad eccezione di piccole cose, la tastiera rispecchia le attese di un portatile business. Il touchpad d'altro canto potrebbe essere migliorato.
Abbiamo valutato il display IPS, che ci ha convinti con la superficie matta e la buona qualità dell'immagine. La risoluzione è sfortunatamente abbastanza bassa e la luminosità appena media.
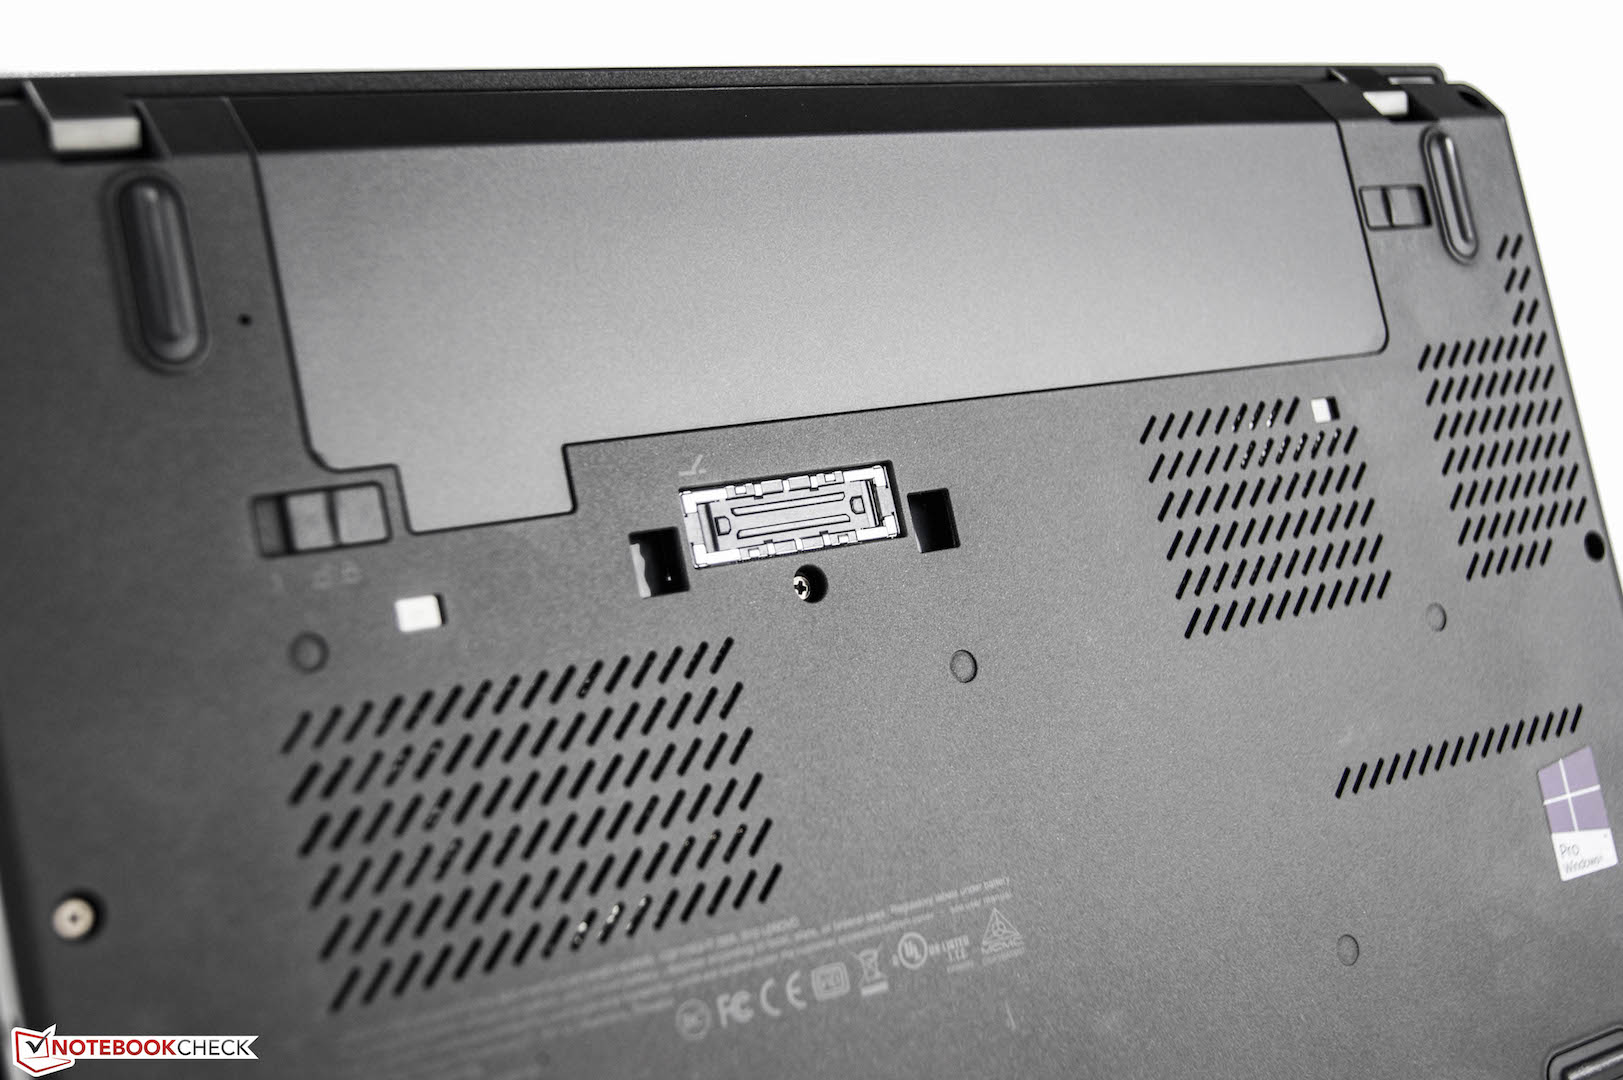
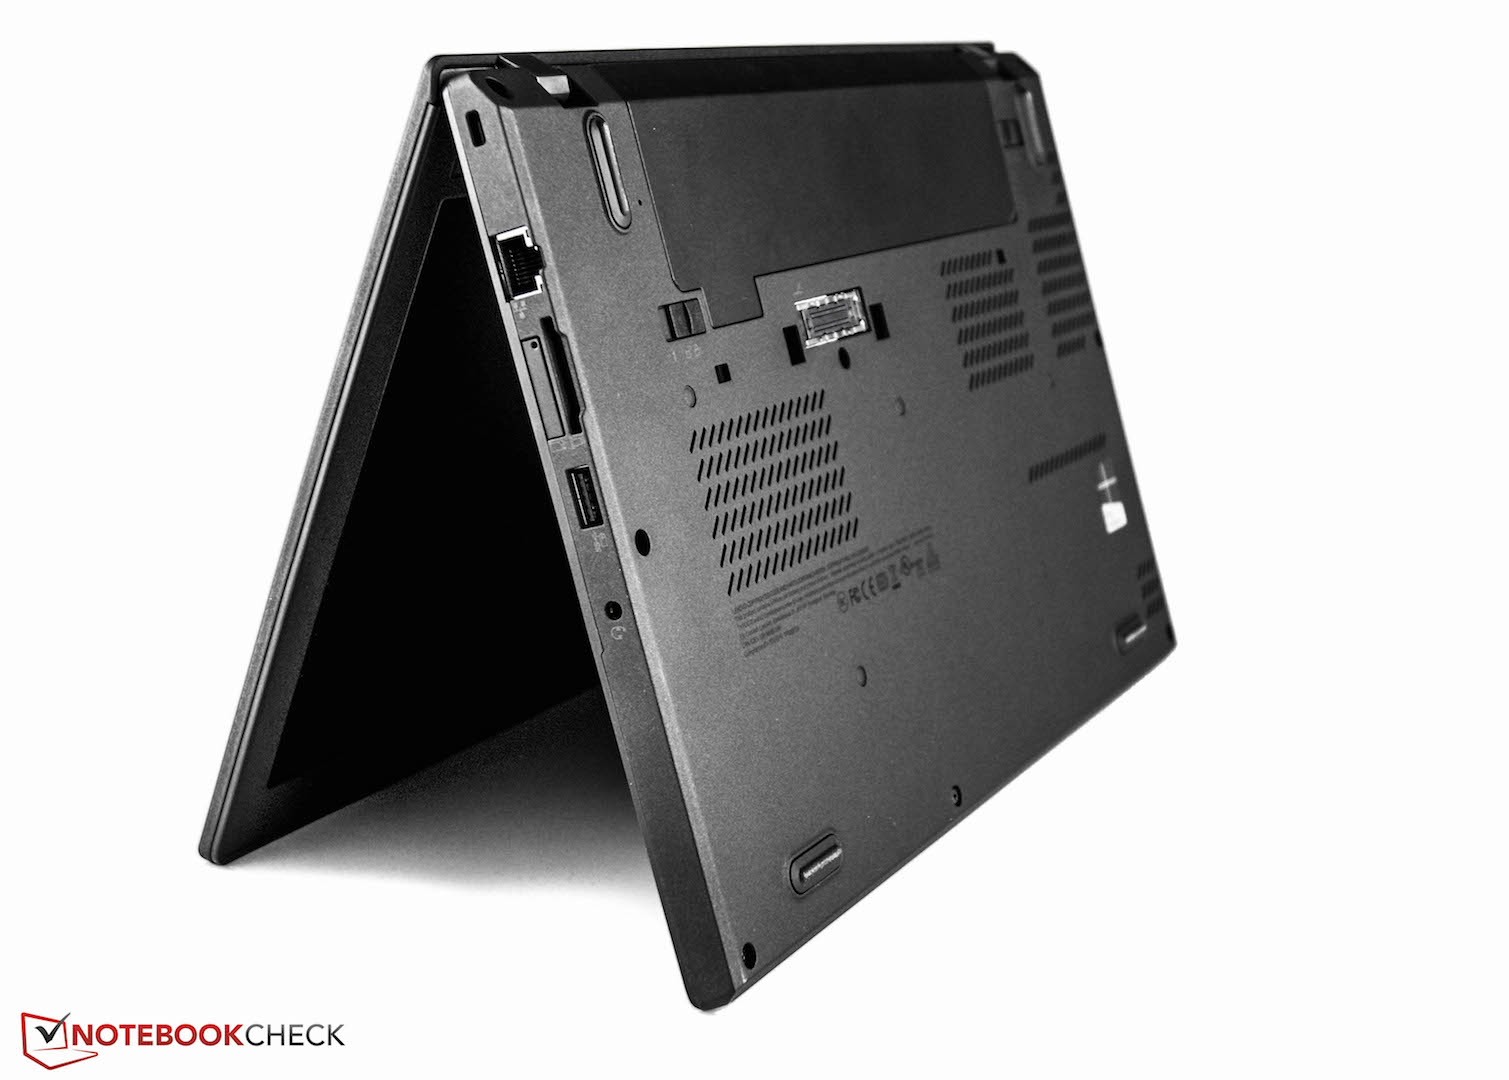
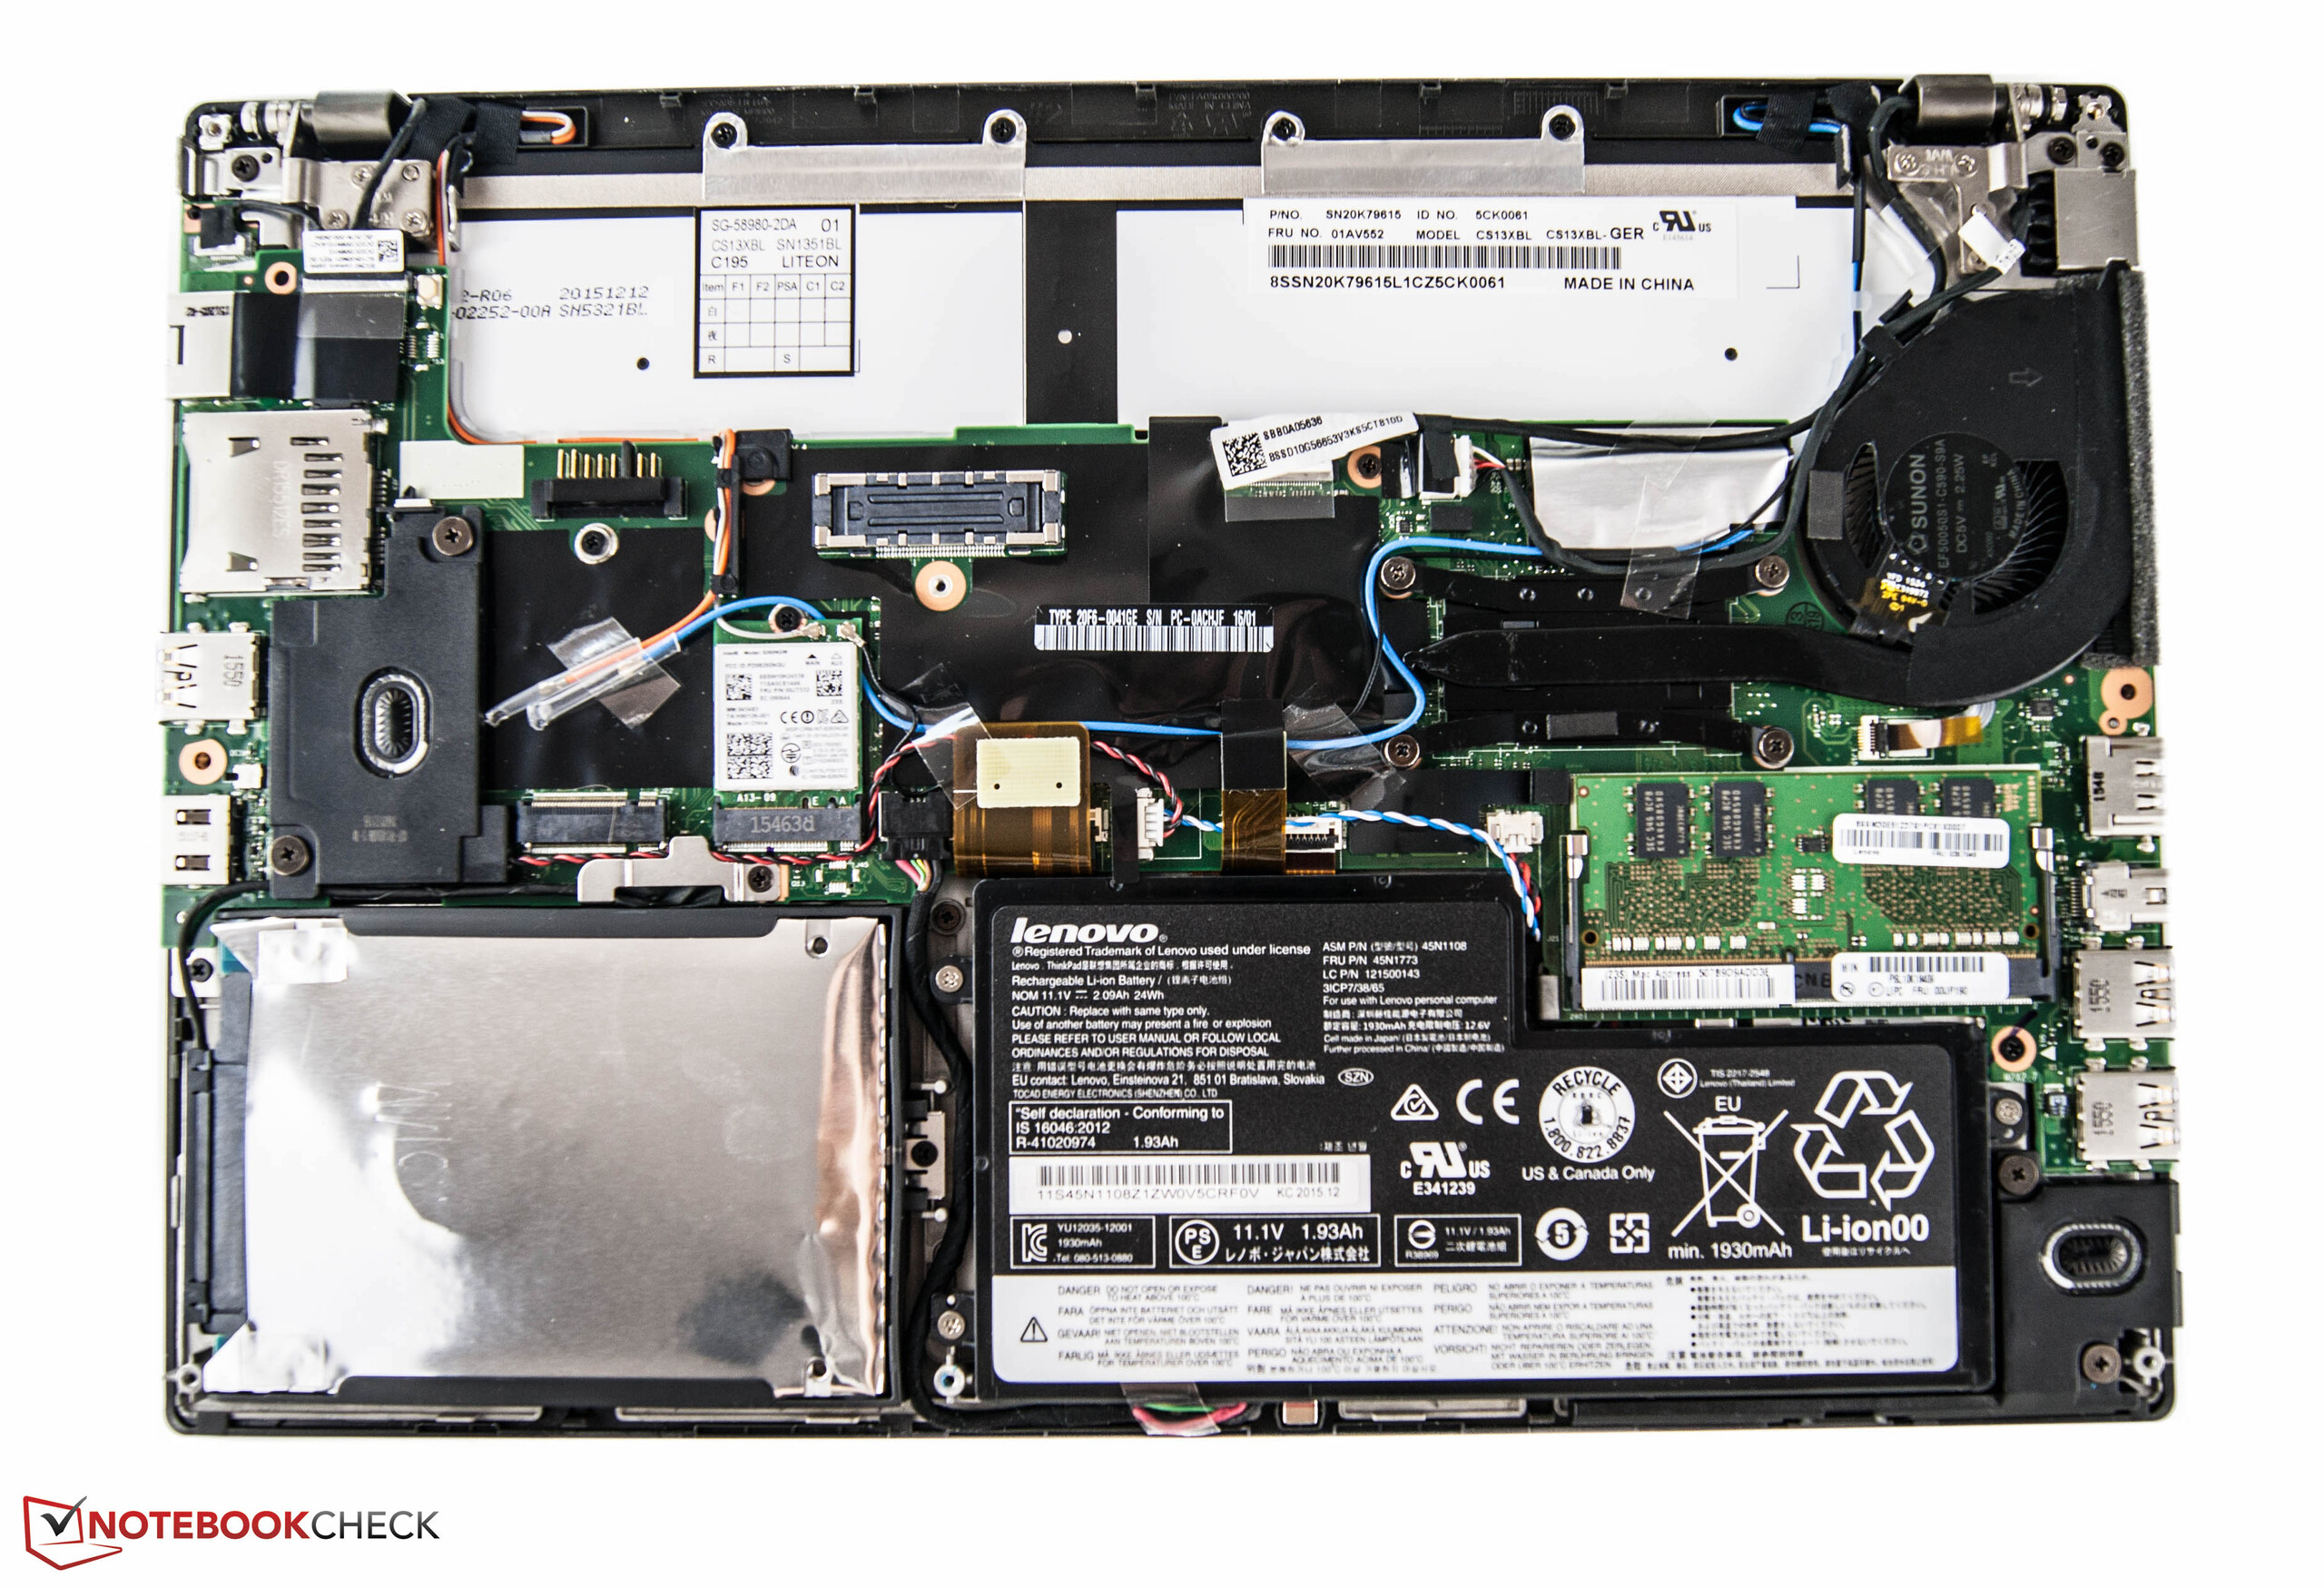
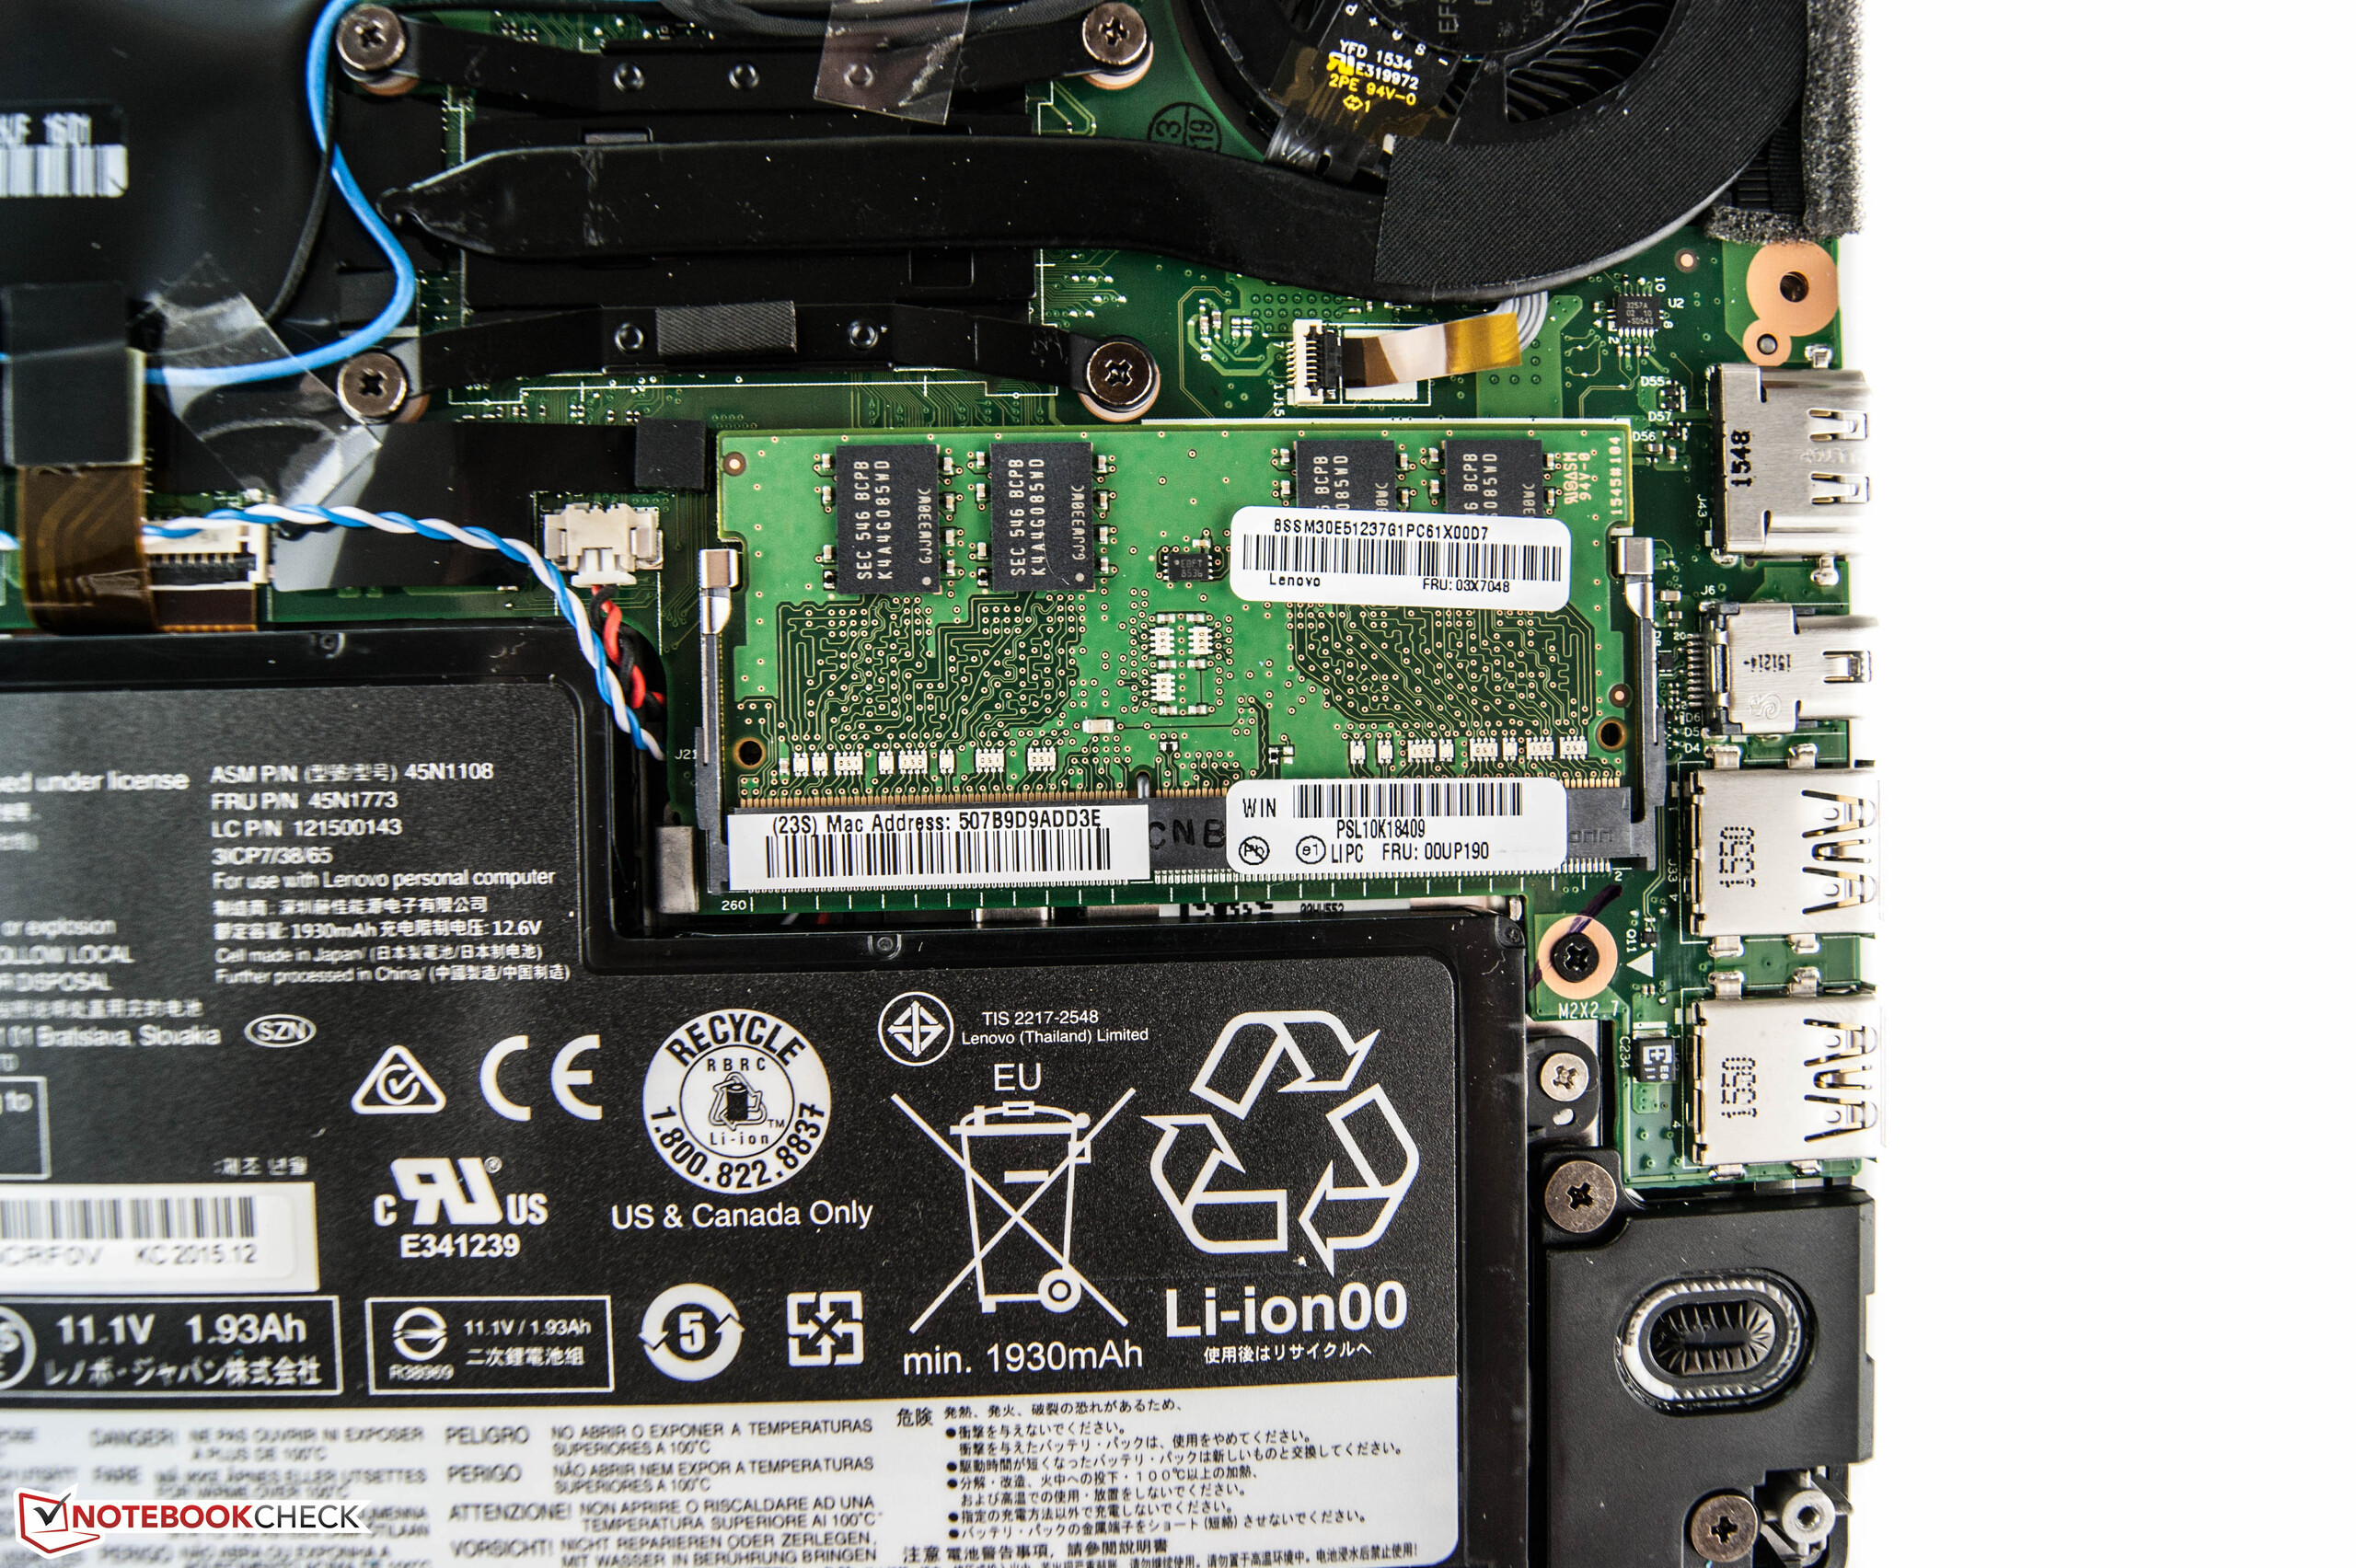
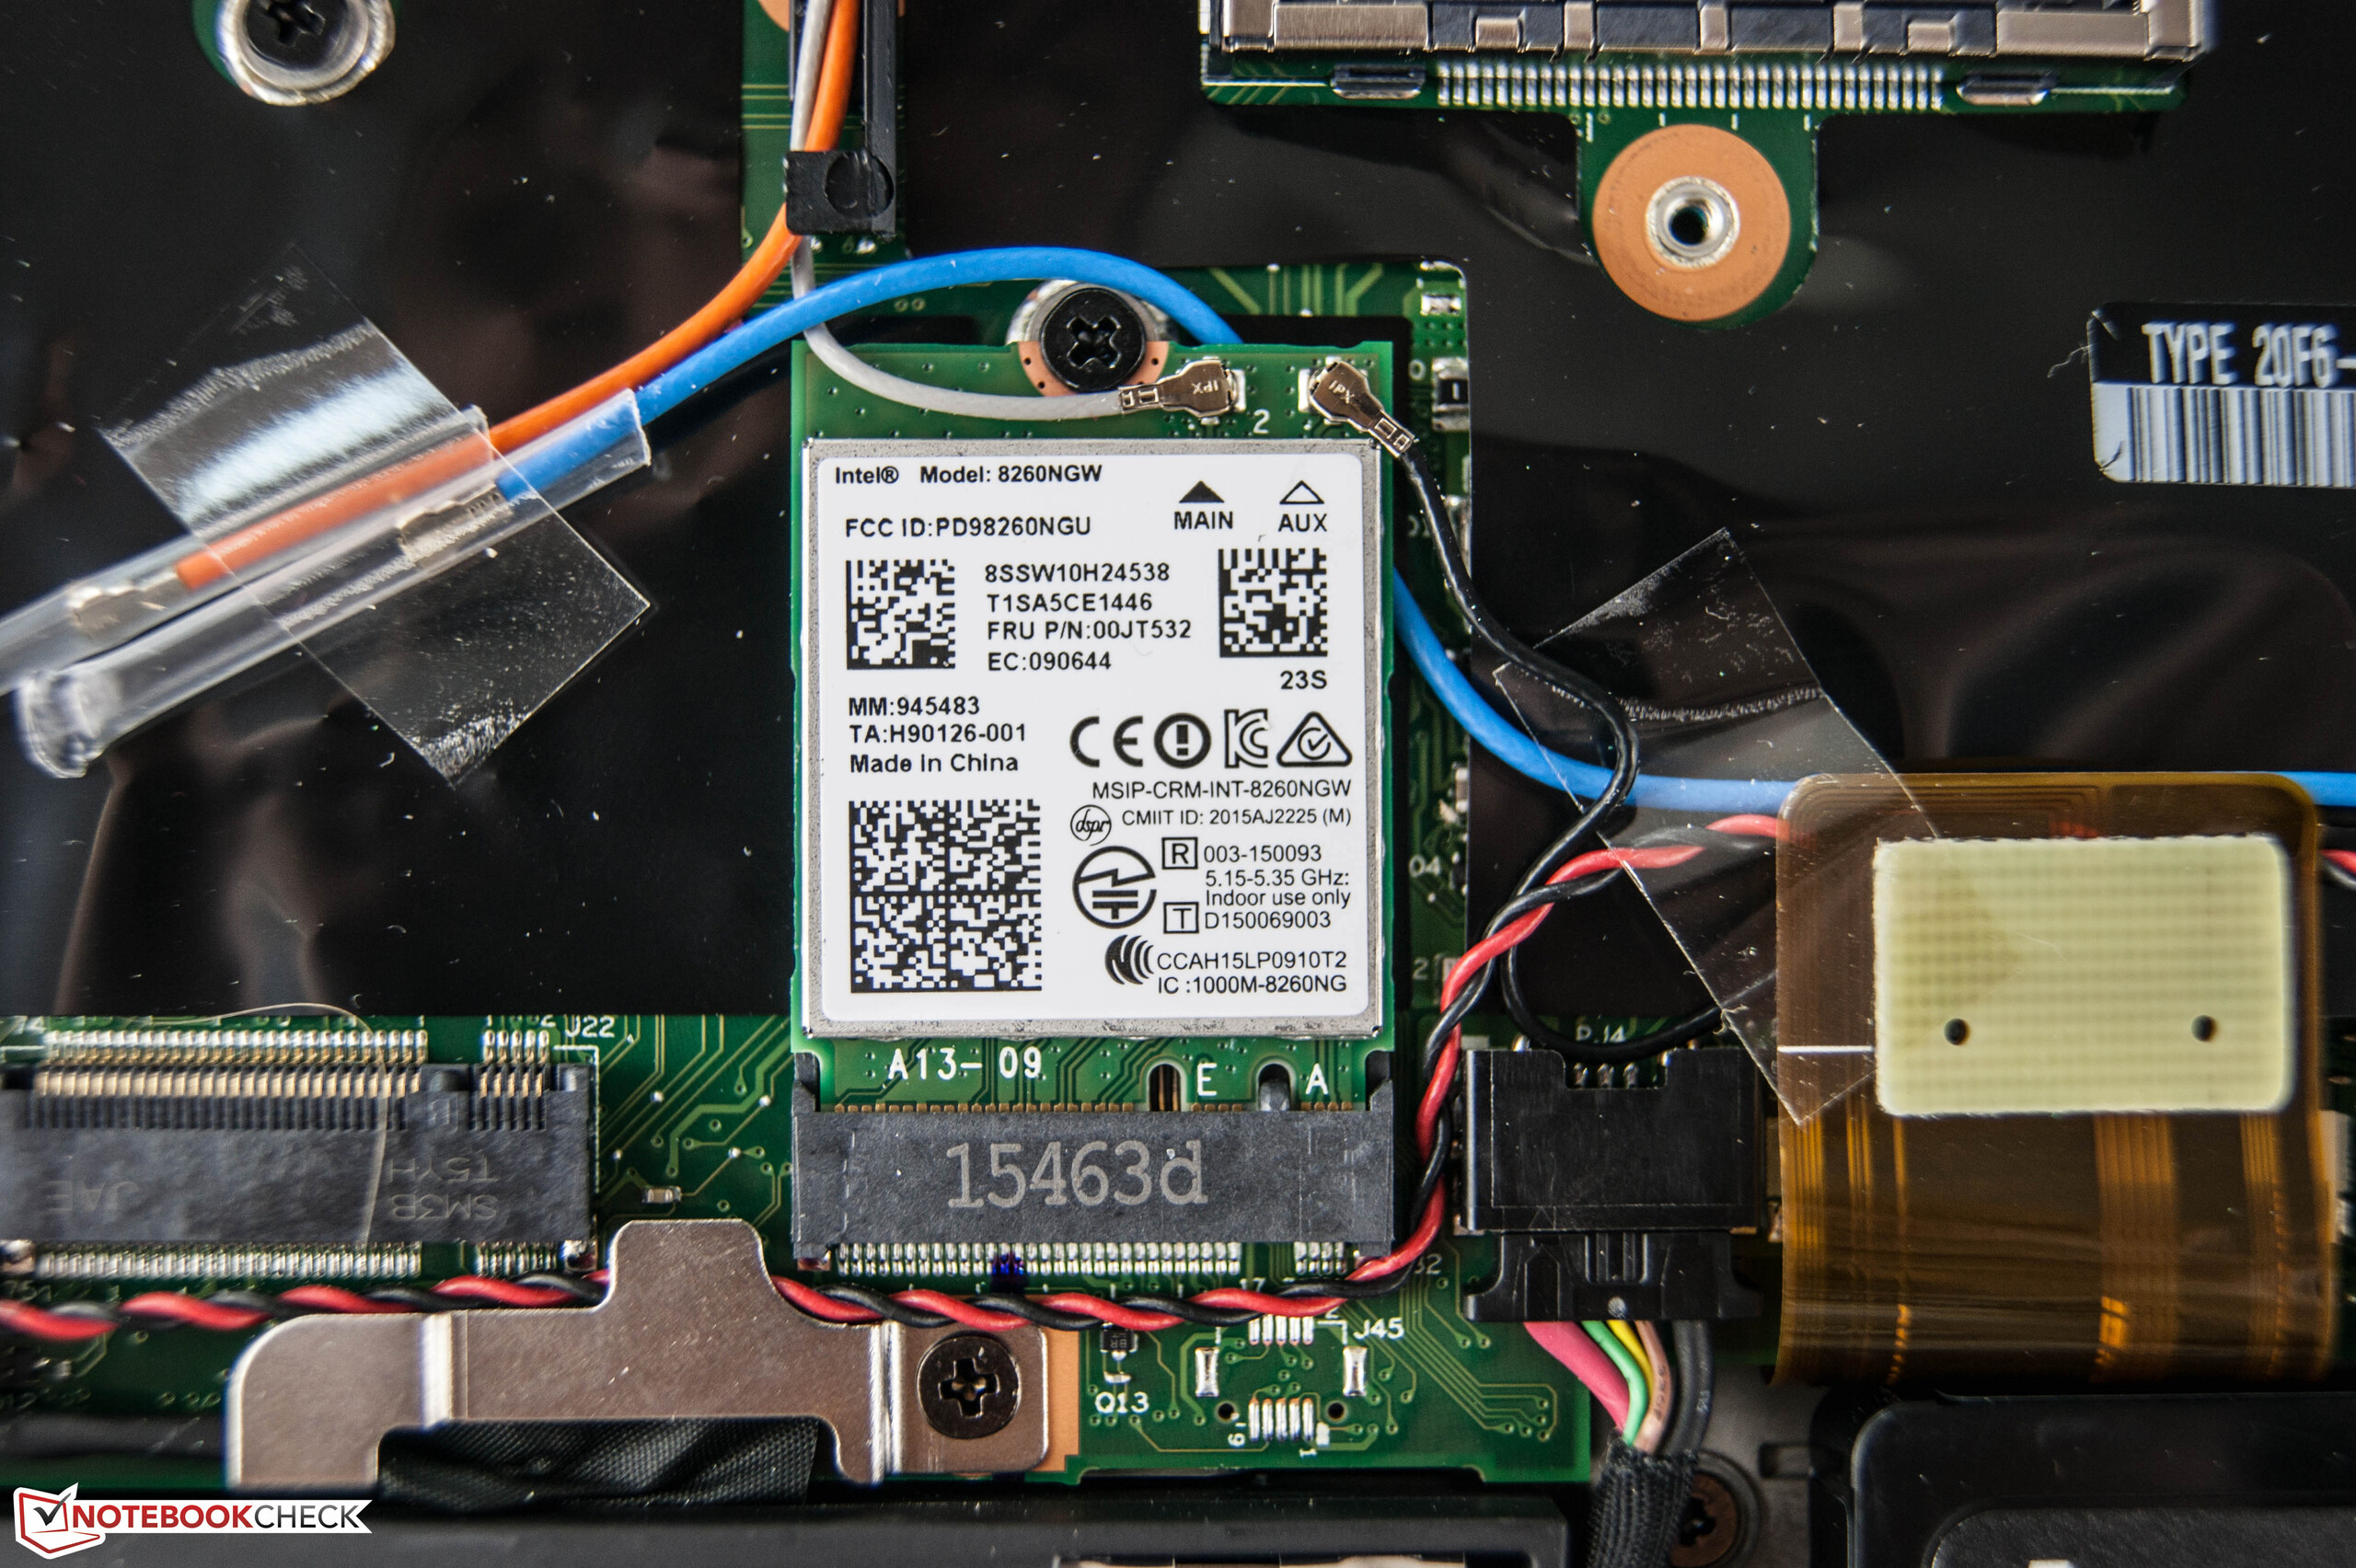
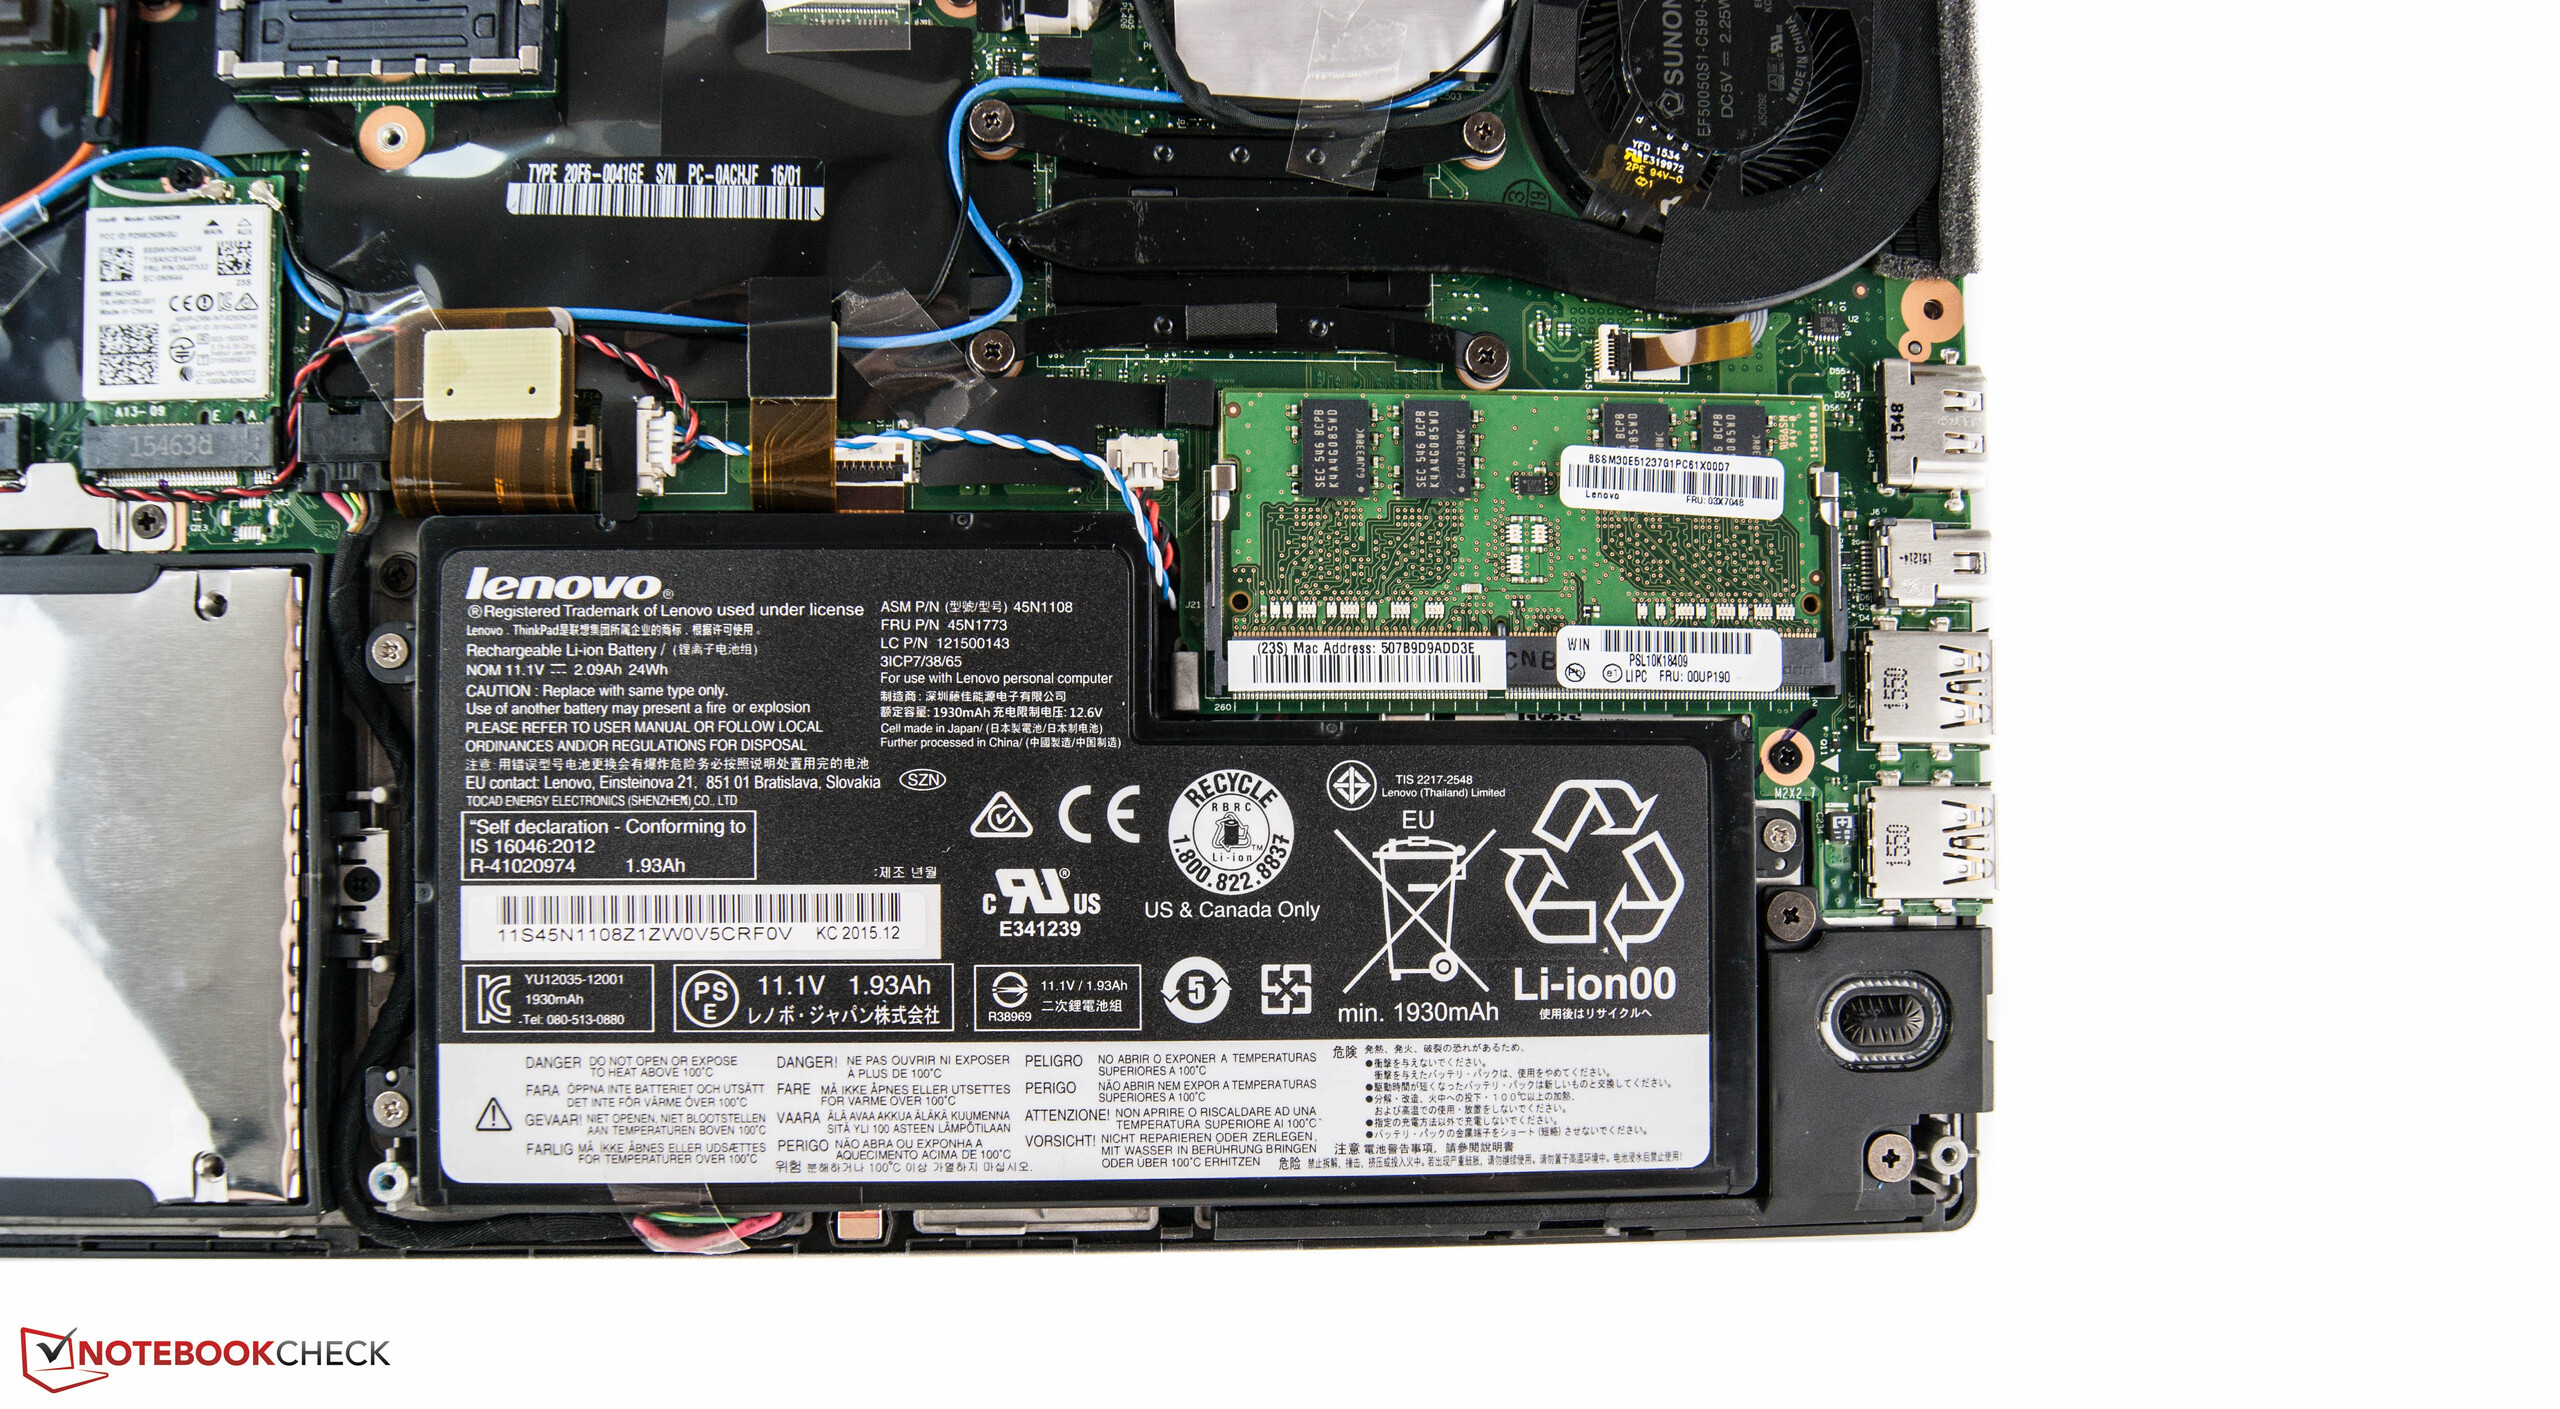
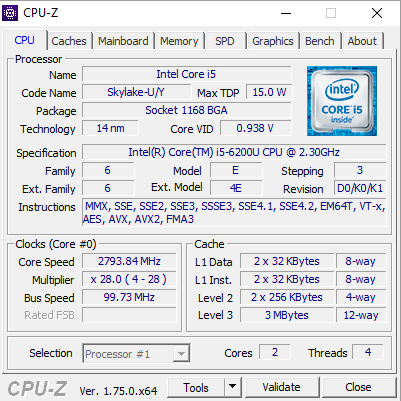
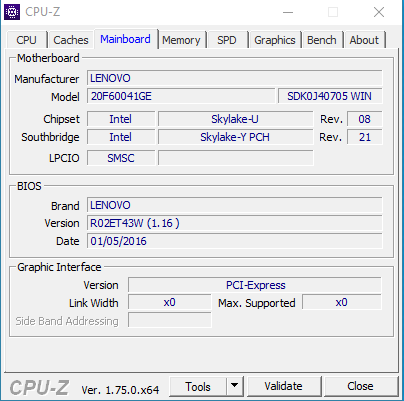
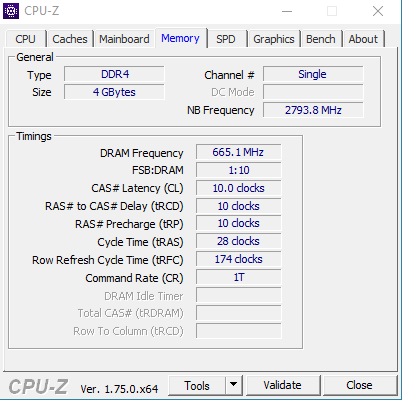
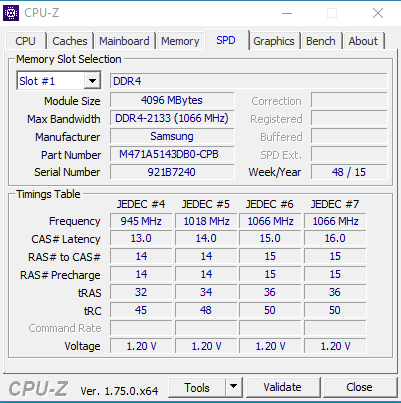
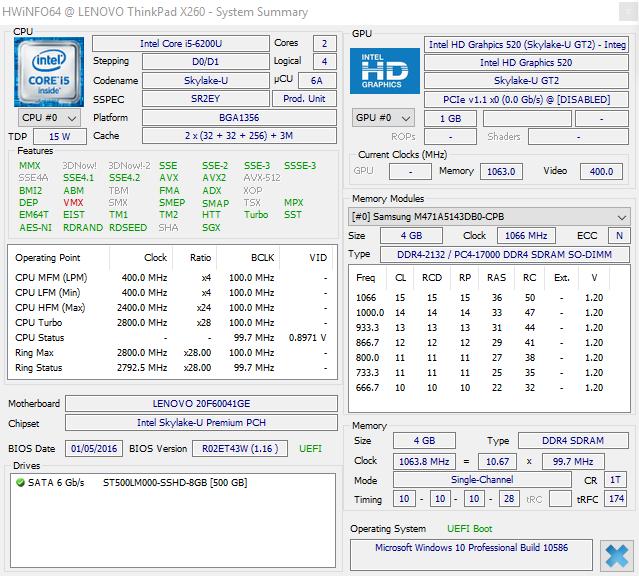
Uno sguardo dentro il modello recensito mostra un solido pacchetto hardware. Sfortunatamente c'è un solo slot DDR4-RAM, quindi potete usare solo una configurazione single-channel. Nel complesso, tuttavia, il sistema ha prestazioni convincenti. Se cercate maggiore potenza, dovete pagare di più e prendere un higher-end SKU. Oltre le decenti emissioni, ci ha convinto la tecnologia Power Bridge. Utilizza due batterie, quindi una può essere sostituita "al volo.
Lenovo offre un portatile da 12.5" business solido e di successo nel complesso. La nostra configurazione soffre per alcune pecche. Vogliamo vedere se altre configurazioni avranno un punteggio migliore.
In base alle preferenze personali sulle singole sezioni, potrebbe essere una buona idea dare uno sguardo alla concorrenza. Il Dell Latitude 12 E7250, ad esempio, ha un display più luminoso.
Nota: si tratta di una recensione breve, con alcune sezioni non tradotte, per la versione integrale in inglese guardate qui.
Lenovo ThinkPad X260-20F60041GE
-
03/10/2016 v5(old)
Nino Ricchizzi
Pricecompare
