 Deutsch
 English
 Español
 Français
 Italiano
 Nederlands
 Polski
 Português
 Русский
 Türkçe
 Svenska
 Chinese
 Magyar
Recensione Breve del Tablet Dell Latitude 11 5175
| |||||||||||||||||||||||||
Distribuzione della luminosità: 86 %
Al centro con la batteria: 461 cd/m²
Contrasto: 1027:1 (Nero: 0.45 cd/m²)
ΔE Color 4.4 | 0.5-29.43 Ø5
ΔE Greyscale 3.49 | 0.57-98 Ø5.3
80.76% sRGB (Argyll 1.6.3 3D)
53.21% AdobeRGB 1998 (Argyll 1.6.3 3D)
59.3% AdobeRGB 1998 (Argyll 2.2.0 3D)
81.1% sRGB (Argyll 2.2.0 3D)
63.4% Display P3 (Argyll 2.2.0 3D)
Gamma: 2.55
| Dell Latitude 11 5175 HD Graphics 515, 6Y57, Samsung PM871 MZYLN256HCHP | Microsoft Surface Pro 4, Core m3 HD Graphics 515, 6Y30, Samsung MZFLV128 NVMe | HP Elite x2 1011 G1 HD Graphics 5300, 5Y51, Samsung SSD PM851 256 GB MZNTE256HMHP | HP Elite x2 1012 G1 HD Graphics 515, 6Y54, Liteon L8H-256V2G | Lenovo ThinkPad Helix 2 HD Graphics 5300, 5Y71, Toshiba THNSFJ256GDNU 256 GB | HP Spectre x2 12-a003ng K3D42EA HD Graphics 515, 6Y75, Sandisk X300 SD7SN6S-256G-1006 | |
|---|---|---|---|---|---|---|
| Display | 14% | -24% | -11% | -13% | ||
| Display P3 Coverage | 63.4 | 67.5 6% | 44.4 -30% | 53.8 -15% | 52.9 -17% | |
| sRGB Coverage | 81.1 | 96.6 19% | 66.4 -18% | 73.7 -9% | 71.8 -11% | |
| AdobeRGB 1998 Coverage | 59.3 | 69 16% | 45.91 -23% | 53.8 -9% | 52.6 -11% | |
| Response Times | -31% | 20% | -1% | |||
| Response Time Grey 50% / Grey 80% * | 46 ? | 46 ? -0% | 33.2 ? 28% | 47 ? -2% | ||
| Response Time Black / White * | 26 ? | 31 ? -19% | 22.8 ? 12% | 26 ? -0% | ||
| PWM Frequency | 200 | 50 ? -75% | ||||
| Screen | 12% | -31% | -21% | 2% | -23% | |
| Brightness middle | 462 | 389.2 -16% | 364 -21% | 322 -30% | 365 -21% | 353 -24% |
| Brightness | 449 | 392 -13% | 331 -26% | 319 -29% | 342 -24% | 347 -23% |
| Brightness Distribution | 86 | 92 7% | 84 -2% | 97 13% | 86 0% | 91 6% |
| Black Level * | 0.45 | 0.27 40% | 0.44 2% | 0.42 7% | 0.329 27% | 0.44 2% |
| Contrast | 1027 | 1441 40% | 827 -19% | 767 -25% | 1109 8% | 802 -22% |
| Colorchecker dE 2000 * | 4.4 | 3.61 18% | 7.32 -66% | 6.02 -37% | 4.37 1% | 6.09 -38% |
| Colorchecker dE 2000 max. * | 9.21 | 10.06 -9% | ||||
| Greyscale dE 2000 * | 3.49 | 3.8 -9% | 7.37 -111% | 6.29 -80% | 2.8 20% | 6.24 -79% |
| Gamma | 2.55 86% | 2.16 102% | 2.03 108% | 2.4 92% | 2.3 96% | 2.41 91% |
| CCT | 6256 104% | 5969 109% | 6479 100% | 7712 84% | 6595 99% | 7238 90% |
| Color Space (Percent of AdobeRGB 1998) | 53.21 | 63 18% | 42.2 -21% | 47.8 -10% | 46 -14% | |
| Color Space (Percent of sRGB) | 80.76 | 97 20% | 66.1 -18% | 73.2 -9% | 71 -12% | |
| Media totale (Programma / Settaggio) | -2% /
3% | -28% /
-29% | -4% /
-13% | 2% /
2% | -12% /
-18% |
* ... Meglio usare valori piccoli
Tempi di risposta del Display
| ↔ Tempi di risposta dal Nero al Bianco | ||
|---|---|---|
| 26 ms ... aumenta ↗ e diminuisce ↘ combinato | ↗ 7.2 ms Incremento | 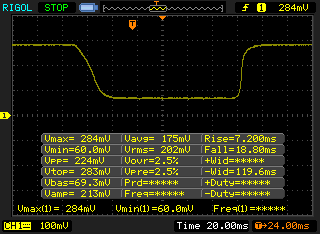 |
| ↘ 18.8 ms Calo | ||
| Lo schermo mostra tempi di risposta relativamente lenti nei nostri tests e potrebbe essere troppo lento per i gamers. In confronto, tutti i dispositivi di test variano da 0.1 (minimo) a 240 (massimo) ms. » 57 % di tutti i dispositivi è migliore. Questo significa che i tempi di risposta rilevati sono peggiori rispetto alla media di tutti i dispositivi testati (21.5 ms). | ||
| ↔ Tempo di risposta dal 50% Grigio all'80% Grigio | ||
| 46 ms ... aumenta ↗ e diminuisce ↘ combinato | ↗ 19 ms Incremento | 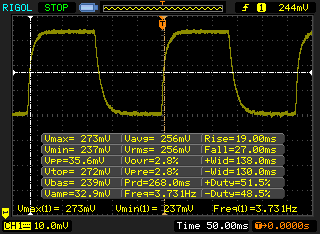 |
| ↘ 27 ms Calo | ||
| Lo schermo mostra tempi di risposta lenti nei nostri tests e sarà insoddisfacente per i gamers. In confronto, tutti i dispositivi di test variano da 0.2 (minimo) a 636 (massimo) ms. » 76 % di tutti i dispositivi è migliore. Questo significa che i tempi di risposta rilevati sono peggiori rispetto alla media di tutti i dispositivi testati (33.7 ms). | ||
Sfarfallio dello schermo / PWM (Pulse-Width Modulation)
| flickering dello schermo / PWM rilevato | 200 Hz | 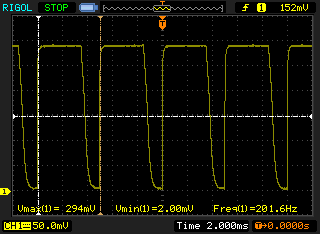 | |
Il display sfarfalla a 200 Hz (Probabilmente a causa dell'uso di PWM) . La frequenza di 200 Hz è relativamente bassa, quindi gli utenti sensibili potrebbero notare il flickering ed accusare stanchezza agli occhi a questo livello di luminosità e a livelli inferiori. In confronto: 53 % di tutti i dispositivi testati non utilizza PWM per ridurre la luminosita' del display. Se è rilevato PWM, una media di 17900 (minimo: 5 - massimo: 3846000) Hz è stata rilevata. | |||
| Cinebench R10 | |
| Rendering Multiple CPUs 64Bit (ordina per valore) | |
| Dell Latitude 11 5175 | |
| Microsoft Surface Pro 4, Core m3 | |
| Lenovo ThinkPad Helix 2 | |
| HP Spectre x2 12-a003ng K3D42EA | |
| Rendering Single CPUs 64Bit (ordina per valore) | |
| Dell Latitude 11 5175 | |
| Microsoft Surface Pro 4, Core m3 | |
| Lenovo ThinkPad Helix 2 | |
| HP Spectre x2 12-a003ng K3D42EA | |
| PCMark 7 Score | 4289 punti | |
| PCMark 8 Home Score Accelerated v2 | 2641 punti | |
| PCMark 8 Creative Score Accelerated v2 | 2905 punti | |
| PCMark 8 Work Score Accelerated v2 | 3720 punti | |
Aiuto | ||

| 3DMark 11 Performance | 951 punti | |
| 3DMark Ice Storm Standard Score | 35822 punti | |
| 3DMark Cloud Gate Standard Score | 3748 punti | |
| 3DMark Fire Strike Score | 545 punti | |
| 3DMark Fire Strike Extreme Score | 274 punti | |
Aiuto | ||
| basso | medio | alto | ultra | |
| BioShock Infinite (2013) | 32.99 | 17.76 | 15.32 | 4.39 |
| Battlefield 4 (2013) | 22.56 | 15.23 | 9.69 | 5.64 |
| Rise of the Tomb Raider (2016) | 7.96 | 5.18 |
(±) La temperatura massima sul lato superiore è di 44.1 °C / 111 F, rispetto alla media di 33.8 °C / 93 F, che varia da 20.7 a 53.2 °C per questa classe Tablet.
(±) Il lato inferiore si riscalda fino ad un massimo di 43.3 °C / 110 F, rispetto alla media di 33.3 °C / 92 F
(+) In idle, la temperatura media del lato superiore è di 29.3 °C / 85 F, rispetto alla media deld ispositivo di 30 °C / 86 F.
| Dell Latitude 11 5175 HD Graphics 515, 6Y57, Samsung PM871 MZYLN256HCHP | HP Elite x2 1011 G1 HD Graphics 5300, 5Y51, Samsung SSD PM851 256 GB MZNTE256HMHP | HP Elite x2 1012 G1 HD Graphics 515, 6Y54, Liteon L8H-256V2G | Lenovo ThinkPad Helix 2 HD Graphics 5300, 5Y71, Toshiba THNSFJ256GDNU 256 GB | HP Spectre x2 12-a003ng K3D42EA HD Graphics 515, 6Y75, Sandisk X300 SD7SN6S-256G-1006 | |
|---|---|---|---|---|---|
| Power Consumption | 21% | -46% | -15% | -37% | |
| Idle Minimum * | 2.7 | 1.5 44% | 3.7 -37% | 2 26% | 4.5 -67% |
| Idle Average * | 5.8 | 4 31% | 6.8 -17% | 6 -3% | 7.7 -33% |
| Idle Maximum * | 6.6 | 5 24% | 7.6 -15% | 6.6 -0% | 8.3 -26% |
| Load Average * | 15.2 | 13.9 9% | 22.5 -48% | 17.6 -16% | 19.8 -30% |
| Load Maximum * | 16.1 | 16.9 -5% | 34.5 -114% | 29.7 -84% | 20.6 -28% |
* ... Meglio usare valori piccoli
| Off / Standby | |
| Idle | |
| Sotto carico |
|
Leggenda:
min: Attualmente utilizziamo il Metrahit Energy, un multimetro digitale professionale per la misurazione della qualità della potenza e dell'energia monofase, per le nostre misurazioni. | |
| Dell Latitude 11 5175 35 Wh | Microsoft Surface Pro 4, Core m3 38 Wh | HP Elite x2 1011 G1 54 Wh | HP Elite x2 1012 G1 37 Wh | Lenovo ThinkPad Helix 2 35 Wh | HP Spectre x2 12-a003ng K3D42EA 42 Wh | |
|---|---|---|---|---|---|---|
| Autonomia della batteria | -2% | 55% | -6% | 8% | 1% | |
| Reader / Idle | 793 | 791 0% | 1063 34% | 732 -8% | 964 22% | 954 20% |
| H.264 | 411 | 658 60% | 432 5% | 360 -12% | ||
| WiFi v1.3 | 426 | 488 15% | 675 58% | 443 4% | 361 -15% | |
| Load | 172 | 138 -20% | 288 67% | 130 -24% | 197 15% | 166 -3% |
| WiFi | 396 |
Pro
Contro
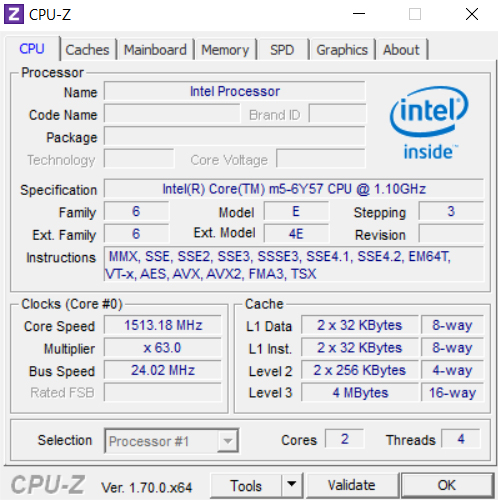
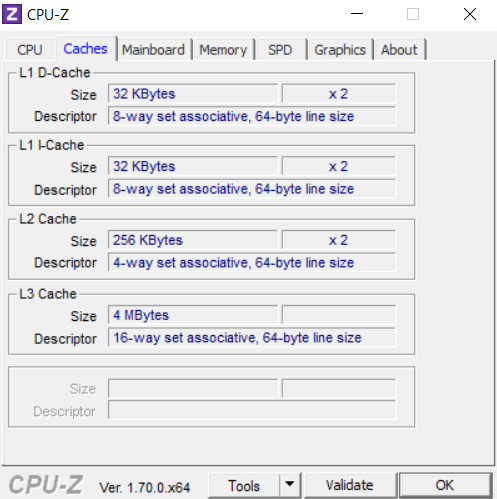
Il Dell Latitude 11 5175 è un decente tablet business con un case molto lineare. Il processore Intel Core m5-6Y57 ha sufficiente potenza per le attività quotidiane da ufficio. Il basso TDP del processore consente un raffreddamento passivo. Con 256 GB, l'SSD ha abbastanza spazio e garantisce un sistema fluido con buoni valori di lettura e scrittura. Il touchscreen Full HD offre una ottima luminosità e la possibilità di utilizzo anche all'aperto alla luce del sole. Il touchscreen funziona in modo preciso e reattivo agli inputs che sono implementati quasi immediatamente. Inoltre, il pannello IPS convince con l'ottima stabilità degli angoli di visuale. Un altro punto a favore è la buona autonomia che consente un prolungato utilizzo mobile.
Il tablet è un buon arrivo nel settore business. Tuttavia, non c'è modo di usare accessori proprietari per aumentare la produttività con il Dell 11 5175. La keyboard dock almeno dovrebbe essere sulla shopping list.
Il Dell Latitude 11 5175 deve accettare alcune critiche. Le prestazioni del processore non sono raggiunte in pieno. Pertanto si nota una netta perdita di prestazioni. Il Microsoft Surface Pro 4 che ha un Core m3 in rapporto gira più velocemente. Lo schermo non è raccomandabile per utilizzo professionale in quanto la copertura della gamma di colore è a un livello medio.
I potenziali clienti ora conoscono le capacità del Dell Latitude 11 5175 e quali sono le pecche. Coloro che possono convivere con un 1080p e con una limitata gamma di colore possono inserire questo dispositivo nella loro shortlist. Le performance della CPU sono sufficienti per un lavoro fluido nonostante le limitazioni. Difficilmente altri tablets possono ottenere la massima potenza dai processori Core m.
Nota: si tratta di una recensione breve, con alcune sezioni non tradotte, per la versione integrale in inglese guardate qui.
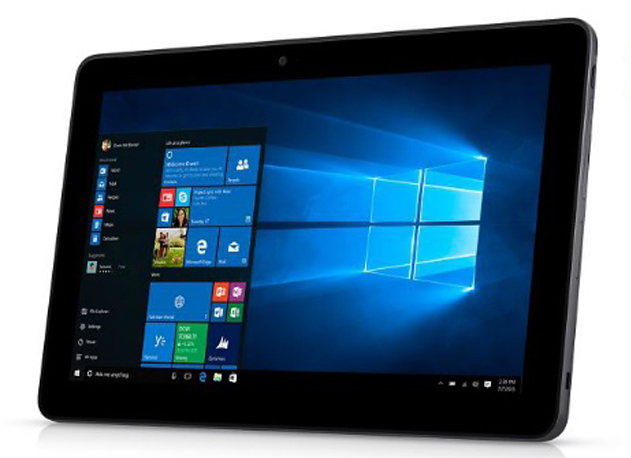
Dell Latitude 11 5175
-
04/19/2016 v5.1(old)
Sebastian Bade