 Deutsch
 English
 Español
 Français
 Italiano
 Nederlands
 Polski
 Português
 Русский
 Türkçe
 Svenska
 Chinese
 Magyar
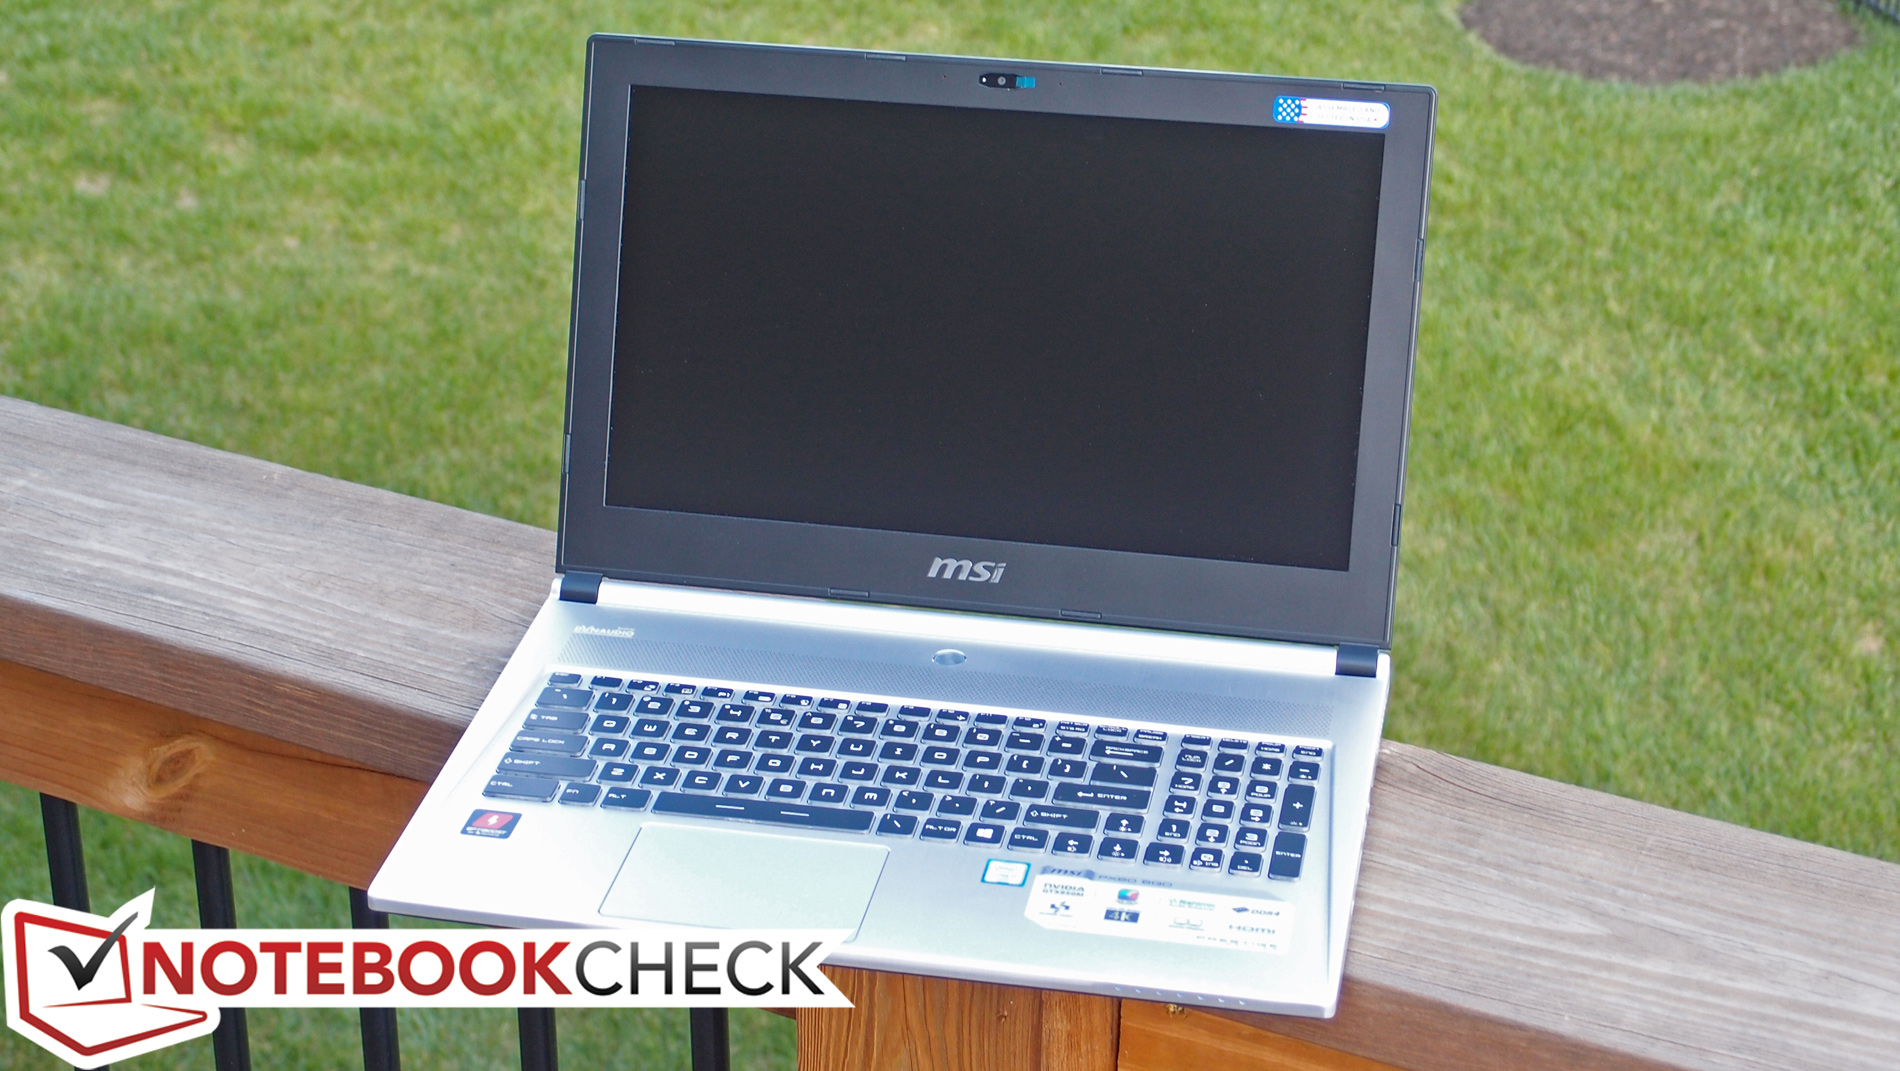
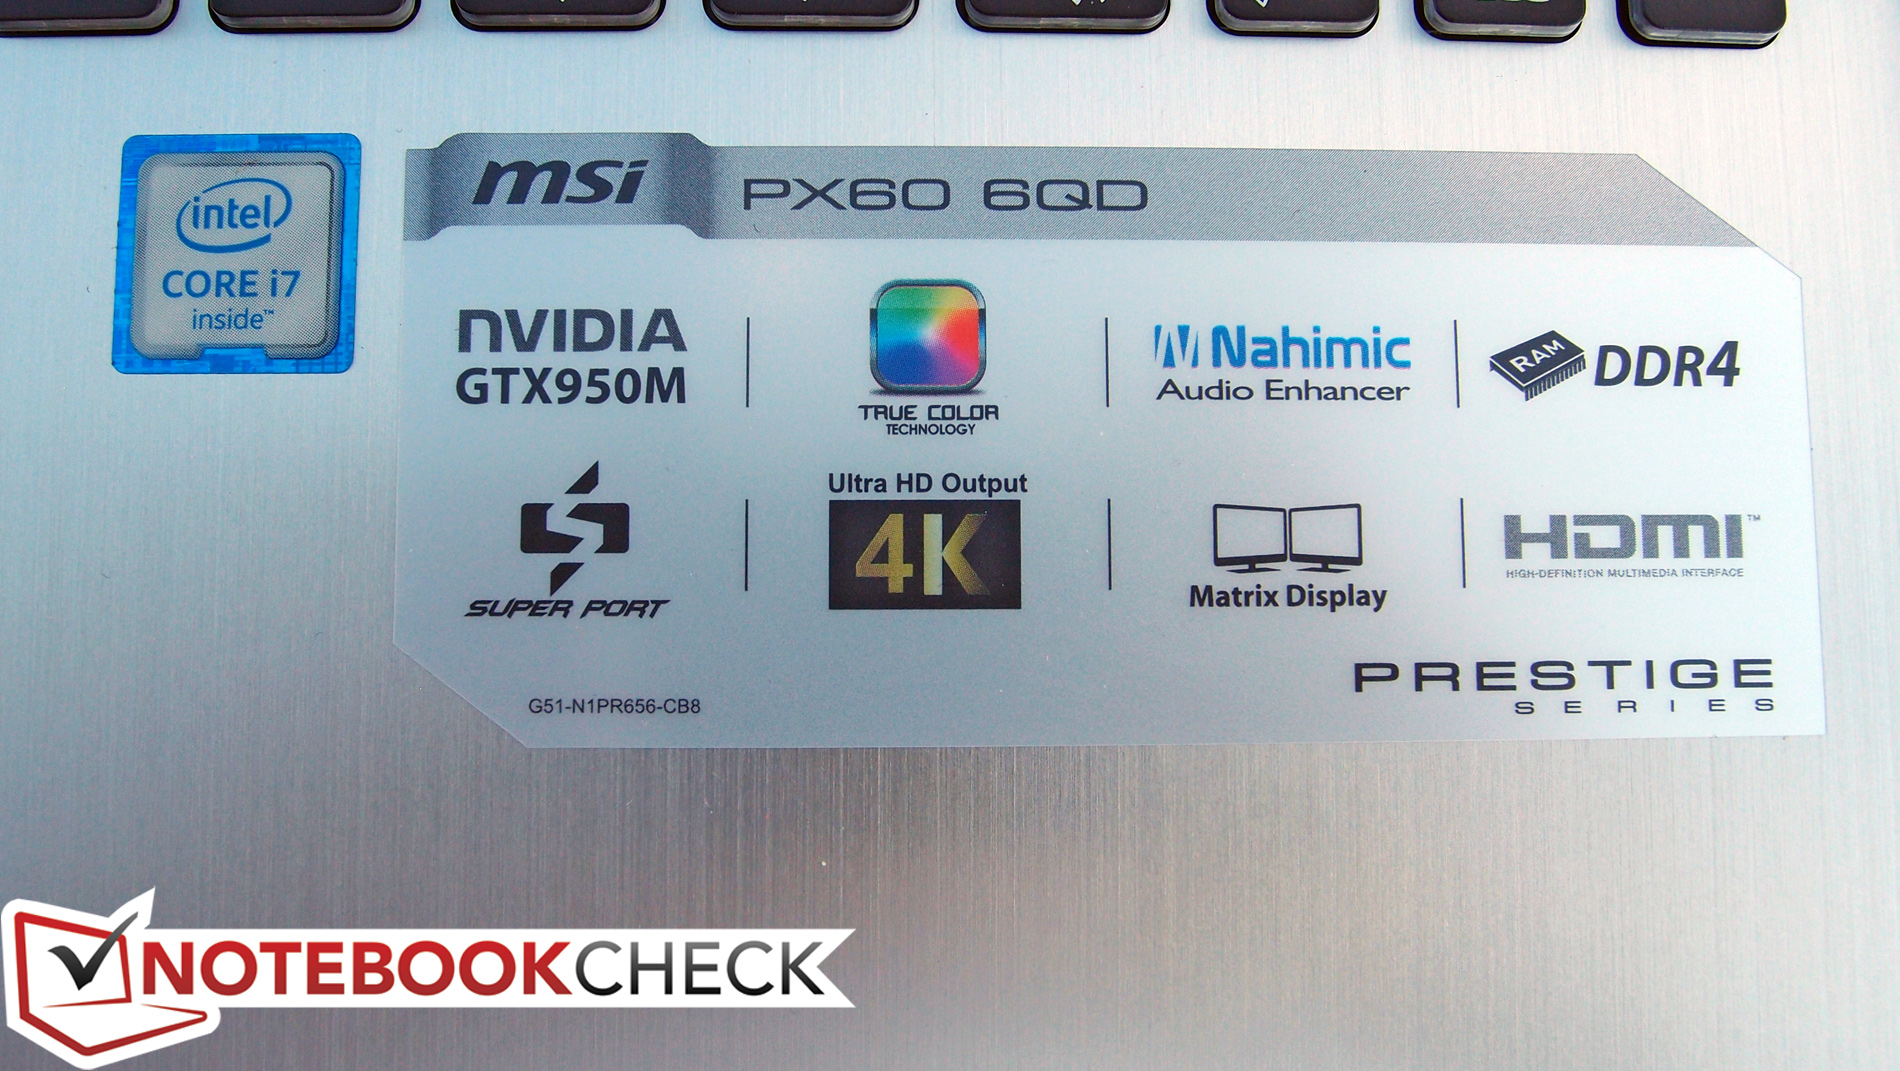
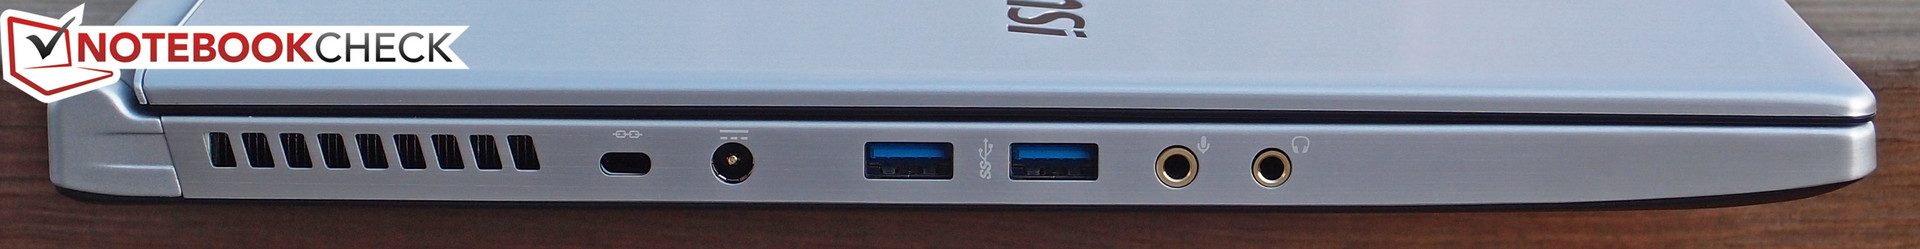
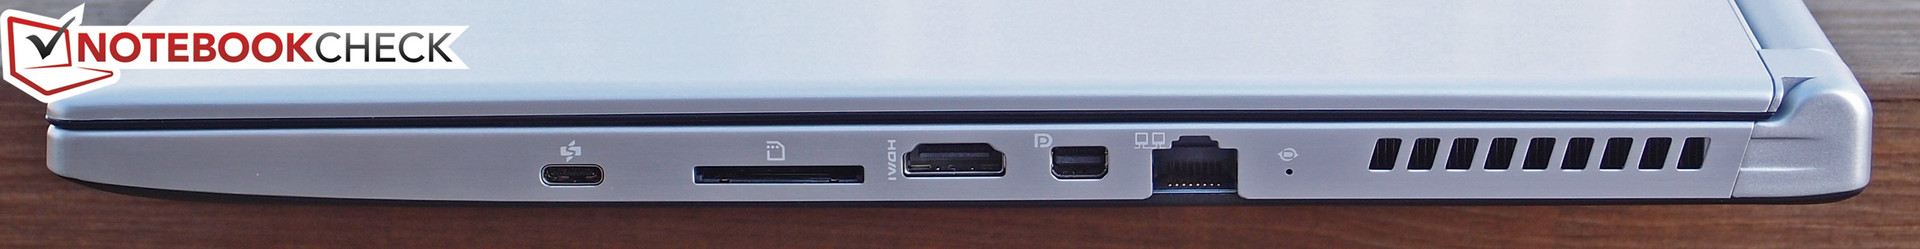
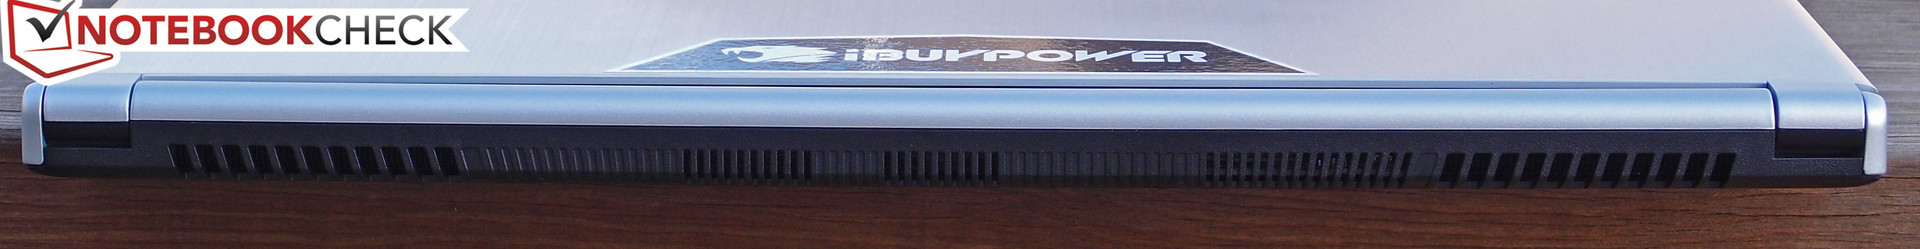
Recensione Breve del Portatile MSI PX60 6QD Prestige iBuyPower Edition

| |||||||||||||||||||||||||
Distribuzione della luminosità: 80 %
Al centro con la batteria: 221.1 cd/m²
Contrasto: 361:1 (Nero: 0.612 cd/m²)
ΔE Color 10.96 | 0.5-29.43 Ø5
ΔE Greyscale 11.8 | 0.57-98 Ø5.3
99.76% sRGB (Argyll 1.6.3 3D)
73.9% AdobeRGB 1998 (Argyll 1.6.3 3D)
83.1% AdobeRGB 1998 (Argyll 2.2.0 3D)
99.8% sRGB (Argyll 2.2.0 3D)
84.5% Display P3 (Argyll 2.2.0 3D)
Gamma: 2.17
| MSI PX60 6QD 15.60, 1920x1080 | MSI PX60 QD-034US 15.60, 1920x1080 | Lenovo ThinkPad T560 20FH001APB 15.60, 1920x1080 | HP ZBook 15 G3 15.60, 1920x1080 | Apple MacBook Pro Retina 15 inch 2015-05 15.40, 2880x1800 | Dell XPS 15-9550 i7 15.60, 3840x2160 | |
|---|---|---|---|---|---|---|
| Display | -13% | -47% | -14% | -20% | 8% | |
| Display P3 Coverage | 84.5 | 67 -21% | 40.93 -52% | 66.8 -21% | 61.4 -27% | 87.8 4% |
| sRGB Coverage | 99.8 | 97.7 -2% | 59.6 -40% | 95.5 -4% | 90.8 -9% | 100 0% |
| AdobeRGB 1998 Coverage | 83.1 | 69.2 -17% | 42.55 -49% | 69 -17% | 62.9 -24% | 99.4 20% |
| Response Times | -18% | -30% | ||||
| Response Time Grey 50% / Grey 80% * | 44.4 ? | 54 ? -22% | 58 ? -31% | |||
| Response Time Black / White * | 27.2 ? | 35.6 ? -31% | 35 ? -29% | |||
| PWM Frequency | 200 ? | 198 ? -1% | ||||
| Screen | 43% | 63% | 40% | 55% | 52% | |
| Brightness middle | 221.1 | 300.9 36% | 307.3 39% | 306 38% | 341 54% | 361 63% |
| Brightness | 208 | 285 37% | 285 37% | 289 39% | 315 51% | 344 65% |
| Brightness Distribution | 80 | 86 8% | 85 6% | 85 6% | 82 3% | 90 13% |
| Black Level * | 0.612 | 0.431 30% | 0.3 51% | 0.34 44% | 0.34 44% | 0.38 38% |
| Contrast | 361 | 698 93% | 1024 184% | 900 149% | 1003 178% | 950 163% |
| Colorchecker dE 2000 * | 10.96 | 1.79 84% | 5.1 53% | 2.07 81% | 5.34 51% | |
| Colorchecker dE 2000 max. * | 19.39 | 3.96 80% | 9.9 49% | 3.27 83% | ||
| Greyscale dE 2000 * | 11.8 | 2.19 81% | 7.4 37% | 1.9 84% | 4.84 59% | |
| Gamma | 2.17 101% | 2.29 96% | 2.37 93% | 2.62 84% | 2.21 100% | |
| CCT | 15654 42% | 6724 97% | 7263 89% | 6514 100% | 7395 88% | |
| Color Space (Percent of AdobeRGB 1998) | 73.9 | 63.1 -15% | 63 -15% | 58 -22% | 89 20% | |
| Color Space (Percent of sRGB) | 99.76 | 97.8 -2% | 95 -5% | 91 -9% | 100 0% | |
| Media totale (Programma / Settaggio) | 15% /
30% | 8% /
22% | 3% /
19% | 18% /
37% | 10% /
31% |
* ... Meglio usare valori piccoli
Tempi di risposta del Display
| ↔ Tempi di risposta dal Nero al Bianco | ||
|---|---|---|
| 27.2 ms ... aumenta ↗ e diminuisce ↘ combinato | ↗ 9.2 ms Incremento | 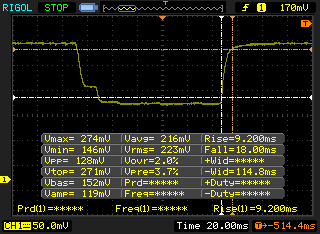 |
| ↘ 18 ms Calo | ||
| Lo schermo mostra tempi di risposta relativamente lenti nei nostri tests e potrebbe essere troppo lento per i gamers. In confronto, tutti i dispositivi di test variano da 0.1 (minimo) a 240 (massimo) ms. » 65 % di tutti i dispositivi è migliore. Questo significa che i tempi di risposta rilevati sono peggiori rispetto alla media di tutti i dispositivi testati (21.5 ms). | ||
| ↔ Tempo di risposta dal 50% Grigio all'80% Grigio | ||
| 44.4 ms ... aumenta ↗ e diminuisce ↘ combinato | ↗ 22.8 ms Incremento | 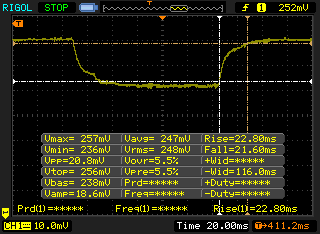 |
| ↘ 21.6 ms Calo | ||
| Lo schermo mostra tempi di risposta lenti nei nostri tests e sarà insoddisfacente per i gamers. In confronto, tutti i dispositivi di test variano da 0.2 (minimo) a 636 (massimo) ms. » 72 % di tutti i dispositivi è migliore. Questo significa che i tempi di risposta rilevati sono peggiori rispetto alla media di tutti i dispositivi testati (33.7 ms). | ||
Sfarfallio dello schermo / PWM (Pulse-Width Modulation)
| flickering dello schermo / PWM rilevato | 200 Hz | ≤ 99 % settaggio luminosita' | 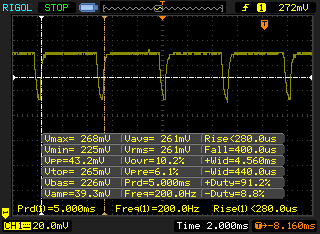 |
Il display sfarfalla a 200 Hz (Probabilmente a causa dell'uso di PWM) Flickering rilevato ad una luminosita' di 99 % o inferiore. Non dovrebbe verificarsi flickering o PWM sopra questo valore di luminosita'. La frequenza di 200 Hz è relativamente bassa, quindi gli utenti sensibili potrebbero notare il flickering ed accusare stanchezza agli occhi a questo livello di luminosità e a livelli inferiori. In confronto: 53 % di tutti i dispositivi testati non utilizza PWM per ridurre la luminosita' del display. Se è rilevato PWM, una media di 17900 (minimo: 5 - massimo: 3846000) Hz è stata rilevata. | |||
| Cinebench R11.5 | |
| CPU Single 64Bit (ordina per valore) | |
| MSI PX60 6QD | |
| MSI PX60 QD-034US | |
| Lenovo ThinkPad T560 20FH001APB | |
| HP ZBook 15 G3 | |
| Apple MacBook Pro Retina 15 inch 2015-05 | |
| Apple MacBook Pro Retina 15 inch 2015-05 | |
| Dell XPS 15-9550 i7 | |
| Dell Precision 5510 | |
| CPU Multi 64Bit (ordina per valore) | |
| MSI PX60 6QD | |
| MSI PX60 QD-034US | |
| Lenovo ThinkPad T560 20FH001APB | |
| HP ZBook 15 G3 | |
| Apple MacBook Pro Retina 15 inch 2015-05 | |
| Apple MacBook Pro Retina 15 inch 2015-05 | |
| Dell XPS 15-9550 i7 | |
| Dell Precision 5510 | |
| Cinebench R15 | |
| CPU Single 64Bit (ordina per valore) | |
| MSI PX60 6QD | |
| MSI PX60 QD-034US | |
| Lenovo ThinkPad T560 20FH001APB | |
| HP ZBook 15 G3 | |
| Apple MacBook Pro Retina 15 inch 2015-05 | |
| Apple MacBook Pro Retina 15 inch 2015-05 | |
| Dell XPS 15-9550 i7 | |
| Dell Precision 5510 | |
| CPU Multi 64Bit (ordina per valore) | |
| MSI PX60 6QD | |
| MSI PX60 QD-034US | |
| Lenovo ThinkPad T560 20FH001APB | |
| HP ZBook 15 G3 | |
| Apple MacBook Pro Retina 15 inch 2015-05 | |
| Apple MacBook Pro Retina 15 inch 2015-05 | |
| Dell XPS 15-9550 i7 | |
| Dell Precision 5510 | |
| PCMark 8 Home Score Accelerated v2 | 3590 punti | |
| PCMark 8 Creative Score Accelerated v2 | 4426 punti | |
| PCMark 8 Work Score Accelerated v2 | 4703 punti | |
Aiuto | ||

| 3DMark 11 - 1280x720 Performance (ordina per valore) | |
| MSI PX60 6QD | |
| MSI PX60 QD-034US | |
| Lenovo ThinkPad T560 20FH001APB | |
| HP ZBook 15 G3 | |
| Apple MacBook Pro Retina 15 inch 2015-05 | |
| Dell XPS 15-9550 i7 | |
| Dell Precision 5510 | |
| 3DMark | |
| 1920x1080 Fire Strike Score (ordina per valore) | |
| MSI PX60 6QD | |
| MSI PX60 QD-034US | |
| Lenovo ThinkPad T560 20FH001APB | |
| HP ZBook 15 G3 | |
| Apple MacBook Pro Retina 15 inch 2015-05 | |
| Dell XPS 15-9550 i7 | |
| Dell Precision 5510 | |
| 1280x720 Cloud Gate Standard Score (ordina per valore) | |
| MSI PX60 6QD | |
| MSI PX60 QD-034US | |
| Lenovo ThinkPad T560 20FH001APB | |
| HP ZBook 15 G3 | |
| Apple MacBook Pro Retina 15 inch 2015-05 | |
| Dell XPS 15-9550 i7 | |
| Dell Precision 5510 | |
| 1280x720 Ice Storm Standard Score (ordina per valore) | |
| MSI PX60 6QD | |
| MSI PX60 QD-034US | |
| Lenovo ThinkPad T560 20FH001APB | |
| HP ZBook 15 G3 | |
| Apple MacBook Pro Retina 15 inch 2015-05 | |
| Dell XPS 15-9550 i7 | |
| Dell Precision 5510 | |
| 3DMark 06 Standard Score | 23380 punti | |
| 3DMark Vantage P Result | 18030 punti | |
| 3DMark 11 Performance | 4740 punti | |
| 3DMark Ice Storm Standard Score | 85864 punti | |
| 3DMark Cloud Gate Standard Score | 16389 punti | |
| 3DMark Fire Strike Score | 3448 punti | |
Aiuto | ||
| basso | medio | alto | ultra | QHD | 4K | |
| BioShock Infinite (2013) | 166 | 112 | 104 | 39 | ||
| World of Tanks enCore (2018) | 246.4 | 75.1 | 26 | 19 | 8.9 | |
| Hitman 2 (2018) | 29.8 | 18.6 | 15.7 | 13.4 | ||
| Fallout 76 (2018) | 55.7 | 30.2 | 25.9 | 25 | ||
| Battlefield V (2018) | 68.1 | 31 | 25.7 | 19.8 | ||
| Farming Simulator 19 (2018) | 122.1 | 58.5 | 35.9 | 26.5 | ||
| Darksiders III (2018) | 124 | 51 | 43 | 29 | ||
| Just Cause 4 (2018) | 39.8 | 24.4 | 19.4 | 18.8 | ||
| Far Cry New Dawn (2019) | 26 | 22 | 20 | 19 | ||
| Metro Exodus (2019) | 29.67 | 13.93 | ||||
| Dirt Rally 2.0 (2019) | 67.9 | 37.34 | 32.48 | |||
| The Division 2 (2019) | 49 | 24 | 17 | 12 | ||
| Anno 1800 (2019) | 52.8 | 26.7 | 15.9 | |||
| Rage 2 (2019) | 22.4 | 13.1 | ||||
| Total War: Three Kingdoms (2019) | 101.4 | 31.2 | 19.1 | 13.2 | ||
| League of Legends (2019) | 110.3 | 81 | 75.5 | 75.9 | 60.9 | 40.4 |
| F1 2019 (2019) | 84 | 38.8 | 34.3 | 19 | 14.5 | 7.5 |
| Control (2019) | 49.4 | 14.4 | ||||
| Borderlands 3 (2019) | 48.9 | 47.4 | 13.9 | 10.3 | ||
| Star Wars Jedi Fallen Order (2019) | 48 | 37.7 | 33.2 | 18.6 | 18.4 | |
| Gears Tactics (2020) | 98.1 | 37.5 | 20.5 | 14.8 | 10 | |
| F1 2020 (2020) | 79.9 | 38.4 | 28.8 | 18.5 | 12.6 |
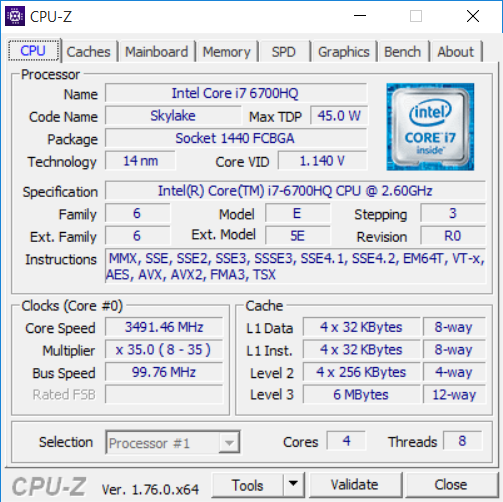
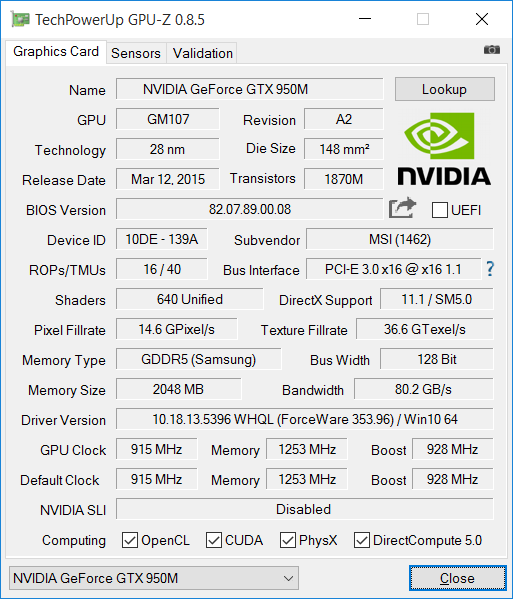
| MSI PX60 6QD GeForce GTX 950M, 6700HQ | MSI PX60 QD-034US GeForce GTX 950M, 5700HQ, HGST Travelstar 7K1000 HTS721010A9E630 | Lenovo ThinkPad T560 20FH001APB HD Graphics 520, 6600U, Samsung SSD PM871 MZ7LN256HCHP | HP ZBook 15 G3 Quadro M2000M, E3-1505M v5, Samsung SM951 MZVPV512HDGL m.2 PCI-e | Apple MacBook Pro Retina 15 inch 2015-05 Radeon R9 M370X, 4870HQ, Apple SSD SM0512G | Dell XPS 15-9550 i7 GeForce GTX 960M, 6700HQ, Samsung PM951 NVMe 512 GB | |
|---|---|---|---|---|---|---|
| Noise | -4% | 15% | 4% | 8% | 3% | |
| off /ambiente * | 30 | 30 -0% | ||||
| Idle Minimum * | 35 | 34.8 1% | 30 14% | 30 14% | 28.9 17% | 31.4 10% |
| Idle Average * | 35.2 | 37.2 -6% | 30.7 13% | 30 15% | 28.9 18% | 32.5 8% |
| Idle Maximum * | 35.2 | 37.4 -6% | 31.4 11% | 30 15% | 28.9 18% | 33.6 5% |
| Load Average * | 38.8 | 41.8 -8% | 33.8 13% | 45.3 -17% | 46 -19% | 45.2 -16% |
| Load Maximum * | 48.8 | 49.4 -1% | 38 22% | 49.7 -2% | 46 6% | 46 6% |
* ... Meglio usare valori piccoli
Rumorosità
| Idle |
| 35 / 35.2 / 35.2 dB(A) |
| Sotto carico |
| 38.8 / 48.8 dB(A) |
 | ||
30 dB silenzioso 40 dB(A) udibile 50 dB(A) rumoroso |
||
min: | ||
(±) La temperatura massima sul lato superiore è di 42.6 °C / 109 F, rispetto alla media di 34.2 °C / 94 F, che varia da 21.2 a 62.5 °C per questa classe Office.
(-) Il lato inferiore si riscalda fino ad un massimo di 60.4 °C / 141 F, rispetto alla media di 36.7 °C / 98 F
(+) In idle, la temperatura media del lato superiore è di 29.9 °C / 86 F, rispetto alla media deld ispositivo di 29.5 °C / 85 F.
(+) I poggiapolsi e il touchpad raggiungono la temperatura massima della pelle (33.4 °C / 92.1 F) e quindi non sono caldi.
(-) La temperatura media della zona del palmo della mano di dispositivi simili e'stata di 27.7 °C / 81.9 F (-5.7 °C / -10.2 F).
| Off / Standby | |
| Idle | |
| Sotto carico |
|
Leggenda:
min: Attualmente utilizziamo il Metrahit Energy, un multimetro digitale professionale per la misurazione della qualità della potenza e dell'energia monofase, per le nostre misurazioni. | |
| MSI PX60 6QD GeForce GTX 950M, 6700HQ | Lenovo ThinkPad T560 20FH001APB HD Graphics 520, 6600U, Samsung SSD PM871 MZ7LN256HCHP | HP ZBook 15 G3 Quadro M2000M, E3-1505M v5, Samsung SM951 MZVPV512HDGL m.2 PCI-e | Apple MacBook Pro Retina 15 inch 2015-05 Radeon R9 M370X, 4870HQ, Apple SSD SM0512G | Dell XPS 15-9550 i7 GeForce GTX 960M, 6700HQ, Samsung PM951 NVMe 512 GB | Dell Precision 5510 Quadro M1000M, E3-1505M v5, SK hynix SC920 512 GB | |
|---|---|---|---|---|---|---|
| Power Consumption | 53% | 19% | 25% | -9% | 8% | |
| Idle Minimum * | 15 | 3.8 75% | 5.7 62% | 6 60% | 12.5 17% | 8.6 43% |
| Idle Average * | 18.6 | 10.2 45% | 12.2 34% | 12.8 31% | 19.6 -5% | 16.2 13% |
| Idle Maximum * | 19.7 | 15.6 21% | 12.6 36% | 13.3 32% | 22.8 -16% | 16.7 15% |
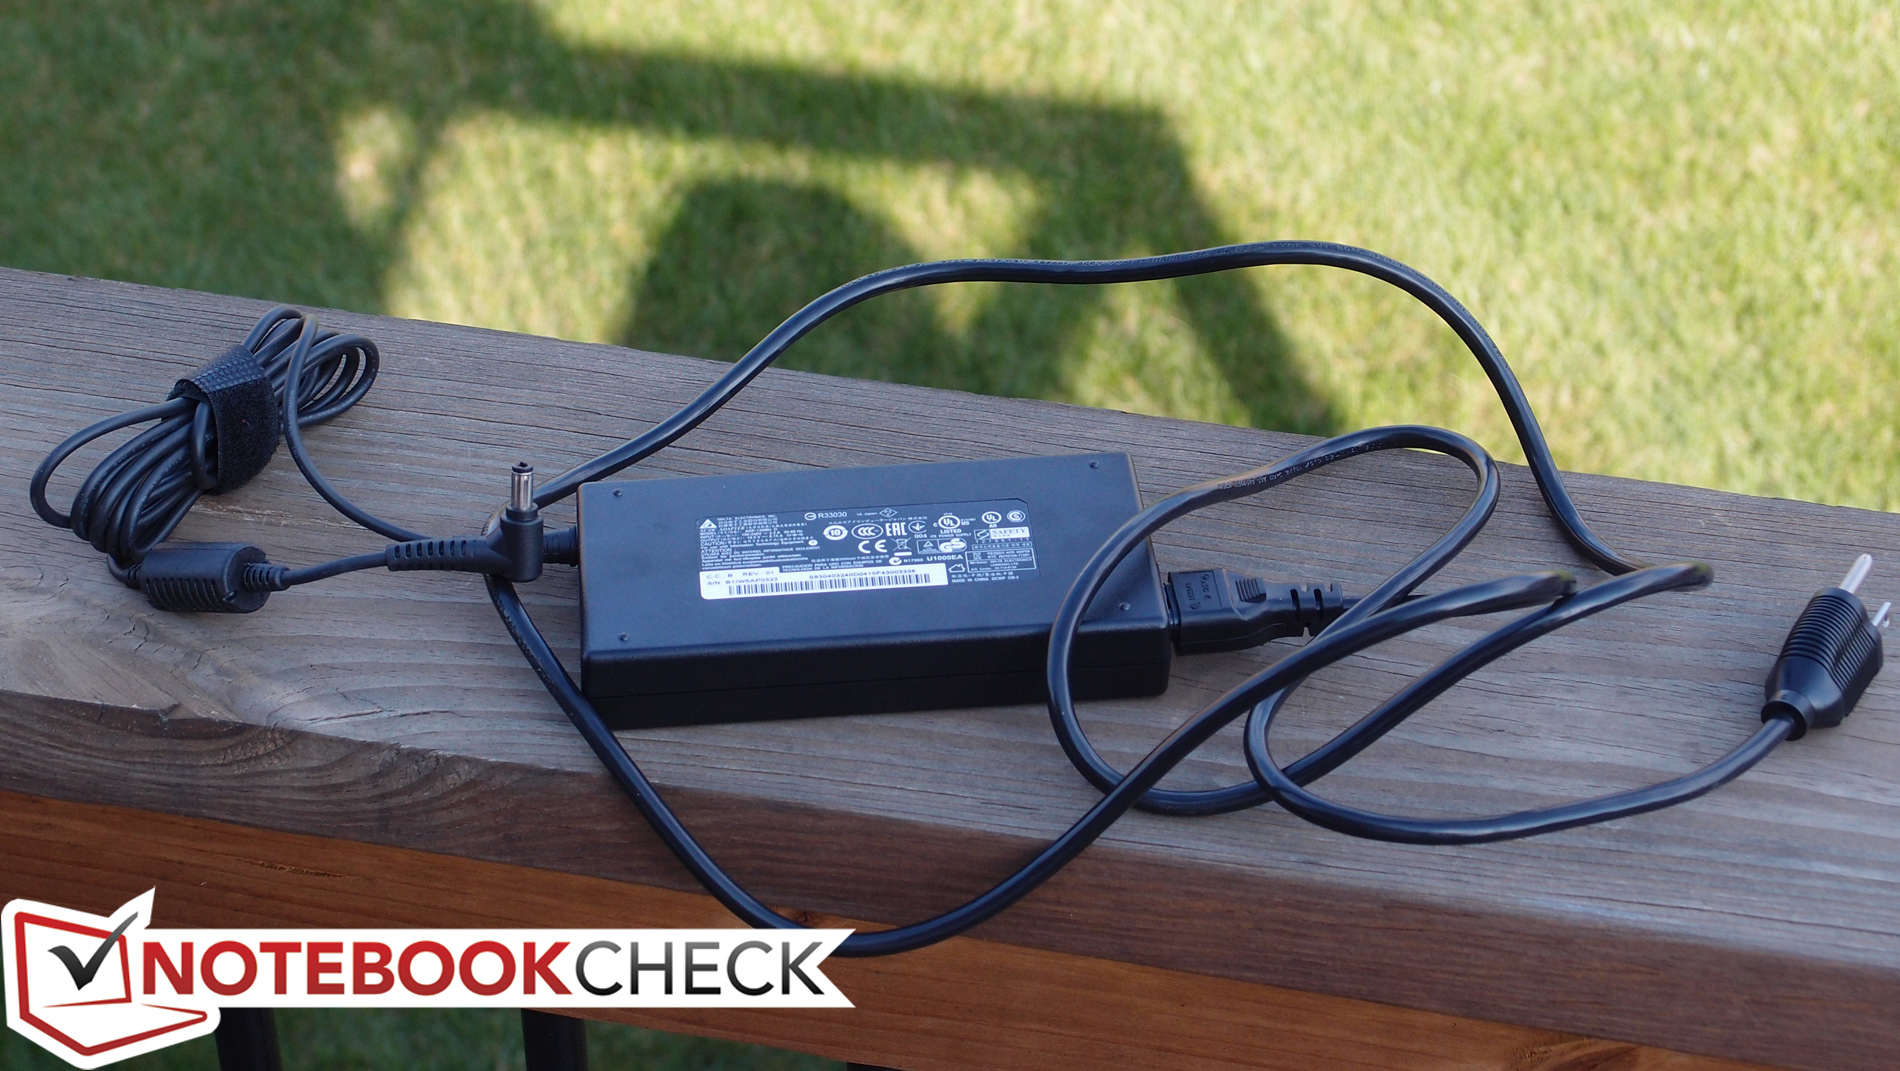
| Load Average * | 64.6 | 30.8 52% | 83.1 -29% | 82.4 -28% | 102 -58% | 82.6 -28% |
| Load Maximum * | 129 | 33.9 74% | 138.2 -7% | 91.8 29% | 107 17% | 131.8 -2% |
* ... Meglio usare valori piccoli
Pro
Contro
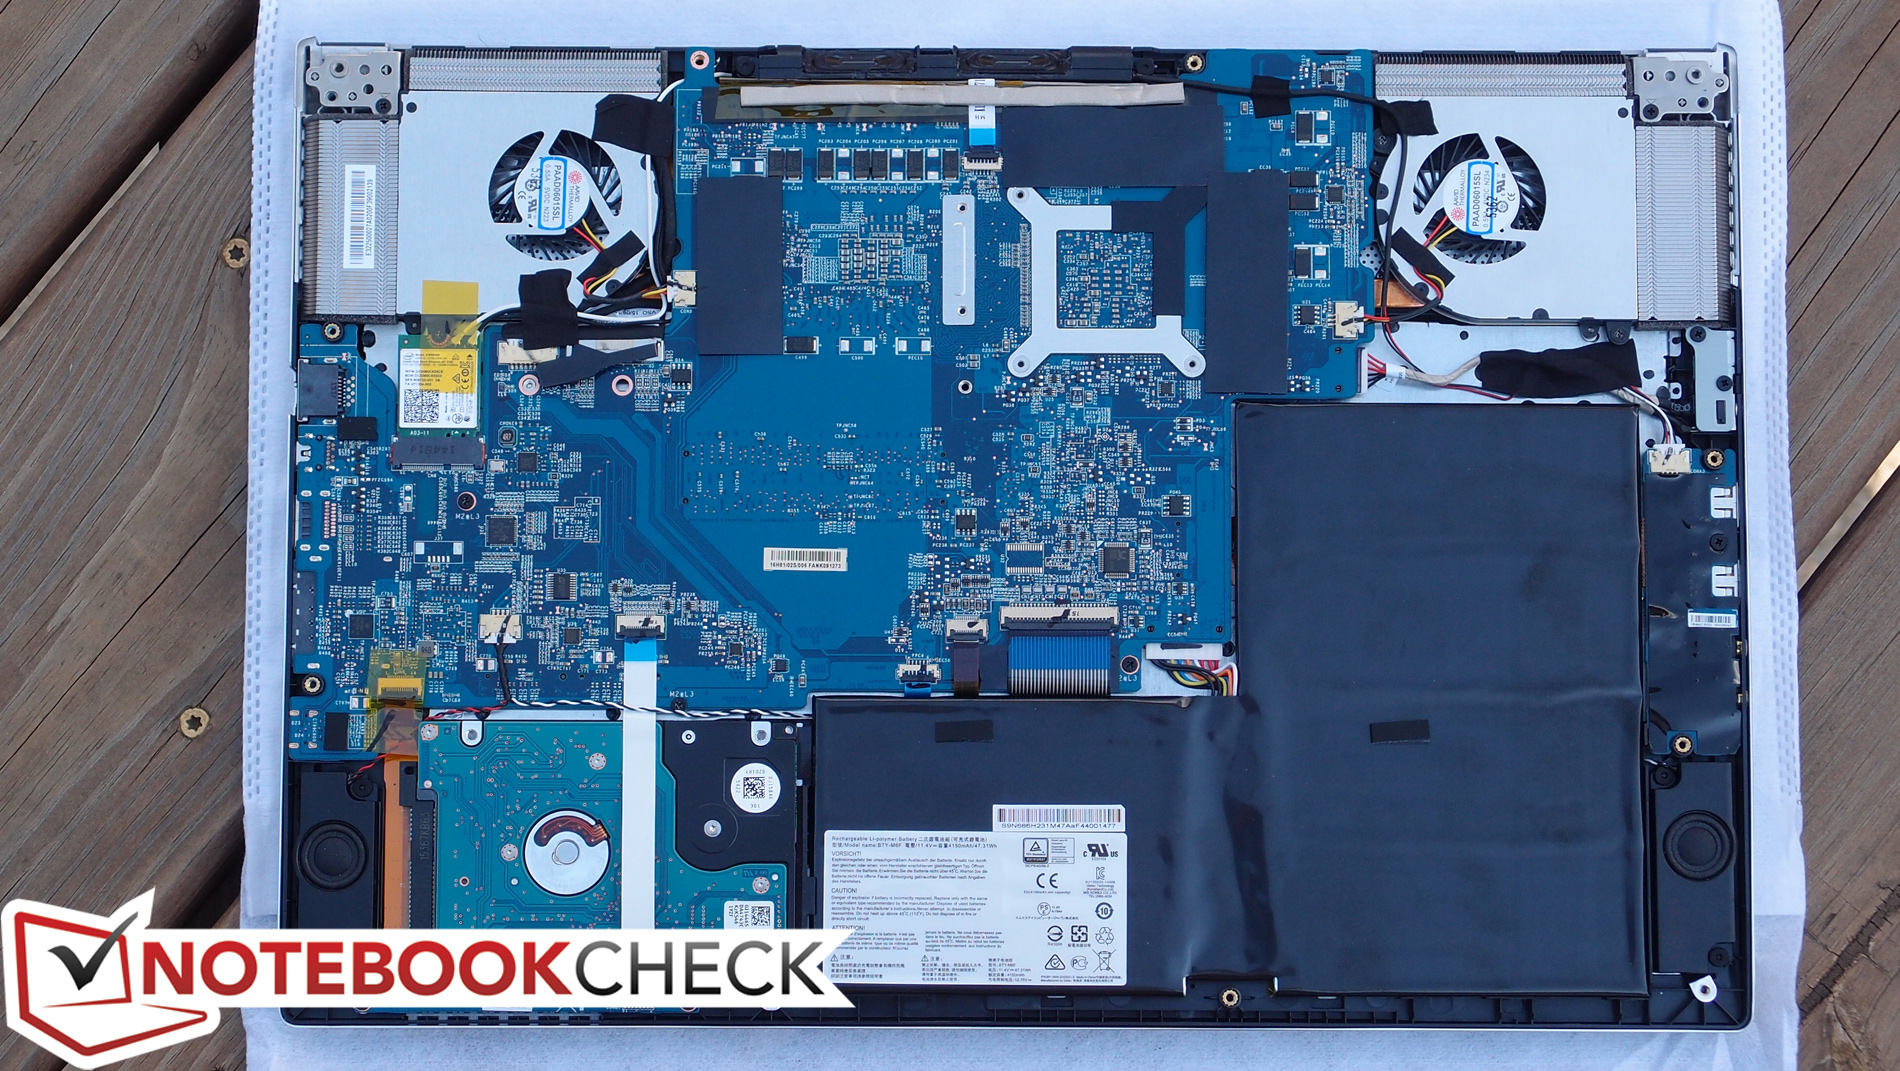
Considerando che i nostri sistemi di punteggio sono cambiati e lo scenario competitivo ha continuato ad evolversi, la nostra valutazione del PX60 è leggermente cambiato rispetto al modello Broadwell dello scorso anno. Se quella macchina fosse stata senza problemi critici allora non sarebbe stato scoraggiante; tuttavia, resta ancora molto da desiderare e lo Skylake PX60 non modifica di molto la situazione, apportando solo miglioramenti marginali in termini di architettura chipset e CPU (e quindi di autonomia).
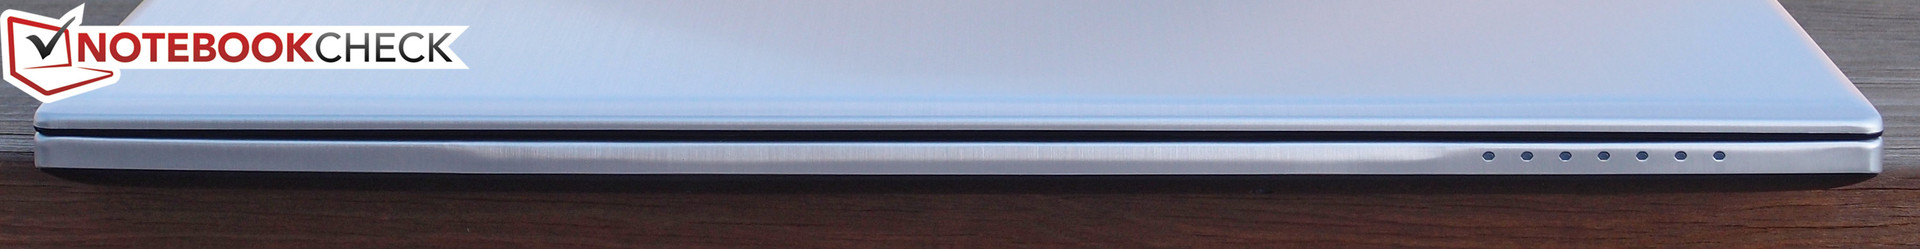
Il risultato è un altro “portatile business” che si attesta nella fascia media delle gaming machine, ad eccezione dell'aspetto in metallo argentato. E' uno sforzo minimo per rietichettare la serie GS60 Ghost al altri scopi. Il problema è il target: il mercato business è molto competitivo. Restando indietro con alcuni aspetti principali come autonomia, manutenzione e dispositivi di input, il PX60 necessita di una svolta per competere seriamente. Bisogna trasformarlo in un portatile diverso.
D'altro canto, quando lo si guarda come una variazione di un portatile gaming, ha più senso.
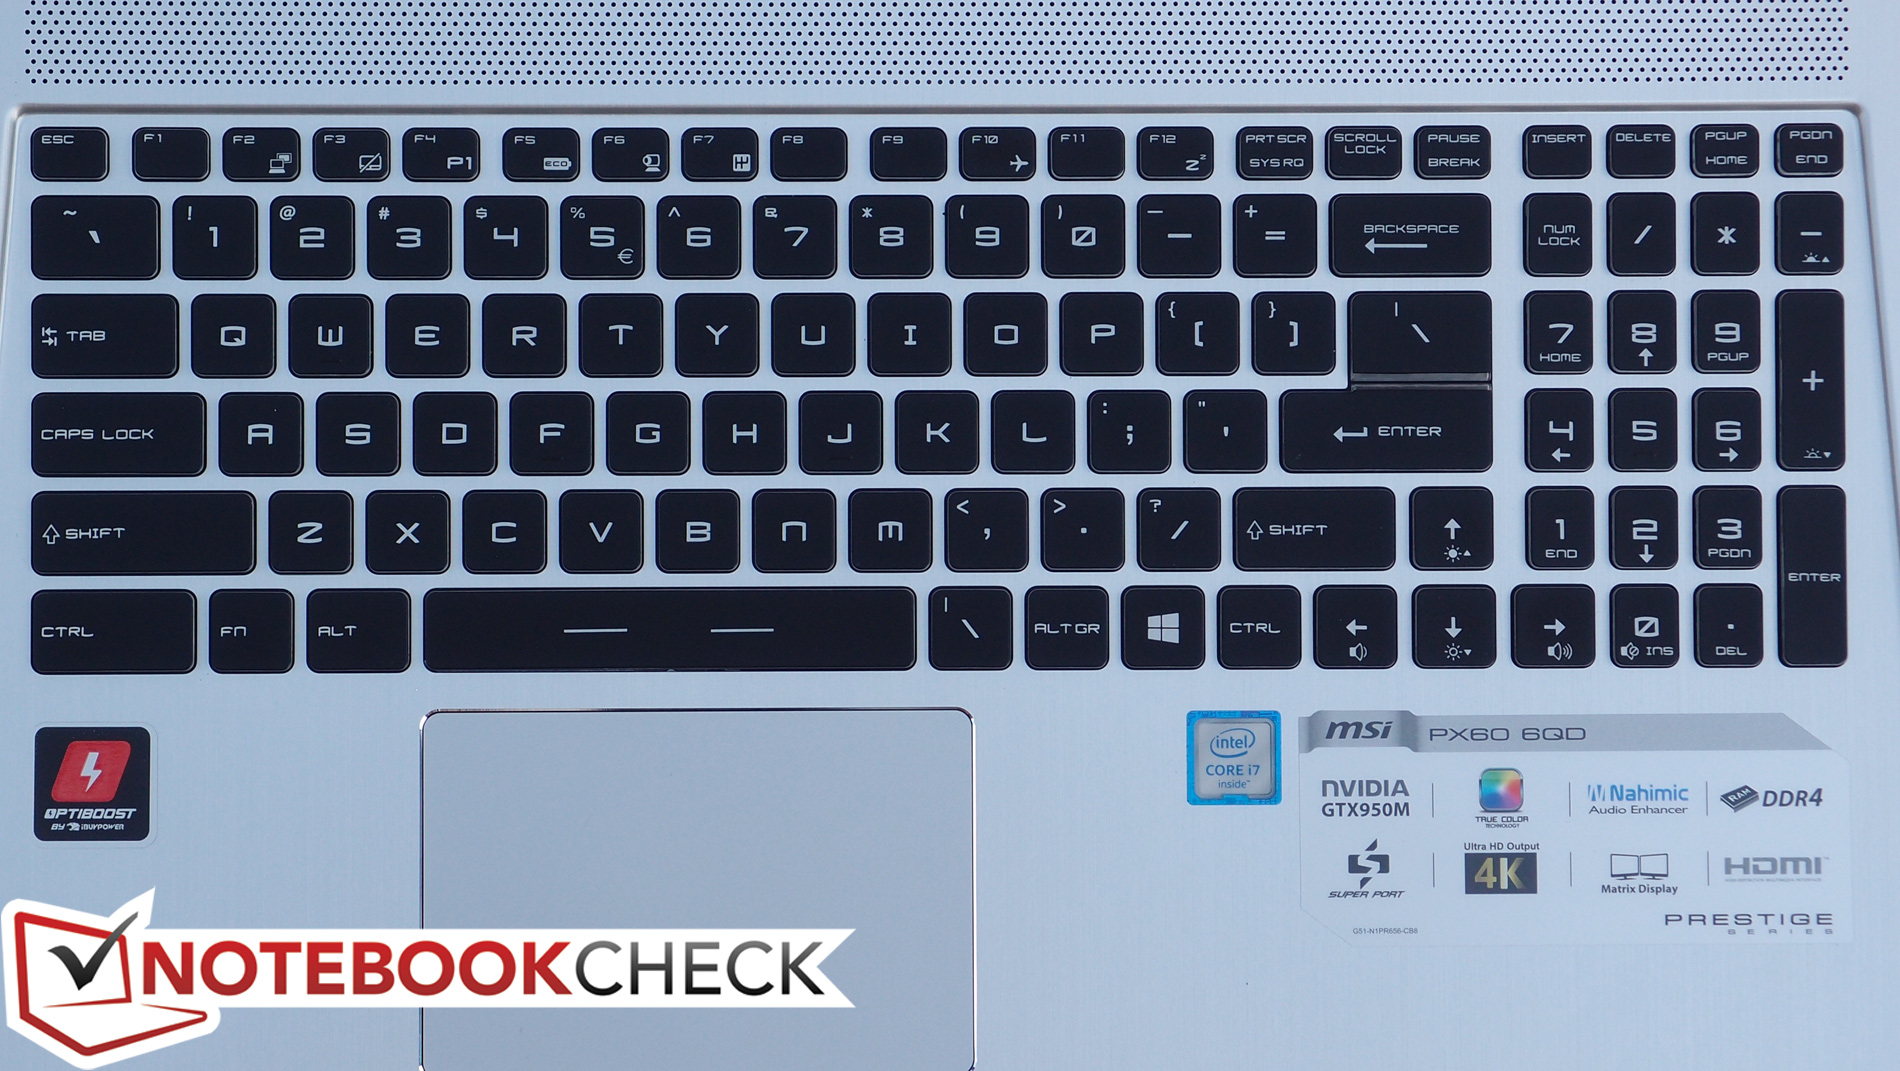
Restano molte pecche, ma se non vi aspettate un ThinkPad o un Latitude, il PX60 può essere un economico desktop replacement (portatile, sebbene con autonomia limitata) per i gamers che vogliono spendere poco. Gli utenti business, invece, hanno molte altre opzioni tra cui scegliere.
Nota: si tratta di una recensione breve, con alcune sezioni non tradotte, per la versione integrale in inglese guardate qui.
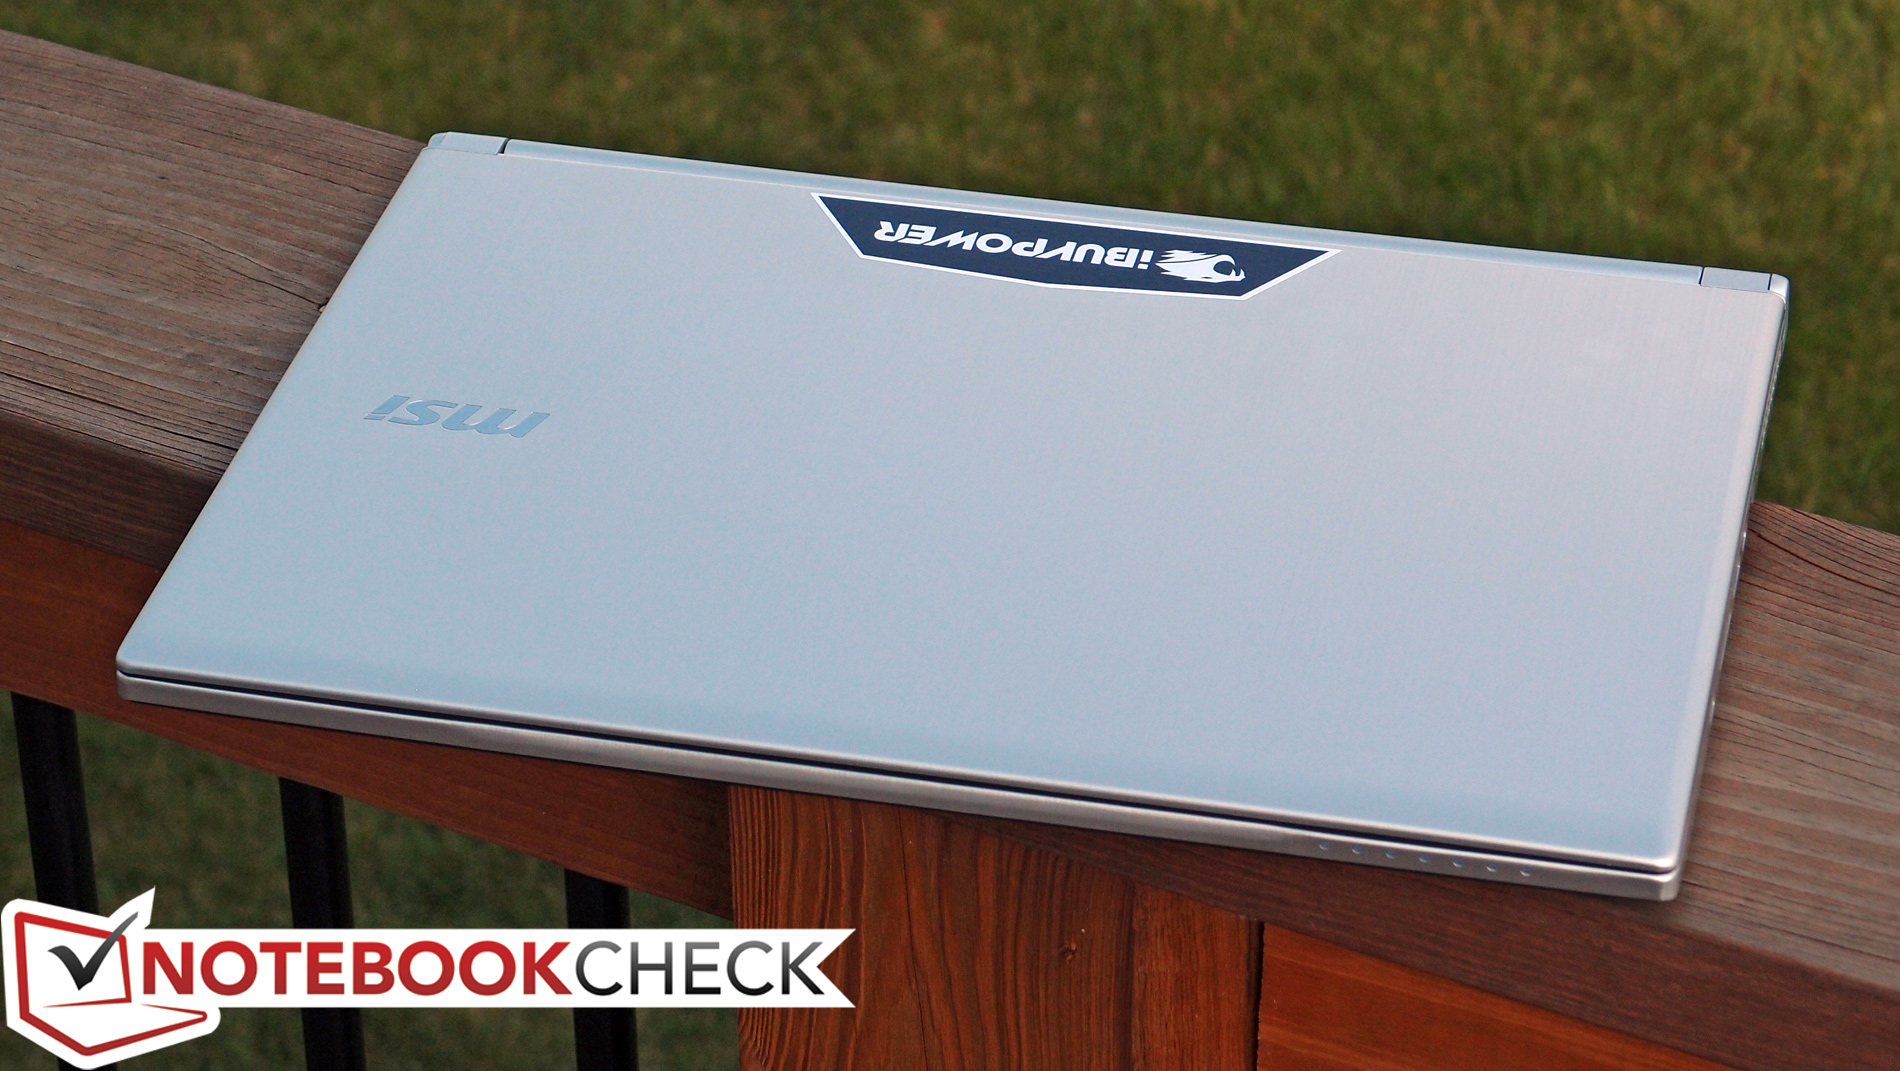
MSI PX60 6QD
-
05/03/2016 v5.1(old)
Steve Schardein
Pricecompare
