 Deutsch
 English
 Español
 Français
 Italiano
 Nederlands
 Polski
 Português
 Русский
 Türkçe
 Svenska
 Chinese
 Magyar
Recensione Breve del Portatile MSI GS60 6QE Ghost Pro


| |||||||||||||||||||||||||
Distribuzione della luminosità: 78 %
Al centro con la batteria: 212 cd/m²
Contrasto: 433:1 (Nero: 0.49 cd/m²)
ΔE Color 7.8 | 0.5-29.43 Ø5
ΔE Greyscale 5.23 | 0.57-98 Ø5.3
80% sRGB (Argyll 1.6.3 3D)
50% AdobeRGB 1998 (Argyll 1.6.3 3D)
54.8% AdobeRGB 1998 (Argyll 2.2.0 3D)
80% sRGB (Argyll 2.2.0 3D)
53.1% Display P3 (Argyll 2.2.0 3D)
Gamma: 3.05
| MSI GS60-6QE4K16H21 Samsung 156FL02-P01 (SDC424B) | MSI GS60 2QE Ghost Pro 4K (2QEUi716SR51G) Samsung SDC4852 | SCHENKER XMG P506 Samsung 156HL01-102 (SDC324C) | Acer Predator 15 G9-591-74ZV LG LP156WF6-SPP1 (LGD04D5) | |
|---|---|---|---|---|
| Display | -6% | 23% | 15% | |
| Display P3 Coverage | 53.1 | 49.93 -6% | 66.4 25% | 66 24% |
| sRGB Coverage | 80 | 75.2 -6% | 96 20% | 85.8 7% |
| AdobeRGB 1998 Coverage | 54.8 | 51.6 -6% | 68.6 25% | 62.7 14% |
| Response Times | 13% | |||
| Response Time Grey 50% / Grey 80% * | 40 ? | 31 ? 22% | ||
| Response Time Black / White * | 26 ? | 25 ? 4% | ||
| PWM Frequency | 1316 ? | |||
| Screen | 20% | 36% | 39% | |
| Brightness middle | 212 | 241 14% | 310 46% | 310 46% |
| Brightness | 197 | 228 16% | 299 52% | 287 46% |
| Brightness Distribution | 78 | 87 12% | 84 8% | 86 10% |
| Black Level * | 0.49 | 0.45 8% | 0.35 29% | 0.36 27% |
| Contrast | 433 | 536 24% | 886 105% | 861 99% |
| Colorchecker dE 2000 * | 7.8 | 3.73 52% | 4.1 47% | 3.83 51% |
| Greyscale dE 2000 * | 5.23 | 3.23 38% | 5.7 -9% | 2.53 52% |
| Gamma | 3.05 72% | 2.3 96% | 2.53 87% | 2.42 91% |
| CCT | 6693 97% | 6610 98% | 7454 87% | 6934 94% |
| Color Space (Percent of AdobeRGB 1998) | 50 | 47 -6% | 63 26% | 56 12% |
| Color Space (Percent of sRGB) | 80 | 96 20% | 86 8% | |
| Media totale (Programma / Settaggio) | 7% /
13% | 30% /
33% | 22% /
30% |
* ... Meglio usare valori piccoli
Tempi di risposta del Display
| ↔ Tempi di risposta dal Nero al Bianco | ||
|---|---|---|
| 26 ms ... aumenta ↗ e diminuisce ↘ combinato | ↗ 8 ms Incremento | 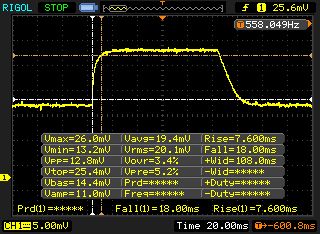 |
| ↘ 18 ms Calo | ||
| Lo schermo mostra tempi di risposta relativamente lenti nei nostri tests e potrebbe essere troppo lento per i gamers. In confronto, tutti i dispositivi di test variano da 0.1 (minimo) a 240 (massimo) ms. » 57 % di tutti i dispositivi è migliore. Questo significa che i tempi di risposta rilevati sono peggiori rispetto alla media di tutti i dispositivi testati (21.5 ms). | ||
| ↔ Tempo di risposta dal 50% Grigio all'80% Grigio | ||
| 40 ms ... aumenta ↗ e diminuisce ↘ combinato | ↗ 12 ms Incremento | 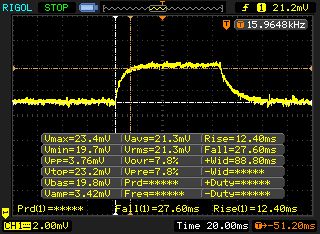 |
| ↘ 28 ms Calo | ||
| Lo schermo mostra tempi di risposta lenti nei nostri tests e sarà insoddisfacente per i gamers. In confronto, tutti i dispositivi di test variano da 0.2 (minimo) a 636 (massimo) ms. » 56 % di tutti i dispositivi è migliore. Questo significa che i tempi di risposta rilevati sono peggiori rispetto alla media di tutti i dispositivi testati (33.7 ms). | ||
Sfarfallio dello schermo / PWM (Pulse-Width Modulation)
| flickering dello schermo / PWM rilevato | 1316 Hz | ≤ 20 % settaggio luminosita' | 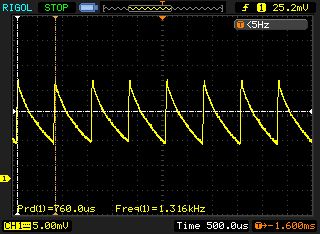 |
Il display sfarfalla a 1316 Hz (Probabilmente a causa dell'uso di PWM) Flickering rilevato ad una luminosita' di 20 % o inferiore. Non dovrebbe verificarsi flickering o PWM sopra questo valore di luminosita'. La frequenza di 1316 Hz è abbastanza alta, quindi la maggioranza degli utenti sensibili al PWM non dovrebbero notare alcun flickering. In confronto: 53 % di tutti i dispositivi testati non utilizza PWM per ridurre la luminosita' del display. Se è rilevato PWM, una media di 17900 (minimo: 5 - massimo: 3846000) Hz è stata rilevata. | |||
| PCMark 7 Score | 5941 punti | |
| PCMark 8 Home Score Accelerated v2 | 3134 punti | |
Aiuto | ||
| PCMark 7 - Score (ordina per valore) | |
| MSI GS60-6QE4K16H21 | |
| MSI GS60 2QE Ghost Pro 4K (2QEUi716SR51G) | |
| SCHENKER XMG P506 | |
| Acer Predator 15 G9-591-74ZV | |
| HP Pavilion 15-ak003ng | |
| MSI GE62-6QD16H11 | |

| 3DMark 11 Performance | 9536 punti | |
| 3DMark Ice Storm Standard Score | 75735 punti | |
| 3DMark Cloud Gate Standard Score | 13453 punti | |
| 3DMark Fire Strike Score | 5982 punti | |
Aiuto | ||
| 3DMark 11 - 1280x720 Performance (ordina per valore) | |
| MSI GS60-6QE4K16H21 | |
| MSI GS60 2QE Ghost Pro 4K (2QEUi716SR51G) | |
| Asus G752VT | |
| MSI GE72-6QF8H11 | |
| MSI GS70 6QE-036XPL | |
| SCHENKER XMG P506 | |
| 3DMark - 1920x1080 Fire Strike Score (ordina per valore) | |
| MSI GS60-6QE4K16H21 | |
| MSI GS60 2QE Ghost Pro 4K (2QEUi716SR51G) | |
| Asus G752VT | |
| MSI GE72-6QF8H11 | |
| MSI GS70 6QE-036XPL | |
| SCHENKER XMG P506 | |
| basso | medio | alto | ultra | 4K | |
| Watch Dogs (2014) | 92.6 | 81.4 | 49.4 | 34 | |
| Middle-earth: Shadow of Mordor (2014) | 157.7 | 125.4 | 69 | 52.4 | |
| Alien: Isolation (2014) | 217 | 176.2 | 111.3 | 78.1 | |
| Dragon Age: Inquisition (2014) | 148.2 | 123.1 | 55.4 | 37.2 | |
| FIFA 16 (2015) | 240.5 | 211.3 | 176.2 | ||
| Anno 2205 (2015) | 133.4 | 113.6 | 54.7 | 17 | 19.8 |
| Fallout 4 (2015) | 135.2 | 103.4 | 55.5 | 44.6 | 18.6 |
| Star Wars Battlefront (2015) | 191.8 | 141.9 | 70.1 | 60.2 | 19 |
| Rainbow Six Siege (2015) | 228.6 | 150.1 | 82.8 | 62.8 | 25.2 |
| Dragon Age: Inquisition | |
| 1920x1080 High Graphics Quality (ordina per valore) | |
| MSI GS60-6QE4K16H21 | |
| MSI GS60 2QE Ghost Pro 4K (2QEUi716SR51G) | |
| MSI GS70-2QE16SR51 | |
| 1920x1080 Ultra Graphics Quality AA:2x MS (ordina per valore) | |
| MSI GS60-6QE4K16H21 | |
| MSI GS60 2QE Ghost Pro 4K (2QEUi716SR51G) | |
| MSI GS70-2QE16SR51 | |
| Watch Dogs | |
| 1920x1080 High Overall Quality, High Textures AA:2x MS (ordina per valore) | |
| MSI GS60-6QE4K16H21 | |
| MSI GS60 2QE Ghost Pro 4K (2QEUi716SR51G) | |
| SCHENKER XMG P505 | |
| 1920x1080 Ultra Overall Quality, Ultra Textures AA:4x MS (ordina per valore) | |
| MSI GS60-6QE4K16H21 | |
| MSI GS60 2QE Ghost Pro 4K (2QEUi716SR51G) | |
| SCHENKER XMG P505 | |
| Star Wars Battlefront | |
| 1920x1080 High Preset AA:FX (ordina per valore) | |
| MSI GS60-6QE4K16H21 | |
| Schenker W504 | |
| 1920x1080 Ultra Preset AA:FX (ordina per valore) | |
| MSI GS60-6QE4K16H21 | |
| Schenker W504 | |
| Fallout 4 | |
| 1920x1080 High Preset AA:T AF:16x (ordina per valore) | |
| MSI GS60-6QE4K16H21 | |
| Schenker W504 | |
| 1920x1080 Ultra Preset AA:T AF:16x (ordina per valore) | |
| MSI GS60-6QE4K16H21 | |
| Schenker W504 | |
Rumorosità
| Idle |
| 35 / 36 / 37 dB(A) |
| Sotto carico |
| 40 / 50 dB(A) |
 | ||
30 dB silenzioso 40 dB(A) udibile 50 dB(A) rumoroso |
||
min: | ||
| MSI GS60-6QE4K16H21 GeForce GTX 970M, 6700HQ | MSI GS60 2QE Ghost Pro 4K (2QEUi716SR51G) GeForce GTX 970M, 4720HQ | SCHENKER XMG P506 GeForce GTX 970M, 6700HQ | Acer Predator 15 G9-591-74ZV GeForce GTX 980M, 6700HQ | |
|---|---|---|---|---|
| Noise | -1% | 3% | -1% | |
| Idle Minimum * | 35 | 32.6 7% | 30.8 12% | 31 11% |
| Idle Average * | 36 | 34.8 3% | 32.8 9% | 32 11% |
| Idle Maximum * | 37 | 38 -3% | 35.9 3% | 42 -14% |
| Load Average * | 40 | 43.4 -9% | 42.2 -6% | 47 -18% |
| Load Maximum * | 50 | 52 -4% | 51 -2% | 48 4% |
* ... Meglio usare valori piccoli
(-) La temperatura massima sul lato superiore è di 51.4 °C / 125 F, rispetto alla media di 40.4 °C / 105 F, che varia da 21.2 a 68.8 °C per questa classe Gaming.
(-) Il lato inferiore si riscalda fino ad un massimo di 68.9 °C / 156 F, rispetto alla media di 43.2 °C / 110 F
(+) In idle, la temperatura media del lato superiore è di 26.3 °C / 79 F, rispetto alla media deld ispositivo di 33.8 °C / 93 F.
(-) I poggiapolsi e il touchpad possono diventare molto caldi al tatto con un massimo di 41.3 °C / 106.3 F.
(-) La temperatura media della zona del palmo della mano di dispositivi simili e'stata di 28.9 °C / 84 F (-12.4 °C / -22.3 F).
| MSI GS60-6QE4K16H21 GeForce GTX 970M, 6700HQ | MSI GS60 2QE Ghost Pro 4K (2QEUi716SR51G) GeForce GTX 970M, 4720HQ | SCHENKER XMG P506 GeForce GTX 970M, 6700HQ | Acer Predator 15 G9-591-74ZV GeForce GTX 980M, 6700HQ | |
|---|---|---|---|---|
| Heat | -4% | -2% | 3% | |
| Maximum Upper Side * | 51.4 | 48 7% | 49.3 4% | 49.8 3% |
| Maximum Bottom * | 68.9 | 65.1 6% | 60.4 12% | 59.2 14% |
| Idle Upper Side * | 27.1 | 29.9 -10% | 31.4 -16% | 32.2 -19% |
| Idle Bottom * | 30.4 | 36.1 -19% | 32.3 -6% | 26.9 12% |
* ... Meglio usare valori piccoli
| Off / Standby | |
| Idle | |
| Sotto carico |
|
Leggenda:
min: Attualmente utilizziamo il Metrahit Energy, un multimetro digitale professionale per la misurazione della qualità della potenza e dell'energia monofase, per le nostre misurazioni. | |
| Battery Runtime - WiFi Websurfing (ordina per valore) | |
| MSI GS60-6QE4K16H21 | |
| MSI GS40-6QE16H11 | |
| MSI GS70-6QE16H21 | |
| MSI GE72-6QF8H11 | |
Pro
Contro
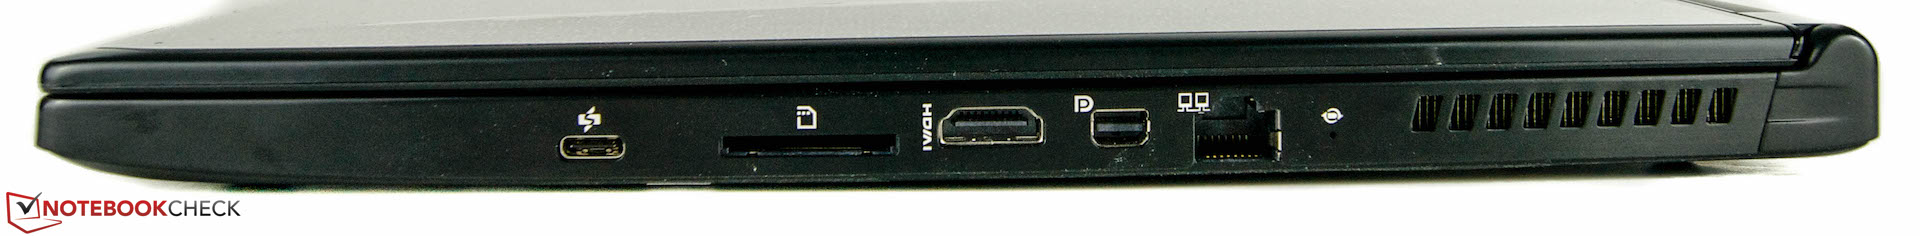
Ancora una volta, MSI offre un sottile portatile gaming ben progettato. Fortunatamente, l'attuale versione monta una porta USB 3.1. La seconda nuova feature e la DDR4-RAM. Tuttavia, l'aspetto principale è il processore Skylake, che ha ottimi risultati complessivi. Tuttavia, non ci sono veri vantaggi prestsazionali.
Sebbene il nuovo modello non monti un array RAID-0 con più SSDs, sia il nuovo processore che la DDR4-RAM consentono punteggi benchmark di sistema leggermente migliori.
Sfortunatamente, a parte queste nuove features, non vediamo alcun altro miglioramento in termini di problemi noti: il display è abbastanza scuro e il valore del nero è troppo elevato, il che significa che non potrete godervi in pieno l'elevata risoluzione 4K.
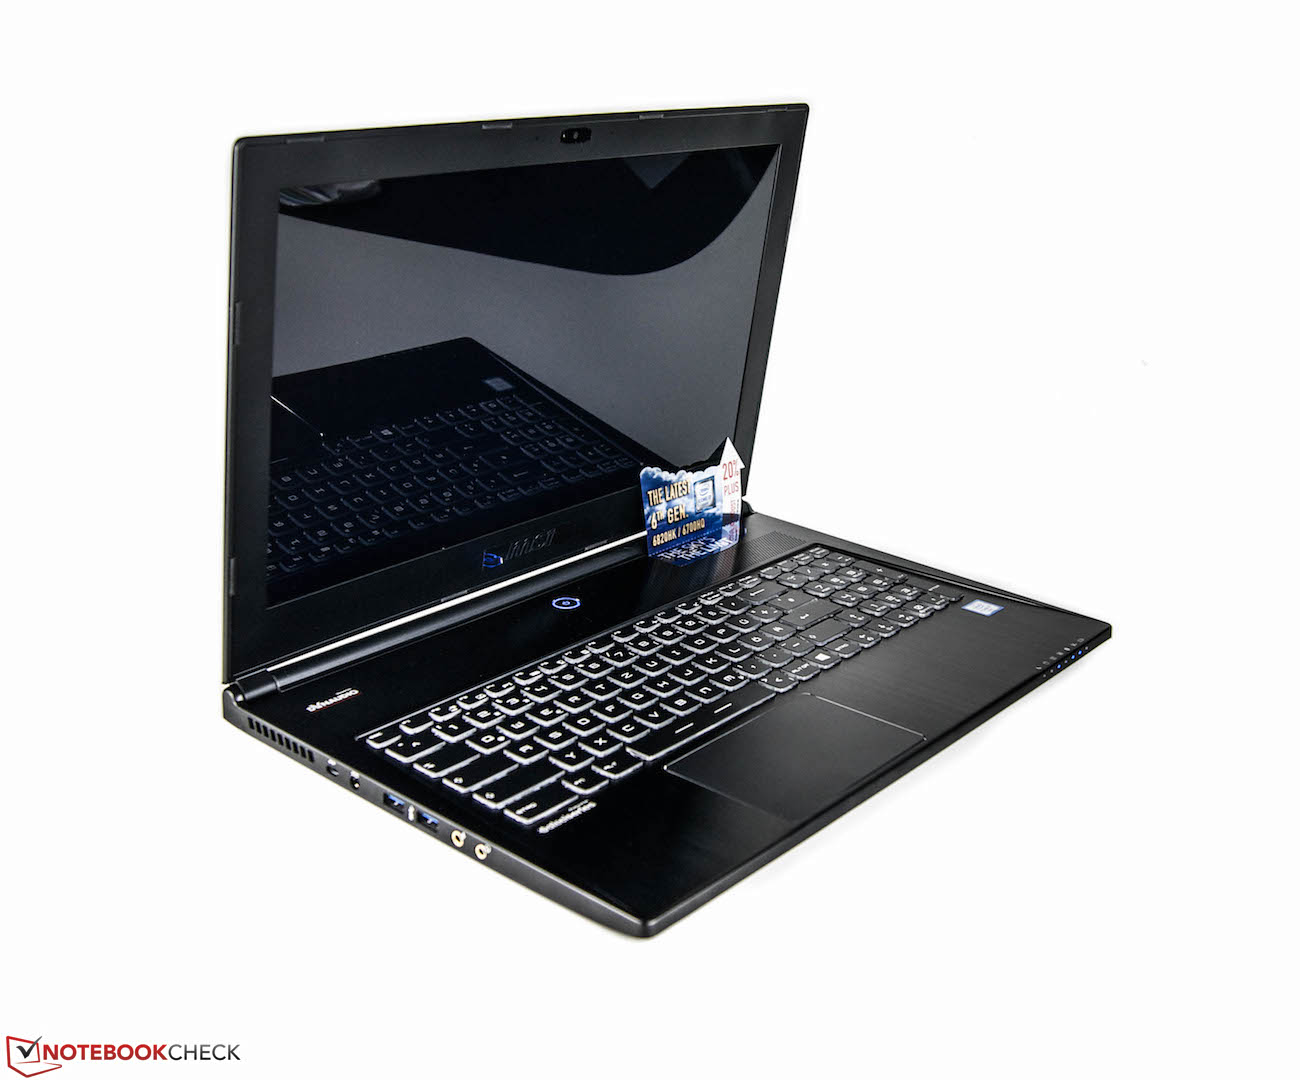
Ancora una volta, l'attuale versione dell'MSI GS60 è un compagno gaming interessante e potente. Grazie ai materiali sofisticati e al design sottile, potete sempre trasportare questo portatile high-end .
Speriamo che il produttore risolverà questi problemi in futuro. Uno sguardo ai concorrenti è comunque raccomandato. L'Acer Predator 15 per 2200 Euro (~$2445) offre una autonomia immensa ed è anche più potente. Lo Schenker XMG P506 è un degno concorrente. Avrete un buon portatile anche se cercate ancora tra i modelli economici della serie Haswell.
Nota: si tratta di una recensione breve, con alcune sezioni non tradotte, per la versione integrale in inglese guardate qui.
MSI GS60-6QE4K16H21
-
03/08/2016 v5(old)
Nino Ricchizzi
Pricecompare
