 Deutsch
 English
 Español
 Français
 Italiano
 Nederlands
 Polski
 Português
 Русский
 Türkçe
 Svenska
 Chinese
 Magyar
Recensione Breve del Portatile Dell XPS 13 9350 2016 (FHD, i7-6560U)
| SD Card Reader | |
| average JPG Copy Test (av. of 3 runs) | |
| Dell XPS 13 2016 9350 (FHD, i7-6560U) | |
| Lenovo ThinkPad Yoga 460-20EM000QGE | |
| Acer Aspire S 13 S5-371-71QZ | |
| Asus ASUSPRO Advanced B8430UA-FA0084E | |
| Lenovo IdeaPad 710S-13ISK | |
| Lenovo ThinkPad X260-20F6007RGE | |
| Tuxedo InfinityBook 13 v2 | |
| Lenovo ThinkPad 13-20GKS01100 | |
| Acer Aspire V3-372-57CW | |
| maximum AS SSD Seq Read Test (1GB) | |
| Dell XPS 13 2016 9350 (FHD, i7-6560U) | |
| Lenovo ThinkPad Yoga 460-20EM000QGE | |
| Acer Aspire S 13 S5-371-71QZ | |
| Lenovo ThinkPad X260-20F6007RGE | |
| Lenovo IdeaPad 710S-13ISK | |
| Tuxedo InfinityBook 13 v2 | |
| Lenovo ThinkPad 13-20GKS01100 | |
| Acer Aspire V3-372-57CW | |
| Networking | |
| iperf Server (receive) TCP 1 m | |
| Dell XPS 13 2016 9350 (FHD, i7-6560U) | |
| Acer Aspire S 13 S5-371-71QZ | |
| iperf Client (transmit) TCP 1 m | |
| Dell XPS 13 2016 9350 (FHD, i7-6560U) | |
| Acer Aspire S 13 S5-371-71QZ | |
| |||||||||||||||||||||||||
Distribuzione della luminosità: 86 %
Al centro con la batteria: 385 cd/m²
Contrasto: 2265:1 (Nero: 0.17 cd/m²)
ΔE Color 4.17 | 0.5-29.43 Ø5
ΔE Greyscale 5.39 | 0.57-98 Ø5.3
99.8% sRGB (Argyll 1.6.3 3D)
62.7% AdobeRGB 1998 (Argyll 1.6.3 3D)
56.6% AdobeRGB 1998 (Argyll 2.2.0 3D)
82.3% sRGB (Argyll 2.2.0 3D)
54.8% Display P3 (Argyll 2.2.0 3D)
Gamma: 2.12
| Dell XPS 13 2016 9350 (FHD, i7-6560U) Iris Graphics 540, 6560U, Samsung PM951 NVMe MZ-VLV256D | Dell XPS 13 2016 i7 256GB QHD HD Graphics 520, 6500U, Samsung PM951 NVMe MZ-VLV256D | Asus Zenbook UX303UA-R4051T HD Graphics 520, 6500U, SK hynix SSD Canvas SC300 HFS256G32MND | Asus Zenbook UX303UB-DH74T GeForce 940M, 6500U, CUK Cyclone SSD 1TB | HP Spectre 13 HD Graphics 520, 6500U, Samsung PM951 NVMe MZVLV256 | Acer Aspire S 13 S5-371-71QZ HD Graphics 520, 6500U, LiteOn CV1-8B512 | Toshiba Portege Z30-C-138 HD Graphics 520, 6500U, Toshiba HG6 THNSNJ512G8NY | |
|---|---|---|---|---|---|---|---|
| Display | 15% | 18% | 8% | 18% | 22% | ||
| Display P3 Coverage | 54.8 | 63.6 16% | 67.5 23% | 60.9 11% | 65.6 20% | 67.9 24% | |
| sRGB Coverage | 82.3 | 93.6 14% | 92.5 12% | 85.4 4% | 94.7 15% | 98 19% | |
| AdobeRGB 1998 Coverage | 56.6 | 65.5 16% | 67.7 20% | 62.5 10% | 67.5 19% | 69.8 23% | |
| Response Times | -7% | 20% | -25% | -27% | -18% | -6% | |
| Response Time Grey 50% / Grey 80% * | 42.8 ? | 40 ? 7% | 31 ? 28% | 44.4 ? -4% | 50.8 ? -19% | 50 ? -17% | 42 ? 2% |
| Response Time Black / White * | 24.8 ? | 30 ? -21% | 22 ? 11% | 36 ? -45% | 33.2 ? -34% | 29.6 ? -19% | 28 ? -13% |
| PWM Frequency | 4900 ? | 198 ? | 1389 | 217 ? | |||
| Screen | -11% | -24% | -71% | 3% | -21% | -24% | |
| Brightness middle | 385 | 285 -26% | 357 -7% | 291.4 -24% | 300.5 -22% | 375 -3% | 300 -22% |
| Brightness | 350 | 281 -20% | 351 0% | 270 -23% | 305 -13% | 358 2% | 280 -20% |
| Brightness Distribution | 86 | 90 5% | 90 5% | 84 -2% | 76 -12% | 87 1% | 87 1% |
| Black Level * | 0.17 | 0.18 -6% | 0.58 -241% | 0.954 -461% | 0.184 -8% | 0.39 -129% | 0.31 -82% |
| Contrast | 2265 | 1583 -30% | 616 -73% | 305 -87% | 1633 -28% | 962 -58% | 968 -57% |
| Colorchecker dE 2000 * | 4.17 | 4.89 -17% | 3.39 19% | 4.63 -11% | 2.64 37% | 4.6 -10% | 4.9 -18% |
| Colorchecker dE 2000 max. * | 7.61 | 6.76 11% | 5.06 34% | 8.8 -16% | 8.91 -17% | ||
| Greyscale dE 2000 * | 5.39 | 5.16 4% | 2.36 56% | 5.65 -5% | 2.8 48% | 4 26% | 6.69 -24% |
| Gamma | 2.12 104% | 2.15 102% | 2.2 100% | 2.16 102% | 2.16 102% | 2.34 94% | 2.33 94% |
| CCT | 7404 88% | 7106 91% | 6653 98% | 6320 103% | 6999 93% | 7304 89% | 6487 100% |
| Color Space (Percent of AdobeRGB 1998) | 62.7 | 59 -6% | 60 -4% | 55.2 -12% | 60.9 -3% | 57.9 -8% | 63 0% |
| Color Space (Percent of sRGB) | 99.8 | 93 -7% | 93 -7% | 85.2 -15% | 94.3 -6% | 88.7 -11% | 98 -2% |
| Media totale (Programma / Settaggio) | -1% /
-5% | 5% /
-10% | -29% /
-47% | -2% /
2% | -20% /
-20% | -3% /
-12% |
* ... Meglio usare valori piccoli
Tempi di risposta del Display
| ↔ Tempi di risposta dal Nero al Bianco | ||
|---|---|---|
| 24.8 ms ... aumenta ↗ e diminuisce ↘ combinato | ↗ 5.2 ms Incremento | 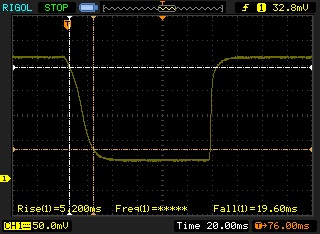 |
| ↘ 19.6 ms Calo | ||
| Lo schermo mostra buoni tempi di risposta durante i nostri tests, ma potrebbe essere troppo lento per i gamers competitivi. In confronto, tutti i dispositivi di test variano da 0.1 (minimo) a 240 (massimo) ms. » 52 % di tutti i dispositivi è migliore. Questo significa che i tempi di risposta rilevati sono peggiori rispetto alla media di tutti i dispositivi testati (21.5 ms). | ||
| ↔ Tempo di risposta dal 50% Grigio all'80% Grigio | ||
| 42.8 ms ... aumenta ↗ e diminuisce ↘ combinato | ↗ 16 ms Incremento | 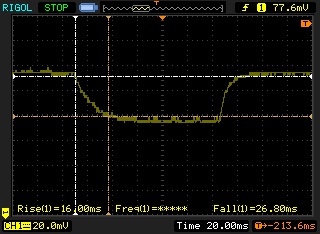 |
| ↘ 26.8 ms Calo | ||
| Lo schermo mostra tempi di risposta lenti nei nostri tests e sarà insoddisfacente per i gamers. In confronto, tutti i dispositivi di test variano da 0.2 (minimo) a 636 (massimo) ms. » 66 % di tutti i dispositivi è migliore. Questo significa che i tempi di risposta rilevati sono peggiori rispetto alla media di tutti i dispositivi testati (33.7 ms). | ||
Sfarfallio dello schermo / PWM (Pulse-Width Modulation)
| flickering dello schermo / PWM non rilevato | 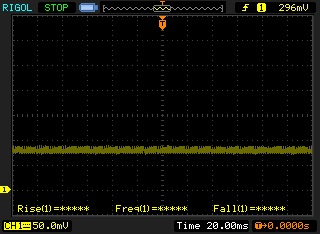 | ||
In confronto: 53 % di tutti i dispositivi testati non utilizza PWM per ridurre la luminosita' del display. Se è rilevato PWM, una media di 17924 (minimo: 5 - massimo: 3846000) Hz è stata rilevata. | |||
| PCMark 8 Home Score Accelerated v2 | 3479 punti | |
| PCMark 8 Work Score Accelerated v2 | 4213 punti | |
Aiuto | ||
| Dell XPS 13 2016 9350 (FHD, i7-6560U) Samsung PM951 NVMe MZ-VLV256D | Dell XPS 13 9350 WQXGA Samsung PM951 NVMe 512 GB | Acer Aspire S 13 S5-371-71QZ LiteOn CV1-8B512 | Asus Zenbook UX305UA-FC040T SK Hynix Canvas SC300 512GB M.2 (HFS512G39MND) | Asus Zenbook UX303UB-R4100T Micron M600 MTFDDAK512MBF | Apple MacBook 12 (Early 2016) 1.1 GHz Apple SSD AP0256 | Gigabyte P34W v5 Samsung SSD 950 Pro 512GB m.2 NVMe | |
|---|---|---|---|---|---|---|---|
| CrystalDiskMark 3.0 | 44% | -16% | -20% | -13% | 13% | 144% | |
| Read Seq | 1131 | 1236 9% | 502 -56% | 469.1 -59% | 484.2 -57% | 754 -33% | 2269 101% |
| Write Seq | 311.4 | 590 89% | 418.9 35% | 412.1 32% | 444.9 43% | 638 105% | 1524 389% |
| Read 512 | 685 | 615 -10% | 341.3 -50% | 301.6 -56% | 387.8 -43% | 616 -10% | 937 37% |
| Write 512 | 276.3 | 592 114% | 389.7 41% | 327.1 18% | 386.3 40% | 678 145% | 1483 437% |
| Read 4k | 39.63 | 42.36 7% | 29.69 -25% | 28.08 -29% | 28.74 -27% | 14.6 -63% | 53.8 36% |
| Write 4k | 133.9 | 142.2 6% | 86.8 -35% | 71.9 -46% | 90.5 -32% | 20.5 -85% | 167.3 25% |
| Read 4k QD32 | 399.7 | 572 43% | 301.3 -25% | 262 -34% | 300.5 -25% | 464 16% | 622 56% |
| Write 4k QD32 | 245.6 | 482.4 96% | 211.2 -14% | 274.7 12% | 243.3 -1% | 315 28% | 418.9 71% |

| 3DMark | |
| 1280x720 Cloud Gate Standard Score | |
| Alienware 13 (GTX 960M) | |
| Dell XPS 13 2016 9350 (FHD, i7-6560U) | |
| Dell XPS 13 9350 WQXGA | |
| Asus Zenbook UX303UB-R4100T | |
| Asus Zenbook UX305UA-FC040T | |
| Apple MacBook 12 (Early 2016) 1.1 GHz | |
| 1920x1080 Fire Strike Score | |
| Alienware 13 (GTX 960M) | |
| Asus Zenbook UX303UB-R4100T | |
| Dell XPS 13 9350 WQXGA | |
| Dell XPS 13 2016 9350 (FHD, i7-6560U) | |
| Acer Aspire S 13 S5-371-71QZ | |
| Asus Zenbook UX305UA-FC040T | |
| Apple MacBook 12 (Early 2016) 1.1 GHz | |
| 3DMark 11 - 1280x720 Performance | |
| Alienware 13 (GTX 960M) | |
| Asus Zenbook UX303UB-R4100T | |
| Dell XPS 13 2016 9350 (FHD, i7-6560U) | |
| Dell XPS 13 9350 WQXGA | |
| Acer Aspire S 13 S5-371-71QZ | |
| Asus Zenbook UX305UA-FC040T | |
| Apple MacBook 12 (Early 2016) 1.1 GHz | |
| 3DMark 11 Performance | 2087 punti | |
| 3DMark Ice Storm Standard Score | 72283 punti | |
| 3DMark Cloud Gate Standard Score | 6859 punti | |
| 3DMark Fire Strike Score | 1106 punti | |
Aiuto | ||
| World of Warships | |
| 1366x768 Low Preset AF:Trilinear | |
| Lenovo ThinkPad T560-20FH002RGE | |
| MSI CX61 2QC 2970M MS-16GD | |
| Dell XPS 13 2016 9350 (FHD, i7-6560U) | |
| Acer Aspire S 13 S5-371-71QZ | |
| Apple MacBook 12 (Early 2016) 1.1 GHz | |
| 1366x768 Medium Preset AF:Trilinear | |
| Lenovo ThinkPad T560-20FH002RGE | |
| MSI CX61 2QC 2970M MS-16GD | |
| Dell XPS 13 2016 9350 (FHD, i7-6560U) | |
| Acer Aspire S 13 S5-371-71QZ | |
| Apple MacBook 12 (Early 2016) 1.1 GHz | |
| 1920x1080 High Preset AF:8x | |
| MSI CX61 2QC 2970M MS-16GD | |
| Lenovo ThinkPad T560-20FH002RGE | |
| Dell XPS 13 2016 9350 (FHD, i7-6560U) | |
| Acer Aspire S 13 S5-371-71QZ | |
| Apple MacBook 12 (Early 2016) 1.1 GHz | |
| Overwatch | |
| 1280x720 Low (Render Scale 100 %) AA:FX AF:1x | |
| Dell XPS 13 2016 9350 (FHD, i7-6560U) | |
| MSI CX61 2QC 2970M MS-16GD | |
| 1366x768 Medium (Render Scale 100 %) AA:FX AF:2x | |
| Dell XPS 13 2016 9350 (FHD, i7-6560U) | |
| MSI CX61 2QC 2970M MS-16GD | |
| 1920x1080 High (Render Scale 100 %) AA:SM AF:4x | |
| Dell XPS 13 2016 9350 (FHD, i7-6560U) | |
| MSI CX61 2QC 2970M MS-16GD | |
| The Witcher 3 | |
| 1024x768 Low Graphics & Postprocessing | |
| Lenovo ThinkPad T560-20FH002RGE | |
| MSI CX61 2QC 2970M MS-16GD | |
| Dell XPS 13 2016 9350 (FHD, i7-6560U) | |
| Acer Aspire S 13 S5-371-71QZ | |
| Apple MacBook 12 (Early 2016) 1.1 GHz | |
| 1366x768 Medium Graphics & Postprocessing | |
| Lenovo ThinkPad T560-20FH002RGE | |
| MSI CX61 2QC 2970M MS-16GD | |
| Dell XPS 13 2016 9350 (FHD, i7-6560U) | |
| basso | medio | alto | ultra | |
| The Witcher 3 (2015) | 16.5 | 11.5 | ||
| Dota 2 Reborn (2015) | 65.2 | 40 | 21.5 | 19.1 |
| World of Warships (2015) | 78.7 | 53.5 | 25.6 | 18.7 |
| Need for Speed 2016 (2016) | 17.3 | |||
| Overwatch (2016) | 58.2 | 40 | 18.9 | |
| X-Plane 11.11 (2018) | 23.6 | 16.9 | 13.6 | |
| World of Tanks enCore (2018) | 174 | 24.4 | 9.5 | |
| League of Legends (2019) | 114 | 94 | 74 | 71 |
Rumorosità
| Idle |
| 30 / 30 / 30 dB(A) |
| Sotto carico |
| 36.5 / 38.3 dB(A) |
 | ||
30 dB silenzioso 40 dB(A) udibile 50 dB(A) rumoroso |
||
min: | ||
(±) La temperatura massima sul lato superiore è di 45 °C / 113 F, rispetto alla media di 35.9 °C / 97 F, che varia da 21.4 a 59 °C per questa classe Subnotebook.
(-) Il lato inferiore si riscalda fino ad un massimo di 50 °C / 122 F, rispetto alla media di 39.4 °C / 103 F
(+) I poggiapolsi e il touchpad raggiungono la temperatura massima della pelle (32 °C / 89.6 F) e quindi non sono caldi.
(-) La temperatura media della zona del palmo della mano di dispositivi simili e'stata di 28.3 °C / 82.9 F (-3.7 °C / -6.7 F).
| Dell XPS 13 2016 9350 (FHD, i7-6560U) 6560U, Iris Graphics 540, 56 Wh | Dell XPS 13 9350 WQXGA 6560U, Iris Graphics 540, 56 Wh | Dell XPS 13 2016 i7 256GB QHD 6500U, HD Graphics 520, 56 Wh | Acer Aspire S 13 S5-371-71QZ 6500U, HD Graphics 520, 45 Wh | Asus Zenbook UX360CA-FC060T 6Y30, HD Graphics 515, 54 Wh | Asus Zenbook UX305UA-FC040T 6500U, HD Graphics 520, 56 Wh | |
|---|---|---|---|---|---|---|
| Power Consumption | -17% | -16% | 9% | 26% | 16% | |
| Idle Minimum * | 5.8 | 7.2 -24% | 6.8 -17% | 4.1 29% | 3.4 41% | 3.2 45% |
| Idle Average * | 7.3 | 9.3 -27% | 10 -37% | 6.7 8% | 7 4% | 6.5 11% |
| Idle Maximum * | 8.5 | 11.6 -36% | 10.5 -24% | 7.4 13% | 7.6 11% | 6.7 21% |
| Load Average * | 30.6 | 31.9 -4% | 30.2 1% | 32.4 -6% | 19 38% | 30.6 -0% |
| Load Maximum * | 32.5 | 29.9 8% | 33.6 -3% | 32.4 -0% | 20.1 38% | 31 5% |
* ... Meglio usare valori piccoli
| Off / Standby | |
| Idle | |
| Sotto carico |
|
Leggenda:
min: Attualmente utilizziamo il Metrahit Energy, un multimetro digitale professionale per la misurazione della qualità della potenza e dell'energia monofase, per le nostre misurazioni. | |
| Dell XPS 13 2016 9350 (FHD, i7-6560U) 6560U, Iris Graphics 540, 56 Wh | Dell XPS 13 9350 WQXGA 6560U, Iris Graphics 540, 56 Wh | Dell XPS 13 2016 i7 256GB QHD 6500U, HD Graphics 520, 56 Wh | Dell XPS 13-9350 6200U, HD Graphics 520, 56 Wh | Acer Aspire S 13 S5-371-71QZ 6500U, HD Graphics 520, 45 Wh | Asus Zenbook UX360CA-FC060T 6Y30, HD Graphics 515, 54 Wh | Asus Zenbook UX305UA-FC040T 6500U, HD Graphics 520, 56 Wh | Asus Zenbook UX303UB-DH74T 6500U, GeForce 940M, 50 Wh | |
|---|---|---|---|---|---|---|---|---|
| Autonomia della batteria | -25% | -15% | -3% | -4% | 23% | 21% | -28% | |
| Reader / Idle | 944 | 604 -36% | 784 -17% | 782 -17% | 1028 9% | 1027 9% | 1427 51% | 617 -35% |
| WiFi v1.3 | 436 | 311 -29% | 432 -1% | 451 3% | 472 8% | 386 -11% | 561 29% | 341 -22% |
| Load | 141 | 128 -9% | 103 -27% | 150 6% | 99 -30% | 239 70% | 118 -16% | 103 -27% |
| H.264 | 545 |
Pro
Contro
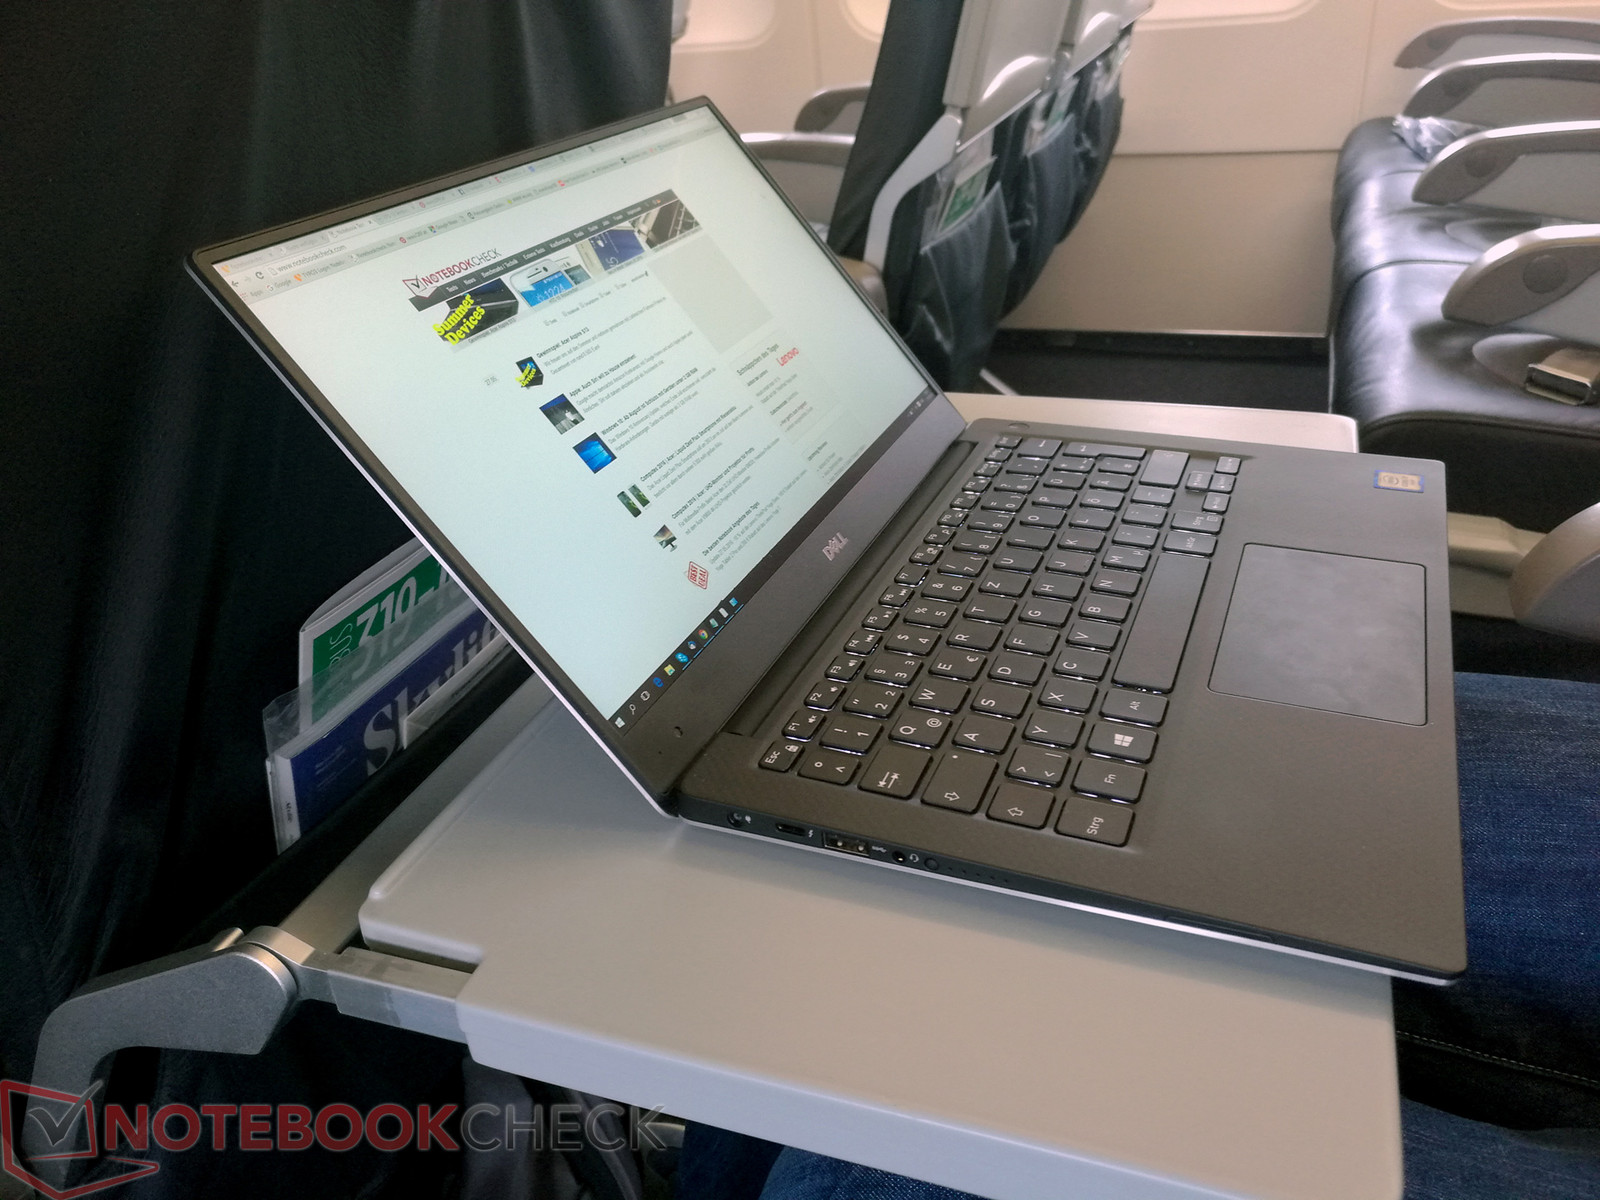
Siccome abbiamo già fatto quattro recensioni del Dell XPS 13 9350 con varie configurazioni, non è facile aggiungere nuove scoperte al giudizio. Il nostro modello di testi con i7-6560U (Intel Iris Graphics) e display matto FHD dal negozio Dell business conferma innanzitutto i vantaggi e gli svantaggi che conosciamo della serie XPS 13.
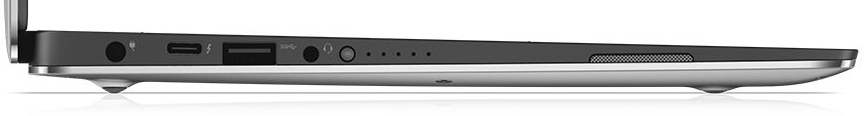
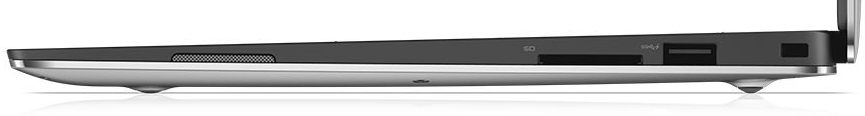
Ancora una breve sintesi: high-end, case stabile con aspetto discreto, buona connettività con veloce SD-card reader, veloce modulo Wi-Fi e Thunderbolt 3 come highlight, buoni dispositivi di input, ottime prestazioni di sistema grazie alla veloce CPU, GPU ed SSD PCIe; anche se ci sono attualmente SSds molto più veloci sul mercato. Positivo per i clienti che cercano potenza: il Dell XPS 13 fornisce massime prestazioni anche con la batteria, tuttavia, per solo due ore. Durante l'utilizzo da ufficio, potete attendervi una autonomia tra 7 ed 8 ore in base allo scenario.
Il Dell XPS 13 è il migliore portatile business?
L'XPS è un'interessante alternativa ai classici subnotebooks come il ThinkPad X260, l'EliteBook 820 G3, e sicuramente il Latitude E7270 per utenti business. L'XPS è più piccolo ed in parte più leggero, mentre ha un display più grande e prestazioni identiche se non superiori (GPU) rispetto agli altri. Con Windows 10 Pro, molte opzioni BIOS ed un Dell ProSupport (primo giorno lavorativo) incluso, l'XPS 13, che ha avuto successo nel mercato consumer, è stato migliorato con indispensabili features professionali.
Quali sono gli svantaggi dell'XPS 13? Forse il principale è il fatto che il touchpad accumula molte ditate. Il CABC (Content Adaptive Brightness Control), che regola automaticamente la luminosità del display in base ai contenuti del display senza controllo da parte dell'utente, è un fattore critico. Sebbene difficilmente ci sia impatto su colori e scala dei grigi, causa un ampia variazione del contrasto (636:1 - 2265:1). I vantaggi sono il risparmio energetico importante per gli utenti da ufficio, tuttavia chi lavora con le immagini deve necessariamente scegliere un display QHD+, che consente di disabilitare la funzione CABC.
Il prezzo epr le prestazioni elevate è che l'XPS si scalda molto sotto carico. In aggiunta, dovete accettare che la ventola a volte si attiva anche con basso carico di lavoro.
Nota: si tratta di una recensione breve, con alcune sezioni non tradotte, per la versione integrale in inglese guardate qui.
Dell XPS 13 2016 9350 (FHD, i7-6560U)
-
06/22/2016 v5.1(old)
J. Simon Leitner